RBL Bank Limited Research Report
|
Industry |
Market Price |
Recommendation |
Target |
Time Horizon |
|
Bank |
84.20 |
Hold |
111 |
1 Year |
Q4 FY 2022 Review
RBL Bank Limited reported net revenue of ₹2,20,076 Lakh for the quarter ended March 31, 2022, compared to ₹2,05,754 lakhs for March 31, 2021. Profit After Tax was ₹16,477 lakhs for the quarter ended March 31, 2022, as compared to ₹7,574 lakhs during the corresponding quarter of the previous year, respectively.
RBL Bank Limited - Investment Summary
|
CMP (₹) |
83.20 |
|
52 Week H/L |
226.40/74.15 |
|
Market Cap (crores) |
5,047 |
|
Face Value (₹) |
10.00 |
|
Promoter Holding (%) |
0 |
|
Non-Promoter Holding (%) |
100 |
|
Total (%) |
100.00 |
|
Book Value |
₹209 |
|
EPS TTM |
(₹2.77) |
RBL Bank Limited - Overview
-
RBL Bank is one of India’s leading private sector banks with an expanding presence across the country.
-
As of March 31, 2022, the bank had 502 branches, 260 banking outlets, 1418 business correspondents (including banking outlets, and 414 ATMs.
-
Mr. R Subramaniakumar is appointed as the new managing director & CEO of the bank for a period of three years with effect from June 23, 2022, after the Step-down of Mr. Vishwavir Ahuja.
|
Beta: 1.78 |
Alpha: -69.71 |
Risk Reward Ratio: 1.45 |
Margin of Safety: 21% |
RBL Bank Limited - Quarterly Summary
|
Quarterly (INR in lakhs) |
Mar-22 |
Dec-21 |
Sep-22 |
Jun-21 |
Mar-21 |
|
Interest Income |
2,20,076 |
2,10,655 |
2,03,411 |
2,10,344 |
2,05,754 |
|
Interest Expended |
99,969 |
1,03,382 |
1,05,899 |
1,05,574 |
1,05,876 |
|
Net Interest Income |
1,20,107 |
1,07,273 |
97,512 |
1,04,770 |
99,878 |
|
|
|
|
|
|
|
|
Other Income |
51,289 |
58,383 |
59,497 |
65,982 |
55,073 |
|
Total Income |
1,71,396 |
1,65,656 |
1,57,009 |
1,70,752 |
1,54,951 |
|
|
|
|
|
|
|
|
Employee Cost |
35,549 |
33,636 |
30,961 |
30,853 |
29,268 |
|
Other Expenses |
73,411 |
72,392 |
59,058 |
63,563 |
51,826 |
|
Provision and Contingencies |
40,066 |
42,389 |
65,149 |
1,38,436 |
62,663 |
|
EBT |
22,370 |
17,239 |
1,841 |
-62,100 |
11,194 |
|
|
|
|
|
|
|
|
Tax Expenses |
5,893 |
5,078 |
869 |
-15,875 |
3,620 |
|
PAT |
16,477 |
12,161 |
972 |
-46,225 |
7,574 |
Business
-
The Bank was incorporated in 1943 as ‘Ratnakar Bank Limited.
-
It received the status as a scheduled commercial bank in 1959.
-
The Bank underwent a management change in FY 2011, following which its corporate office was shifted to Mumbai. Apart from the management, the bank’s shareholding changed in FY 2011 with equity infusion from various private equity funds.
-
The name of the bank was changed from ‘Ratnakar Bank Limited’ to ‘RBL Bank Limited’ in 2014.
-
The bank was listed on the BSE and NSE with the initial public offering (IPO) in August 2016.
-
The Bank acquired a 100% stake in Swadhar Finserve Pvt Limited in 2018, where it had holding of 60.49% earlier.
-
RBL Bank’s operation span across various business segments comprising:
-
Wholesale Banking Comprising:
-
Corporate and Institutional Banking (C&IB):
-
The C&IB business segment offers extensive services to enterprises and corporate entities, especially large-size corporations (i.e., companies with over ₹1,500 crores annual turnover).
-
Sub-segments within C&IB have sectoral coverage and include: a) Financial Institutions, b) Governments, c) Multinational Clients, and d) Corporate Industry.
-
-
Commercial Banking (CB):
-
CB segment provides services to small & medium enterprises with turnover ranging from ₹50 to ₹250 crore and mid-market enterprises with turnover ranging from ₹250 to ₹1500 crore.
-
The predominant objective of this segment is to be ‘Bank of Choice’ for the transaction banking requirements of its clients by offering cash, trade, and forex services.
-
-
-
Retail Banking Comprising:
-
Banking and Business Banking (BBB):
-
BBB provides a complete suite of products across the entire spectrum from retail customers, small investor owners, and NRIs to retail institutions supported by multi-channel electronic banking systems, including mobile banking, internet banking, phone banking, WhatsApp banking, Chat pay, and ATMs.
-
-
Retail Assets:
-
MSME Business Lending:
-
The MSME business is an emerging business in the bank and is aligned to the strategic goal of satisfying the credit needs of micro and small enterprises and reaching out the last mile through a business correspondent network.
-
-
Housing Comprising both Affordable Housing and General Housing Business:
-
The bank started with the objective of offering affordable housing loans as part of the “Credit Linked Subsidy Scheme (CLSS)” central sector scheme under Pradhan Mantri Awas Yojana (Urban) (PMAY-U), a flagship mission of the government of India implemented by the Ministry of Housing and Urban Affairs (MOHUA) to promote housing for all.
-
-
Credit Cards:
-
RBL Bank’s credit card business is currently the 5th largest in the country, and the bank is the fastest-growing credit card issuer.
-
-
Retail Lending:
-
The bank’s retail lending arm provides financial services to small businesses and individuals, offering products such as loans against property, business loans, working capital cash credits/overdrafts, non-fund based and trade facilities aside from salaried personal loans.
-
-
Treasury and Financial Markets:
-
The Bank’s treasury operation includes interfacing with the financial markets and performing broad functions like managing statutory reserves, day-to-day fund management and asset-liability management, investment and trading activities, and interest rate and exchange.
-
-
-
-
-
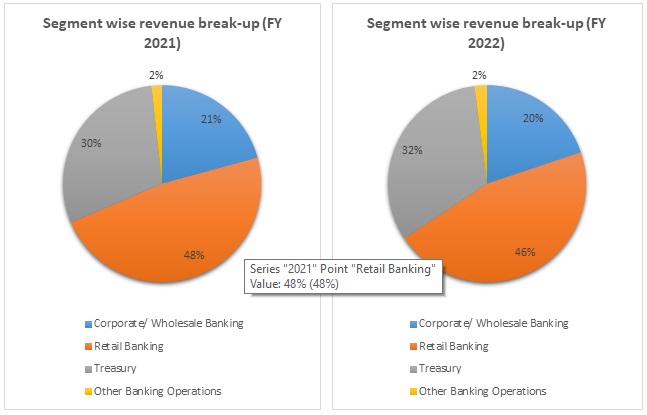
Out of the total revenue, 30% has been generated from Treasury operations, 21% from Corporate/wholesale Banking, 48% from Retail Banking, and 2% from others in FY 2022 compared to 32%, 20%, 46%, and 2% in FY 2021, respectively.
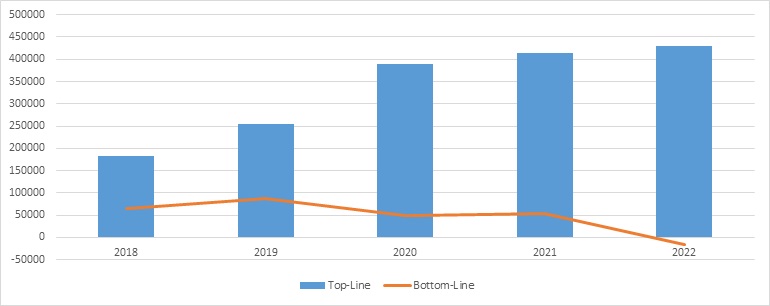
RBL Bank Limited - Revenue Trend
Topline and Bottomline trend (lakhs)
Ratio Analysis
|
|
Mar-18 |
Mar-19 |
Mar-20 |
Mar-21 |
Mar-22 |
|
Net Interest Income |
3.80% |
4.14% |
4.50% |
4.48% |
4.16% |
|
Gross NPA |
1.40% |
1.38% |
3.62% |
4.34% |
4.40% |
|
Net NPA |
0.78% |
0.69% |
2.05% |
2.12% |
1.34% |
|
Provision Coverage Ratio |
57.60% |
65.30% |
64.00% |
52.30% |
70.40% |
|
Capital Adequacy Ratio |
15.30% |
13.50% |
16.40% |
17.50% |
16.80% |
|
CASA Ratio |
24.30% |
25.00% |
29.60% |
31.80% |
35.30% |
|
Credit Deposit Ratio |
91.76% |
93.06% |
100.33% |
80.24% |
75.95% |
|
ROA |
1.21% |
1.27% |
0.59% |
0.54% |
(0.07%) |
|
ROE |
10.95% |
12.15% |
5.74% |
4.35% |
(0.60%) |
|
Slippage Ratio |
0.31% |
0.41% |
1.19% |
1.18% |
0.50% |
RBL Bank Limited - Financial Overview
Profit and Loss Statement (₹ in lakhs)
|
|
Mar-18 |
Mar-19 |
Mar-20 |
Mar-21 |
Mar-22 |
|
Net Interest Income |
3.80% |
4.14% |
4.50% |
4.48% |
4.16% |
|
Gross NPA |
1.40% |
1.38% |
3.62% |
4.34% |
4.40% |
|
Net NPA |
0.78% |
0.69% |
2.05% |
2.12% |
1.34% |
|
Provision Coverage Ratio |
57.60% |
65.30% |
64.00% |
52.30% |
70.40% |
|
Capital Adequacy Ratio |
15.30% |
13.50% |
16.40% |
17.50% |
16.80% |
|
CASA Ratio |
24.30% |
25.00% |
29.60% |
31.80% |
35.30% |
|
Credit Deposit Ratio |
91.76% |
93.06% |
100.33% |
80.24% |
75.95% |
|
ROA |
1.21% |
1.27% |
0.59% |
0.54% |
(0.07%) |
|
ROE |
10.95% |
12.15% |
5.74% |
4.35% |
(0.60%) |
|
Slippage Ratio |
0.31%x |
0.41% |
1.19% |
1.18% |
0.50% |
Cash Flow Statement (₹ in lakhs)
|
Mar-18 Mar-19 Mar-20 Mar-21 Mar-22 |
|||||
|
Net Profit Before Tax |
97382 |
129783 |
74735 |
71203 |
(20650) |
|
Net Cash from Operating Activities |
(255600) |
7823 |
(517256) |
(763143) |
644891 |
|
Net Cash Used for Investing Activities |
(16518) |
(20171) |
(22279) |
(17418) |
(26403) |
|
Net Cash From (Used For) Financing Activities |
2,99,403 |
2,56,665 |
7,69,785 |
(4,20,666) |
(10,930) |
|
Net Increase in Cash and Cash Equivalents |
27,285 |
2,44,317 |
2,30,250 |
3,25,059 |
6,07,558 |
|
Cash And Cash Equivalents at The Beginning of the Year |
3,20,746 |
3,48,031 |
5,92,348 |
8,22,598 |
11,47,657 |
|
Cash And Cash Equivalents at The End of the Year |
3,48,031 |
5,92,348 |
8,22,598 |
11,47,657 |
17,55,215 |
Balance Sheet (₹ in lakhs)
|
Mar-18 |
Mar-19 |
Mar-20 |
Mar-21 |
Mar-22 |
|
|
CAPITAL AND LIABILITIES: |
|
|
|
|
|
|
Capital |
41,967 |
42,671 |
50,870 |
59,802 |
59,951 |
|
Reserves and Surplus |
6,26,089 |
7,10,808 |
10,05,623 |
12,06,822 |
11,93,098 |
|
Minority Interest |
1,882 |
- |
- |
- |
- |
|
Deposits |
43,88,310 |
58,35,763 |
57,81,201 |
73,05,462 |
79,00,636 |
|
Borrowings |
9,26,144 |
11,83,207 |
17,00,691 |
11,22,614 |
11,09,776 |
|
Other Liabilities and Provisions |
2,03,335 |
2,67,330 |
3,59,961 |
3,67,177 |
3,52,803 |
|
Total |
61,87,727 |
80,39,779 |
88,98,346 |
1,00,61,877 |
1,06,16,264 |
|
|
|
|
|
|
|
|
ASSETS: |
|
|
|
|
|
|
Goodwill on Consolidation |
1,829 |
4,068 |
4,068 |
4,068 |
4,068 |
|
Cash and Balances with Reserve Bank of India |
2,58,946 |
4,84,005 |
6,41,567 |
6,70,474 |
13,11,108 |
|
Balances with Banks and Money at Call and Short Notice |
1,72,069 |
1,80,867 |
2,44,290 |
6,73,808 |
4,44,619 |
|
Investments |
15,39,704 |
16,74,517 |
18,05,455 |
23,08,523 |
22,12,916 |
|
Advances |
40,26,784 |
54,30,824 |
58,00,557 |
58,62,251 |
60,00,457 |
|
Fixed Assets |
33,964 |
41,551 |
49,242 |
49,520 |
57,842 |
|
Other Assets |
1,54,431 |
2,23,947 |
3,53,167 |
4,93,233 |
5,85,254 |
|
Total |
61,87,727 |
80,39,779 |
88,98,346 |
1,00,61,877 |
1,06,16,264 |
Industry Overview
-
The asset quality of the banking has improved, with the GNPA ratio declining from 7.4% in March 2021 to a six-year low of 5.9% in March 2022.
-
NNPA ratio fell during 2021-22 and stood at 1.7% banks have reduced the NNPA ratio through recoveries, write-offs, and reduction.
-
The stress test indicates that the GNPA ratio of all banks may improve from 5.9% in March 2022 to 5.3% by March 2023 under the baseline scenario driven by higher expected bank credit growth and a declining trend in the stocks of GNPA, as per Financial Stability Report (FSR).
-
If the Macroeconomics environment worsens, the GNPA ratio may rise from 6.2% to 8.3%, as per FSR. The provisioning coverage ratio improved from 67.6% in March 2021 to 70.9% in March 2022.
-
The Slippage ratio, measuring new addition to NPAs as a share of standard advances at the beginning of the period, declined across bank groups during FY 2022.
-
Write-off fell for the second year running to 20% in FY 2022.
-
Indian Banking Industry has recently witnessed the rollout of innovative banking models like payments and small finance banks. RBI’s new measure may go a long way in helping the restructuring of the domestic banking industry.
-
The digital payment systems in India have evolved among 25 countries, with India’s Immediate Payment Services (IMPS) being the only system at level five in the Faster Payments Innovation Index (FPII).
-
The Indian Banking System consists of 12 public sectors, 22 private sector banks, 46 foreign banks, 56 regional banks, 1485 urban co-operative banks, and 96,000 rural co-operative banks in addition to co-operative credit institutions as of September 2021.
-
As of February 21, 2022, the number of bank accounts opened under the government’s Flagships financial inclusion drive ‘Pradhan Mantri Jan Dhan’ (PMJDY) - reached 44.63 crores and deposits in the Jan Dhan Bank accounts totaled ₹1.58 trillion.
-
In January 2022, the Unified Payments Interface (UPI) recorded 4.62 billion transactions worth ₹8.32 trillion.
-
The number of transactions through Immediate Payment Service (IMPS) reached 430.67 million and amounted to ₹3.70 million.
Concall Overview (Q4FY2022)
-
Overall deposits increased to ₹79,000 crores as of March 31, 2022, while a large part of deposit accretion in Q4FY2022 was because of deposit flows from all segments. As bank progress during FY 2023, they are confident of continuing the path of increasing granularity in deposits with a larger portion of incremental deposits coming from retail segments.
-
Profitability has been better in Q4FY2022, which will further improve in coming quarters as interest-earning assets increase and retail composition grows.
-
Overall, the bank could see 15% to 20% growth in advances in FY 2023, resulting in higher and better running assets.
-
Net interest margin to be normalized from next quarter and after that, a bit of marginal increase.
-
The credit cost of credit cards in FY 2023, will be between 4% to 4.5%.
RBL Bank Limited - Technical Analysis
-
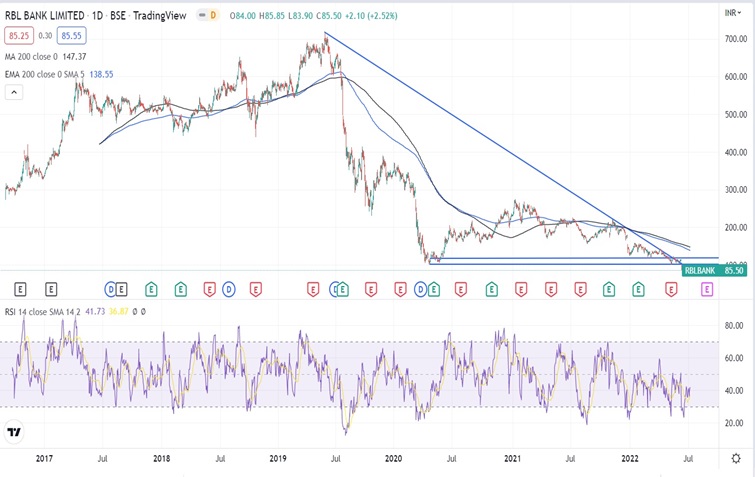
Stock is trading below EMA 200 and MA 200 indicators, with a support level of ₹81 and a resistance level of ₹102.
-
RSI on the daily chart is falling and is below 50, confirming bearish momentum.
-
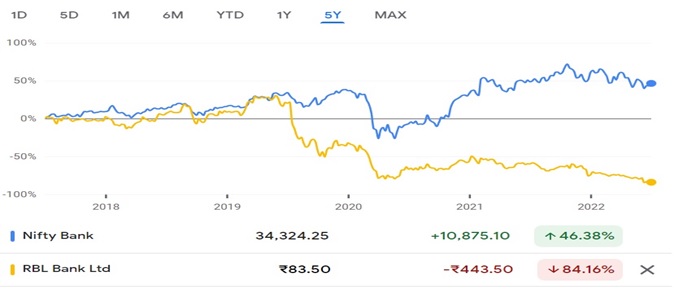
The share price of a stock has fallen from its all-time high of ₹716.70 to ₹75.15.
-
After the fall of share price from its all-the-time high by almost 90%, one could wait for some technical reversal to invest.
Peers Comparison
|
FY-2022 |
||||
|
|
GNPA |
NPA |
ROA |
ROE |
|
HDFC Bank Limited |
1% |
0.32% |
1.78% |
15.39% |
|
Kotak Mahindra Bank Limited |
2% |
0.64% |
1.99% |
11.90% |
|
RBL Bank Limited |
4.40% |
1.34% |
-0.07% |
-0.60% |
Recommendation Rationale
-
RBL’s internal capital generation has remained weak due to the slippages in the corporate book in FY 2020, followed by the onset of the Covid-19 pandemic and the surge in the secured loan book.
-
The overall share of the high-yielding unsecured retail segment (i.e., credit cards, microfinance, and unsecured business loans) remained relatively high at 44% as of 31 March 2022. This has been a source of asset quality challenges for RBL following the onset of the pandemic.
-
RBL’s share price has tumbled 90% from its all-time high due to the occurrence of the following events:
-
Speculation regarding the sale of 3,50,000 shares by employees (Insider Trading) of RBL Bank after the outbreak of the issue of Café Coffee Day (CCD) as of 31 July 2019, though management has clarified that there was no connection between the happening of two events.
-
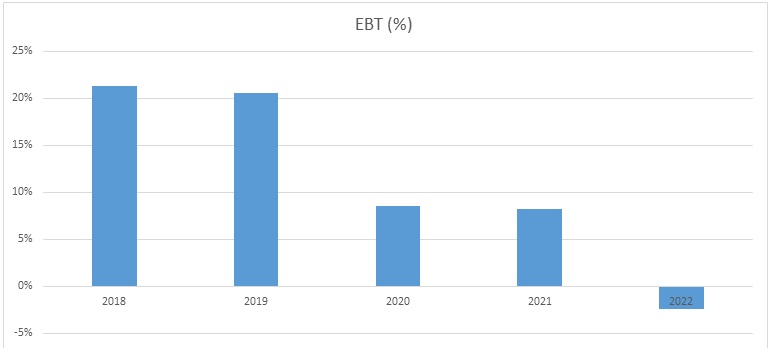
The concern is also raised regarding the asset quality of the bank, as the net profit is reduced from ₹86,136 lakhs in FY 2019 to (₹16,615) in FY 2022.
-
Step-down of MD & CEO Vishwavir Ahuja as of 25 December 2021 and appointment R.Subramaniakumar as new MD & CEO with effect from 23 June 2022 for 3 years. The management gives no clear clarification regarding the step-down of Mr. Vishwavir Ahuja.
-
-
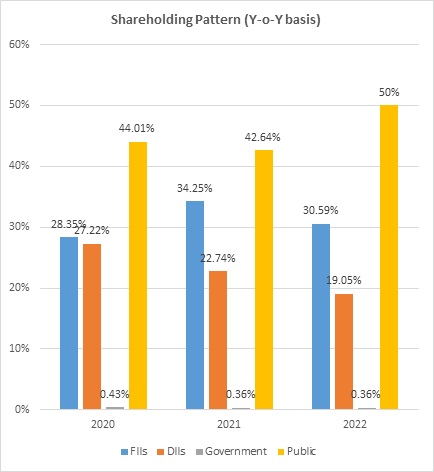
FIIs have reduced their stake in the bank from 31.31% to 30.59% in Q4FY2022.
-
The slippage Ratio has improved on Q-o-Q basis from 1.18% in Q1FY2022 to 0.50% in Q4FY2022.
-
Total deposits and gross advances increased by 6% and 7% to ₹79,217 crores and ₹62,075 crores in Q1FY2023 (Provisional data) as compared to the corresponding previous year. “Asset quality parameter on the portfolio continues see improvement in Q1FY 2023, in line with improving trend of the past few quarters.” (As per the report published by RBL Bank on 05 June 2022).
-
Though the financials of the bank could improve with the easing of the Covid-19 pandemic, improving sentiments of businesses, and increasing demand for goods and services in retail segments.
-
How new management would improve the asset quality and stability of the bank and bring the bank back on growth would be worth seeing.
Valuation
-
The Bank’s Net Interest Income has increased at a CAGR of 11.8 % from FY 2019-2021
-
The Bank’s bottom line has deteriorated from FY 2019.
-
RBL’s ROA and ROE has also been reduced from 1.27% & 12.5% in FY 2019 to (-0.07%) & (-0.60%) in FY2022.
-
GNPA ratio has increased from 4.34% in FY 2021 to 4.40% in FY 2022. NPA ratio has improved from 2.12% in FY 2021 to 1.34% in FY 2022, but both ratios are more if compared with peers (HDFC Bank Limited & Kotak Mahindra Bank Limited).
-
Based on the company’s current performance in FY 2022, we expect the company could post higher Net Interest income for the next FY 2023, corresponding to the previous year.
-
Deposits have increased by 8% to ₹79,00,635 lakhs in FY 2022 compared to the previous year and Advances have increased by only 2% to ₹60,00,457 lakhs in FY 2022 compared to the previous year.
-
We have taken data for the last five years (2018-2022) and forecasted revenue for FY 2023-2027. Revenue growth is assumed to be 15%.
Estimated Income Statement (₹ in lakhs)
|
|
Mar-23 |
Mar-24 |
Mar-25 |
Mar-26 |
Mar-27 |
|
|
2023-E |
2024-E |
2025-E |
2026-E |
2027-E |
|
Interest income |
10,04,866 |
11,65,645 |
13,52,148 |
15,68,492 |
18,19,450 |
|
Interest Expended |
5,30,923 |
5,94,633 |
6,65,989 |
7,45,908 |
8,35,417 |
|
Net Interest Income |
4,73,943 |
5,71,011 |
6,86,158 |
8,22,583 |
9,84,033 |
|
|
|
|
|
|
|
|
Other income |
2,58,666 |
2,84,533 |
3,12,986 |
3,44,285 |
3,78,713 |
|
Total income |
7,32,610 |
8,55,544 |
9,99,144 |
11,66,868 |
13,62,746 |
|
|
|
|
|
|
|
|
Employee Cost |
1,32,202 |
1,53,354 |
1,77,891 |
2,06,353 |
2,39,370 |
|
Other expenses |
2,63,192 |
3,05,303 |
3,54,152 |
4,10,816 |
4,76,546 |
|
Provision and Contingencies |
2,99,205 |
3,47,078 |
4,02,610 |
4,67,028 |
5,41,752 |
|
EBT |
38,010 |
49,809 |
64,492 |
82,671 |
1,05,078 |
|
|
|
|
|
|
|
|
Tax expenses |
9,503 |
12,452 |
16,123 |
20,668 |
26,269 |
|
PAT |
28,508 |
37,357 |
48,369 |
62,003 |
78,808 |
-
We initiate coverage on RBL Bank Limited with a “Hold” and a 1-year Target Price of ₹ 111.
Disclaimer: This report is only for the information of our customers Recommendations, opinions, or suggestions are given with the understanding that readers acting on this information assume all risks involved. The information provided herein is not to be construed as an offer to buy or sell securities of any kind.
- Share :


Post a Comment
|
DISCLAIMER |
This report is only for the information of our customers. Recommendations, opinions, or suggestions are given with the understanding that readers acting on this information assume all risks involved. The information provided herein is not to be construed as an offer to buy or sell securities of any kind. ATS and/or its group companies do not as assume any responsibility or liability resulting from the use of such information.