How to Read Candlestick Patterns
Reading price action one candle at a time.
Candlesticks are the most popular way to read a price chart. Each candle is a compact story of the battle between buyers and sellers over one period — and learning to read them is the foundation of all chart-based trading.
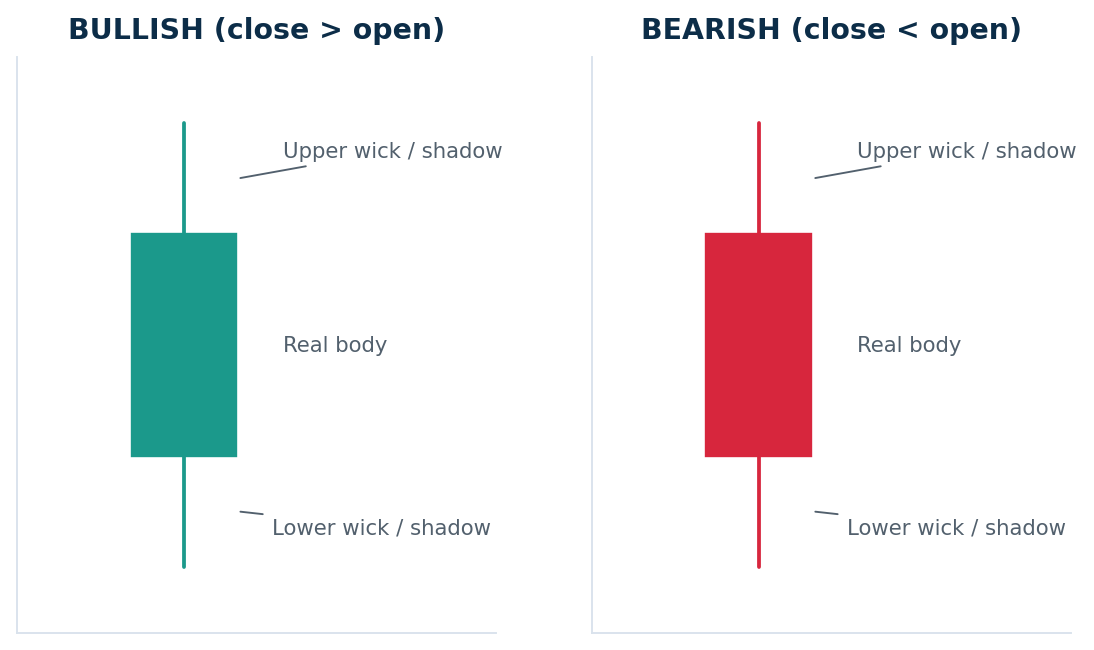
The two basic candles. The body spans open-to-close; the wicks reach the high and low.
Reading a single candle
The body shows the distance between the open and close — a long body means one side won decisively. The wicks (shadows) show how far price was pushed and rejected. A long lower wick means buyers rejected lower prices; a long upper wick means sellers rejected higher prices. Green = close above open (bullish); red = close below open (bearish).
The patterns worth knowing first
| Pattern | Typical meaning |
|---|---|
| Doji | Indecision; possible reversal |
| Hammer | Bullish reversal after a downtrend |
| Shooting Star | Bearish reversal after an uptrend |
| Bullish / Bearish Engulfing | Strong reversal at a level |
| Morning / Evening Star | High-reliability reversal |
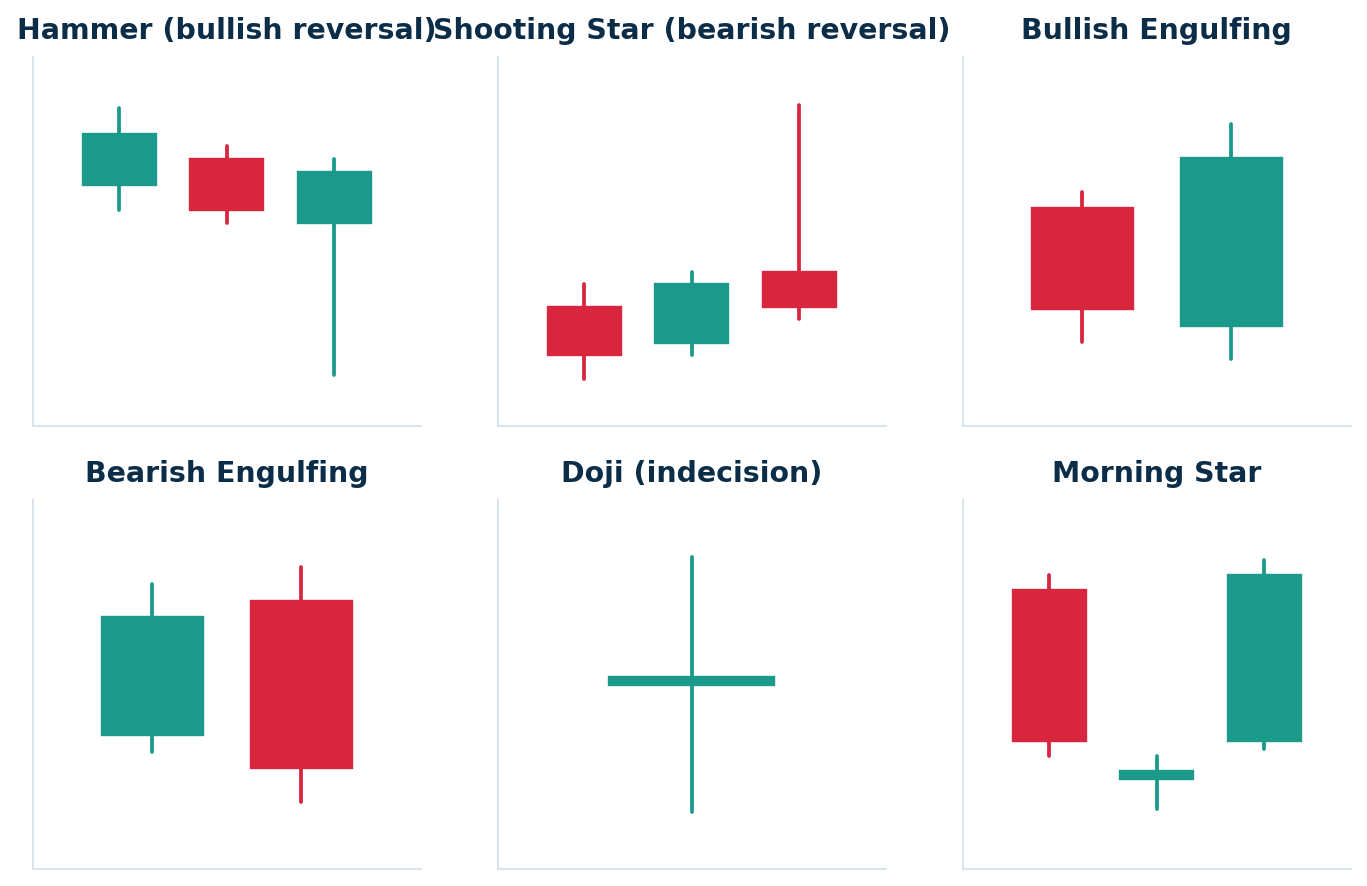
A quick reference grid of the highest-probability reversal patterns.
Make patterns reliable
A pattern on its own is only a hint. Combine it with context to raise the odds: the pattern should appear after a clear trend, ideally at a support or resistance level, and be backed by higher-than-usual volume. Cautious traders wait for the next candle to confirm the direction before entering.
Single, double and triple candles
Patterns are grouped by how many candles they span. Single-candle signals (Doji, Hammer, Shooting Star) appear often but produce more false alarms. Two-candle patterns like the Engulfing are the reliable workhorses. Three-candle patterns (Morning Star, Evening Star) are rarer but cleaner, because they show a full transition from one side winning to the other.
A simple five-step workflow
- Identify the trend — this tells you which patterns to look for.
- Mark the nearest support and resistance.
- Wait for a pattern to form at a level, not in open space.
- Confirm with volume, or wait one candle for confirmation.
- Set your stop beyond the pattern before you enter.
WATCH OUT · Patterns are probabilities, not promises. No candlestick pattern works every time. Always pair it with a stop-loss so a failed pattern costs you only a small, planned loss.
Key takeaways
- Each candle shows the open, high, low and close — a story of one period.
- The body shows who won; the wicks show rejection of higher or lower prices.
- Learn a few patterns well: Hammer, Engulfing, Morning/Evening Star.
- Confirm every pattern with trend, levels and volume — and always use a stop.
Ready to practise this? Open a Demat & trading account with Aditya Trading Solutions — low brokerage, pro charting, 24×7 support. More free guides at adityatrading.in/EBooks.
Educational use only. Published by ATS Share Brokers Pvt. Ltd. (SEBI Regn. INZ000205136). Not investment advice or a recommendation to buy or sell any security. Trading and investing carry a high risk of loss; patterns and strategies can fail and past performance does not indicate future results. Consult a SEBI-registered adviser before trading.
Frequently Asked Questions
They improve your odds but never guarantee an outcome. They work best when combined with trend, support/resistance and volume — never traded in isolation.
Start with the Hammer, the Engulfing pattern and the Morning/Evening Star. A small set used well beats memorising dozens you cannot apply.
Match it to your style: 5–15 minutes for intraday, the daily chart for swing trading. The patterns mean the same thing on every timeframe.