Technical Analysis Essentials
Trend, levels and the indicators that matter.
Technical analysis studies price itself — the footprints buyers and sellers leave on a chart — to decide when to buy, sell, and at what risk.
The three core ideas
- Price discounts everything — all known information is already in the price.
- Price moves in trends — a trend is more likely to continue than reverse until proven otherwise.
- History repeats — chart patterns recur because crowd psychology recurs.
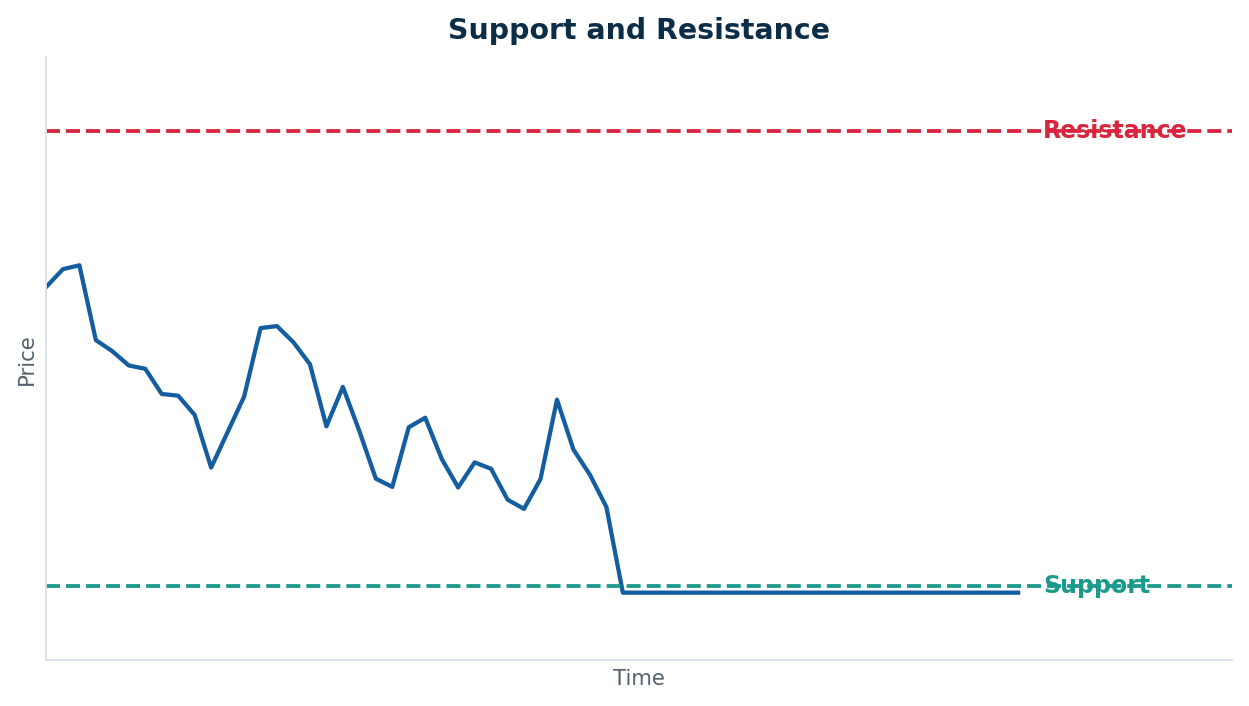
Support is a floor where buyers step in; resistance is a ceiling where sellers take over.
Trend, support and resistance
Start every analysis by identifying the trend: higher highs and higher lows is an uptrend; the reverse is a downtrend. Then mark support (a price floor) and resistance (a ceiling). The highest-quality trades happen with the trend, at a level the market clearly respects. A broken level often flips role — old resistance becomes new support.
A few indicators, used well
You need a handful, not hundreds. Moving averages reveal the trend; RSI flags overbought/oversold conditions and momentum divergence; volume confirms whether a move has real conviction behind it. When an indicator disagrees with price, trust price.
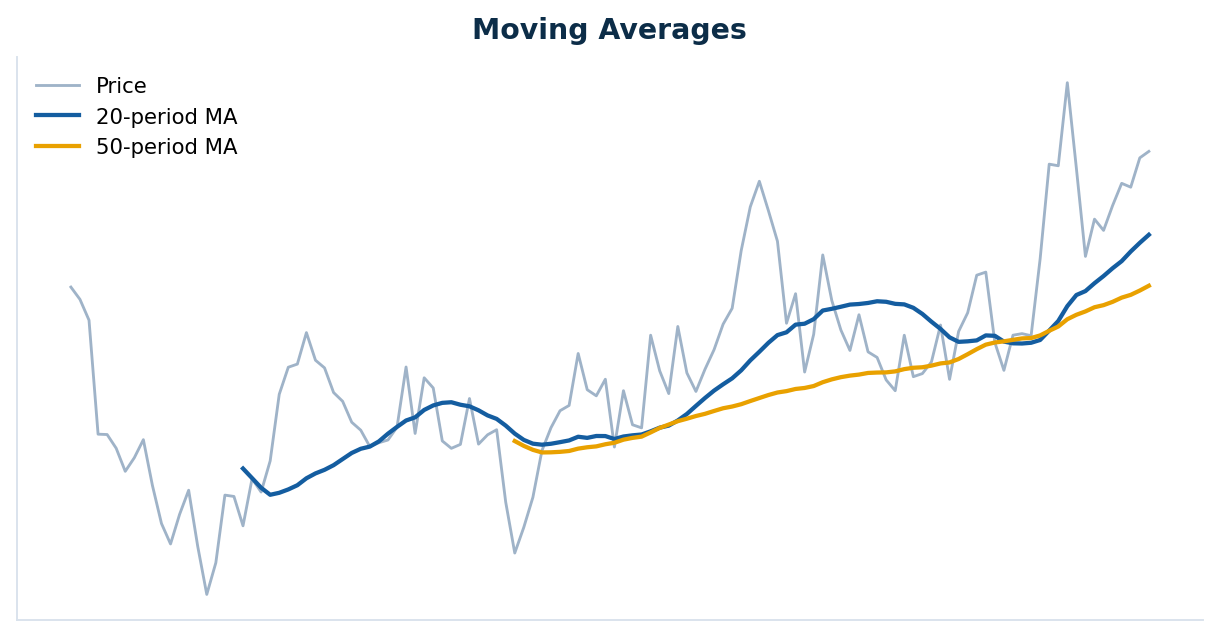
Moving averages turn noisy price into a readable trend.
Match the timeframe to your style
The same chart looks different on different timeframes. Intraday traders work on 5-minute to 1-hour charts; swing traders on the daily; investors on the weekly. The professional habit is multi-timeframe analysis: use a higher timeframe to set the dominant trend and major levels, and your trading timeframe to time the entry. Take trades where both point the same way.
Reading momentum with RSI
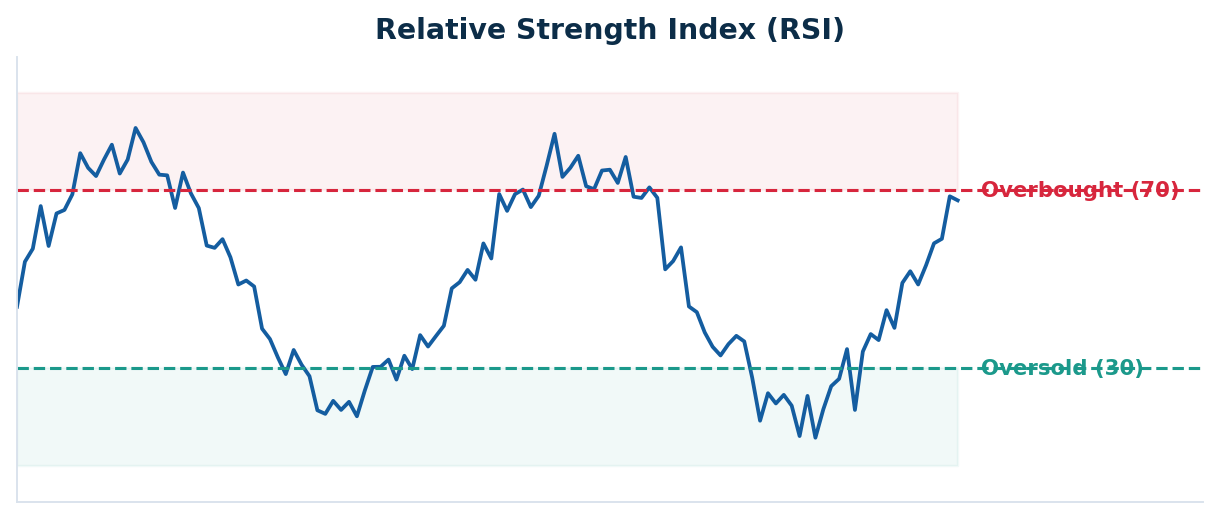
RSI above 70 is overbought, below 30 oversold; divergence from price is its most useful signal.
GOLDEN RULE · Define risk before you enter. Every trade needs three prices set in advance: entry, stop-loss (where you are wrong), and target. Aim for a target at least twice your risk.
Key takeaways
- Start every analysis by identifying the trend and trading with it.
- Mark support and resistance; the best trades happen at respected levels.
- Use only a few indicators; when an indicator disagrees with price, trust price.
- Define entry, stop and target before every trade.
Ready to practise this? Open a Demat & trading account with Aditya Trading Solutions — low brokerage, pro charting, 24×7 support. More free guides at adityatrading.in/EBooks.
Educational use only. Published by ATS Share Brokers Pvt. Ltd. (SEBI Regn. INZ000205136). Not investment advice or a recommendation to buy or sell any security. Trading and investing carry a high risk of loss; patterns and strategies can fail and past performance does not indicate future results. Consult a SEBI-registered adviser before trading.
Frequently Asked Questions
Neither is "better" — they answer different questions. Fundamentals tell you what to own; technicals tell you when to buy or sell and at what risk. Many traders use both.
A few, used well. Moving averages, RSI and volume are enough for most traders. Adding more usually creates conflicting signals, not clarity.
Trend. Identify it first on a higher timeframe and trade with it; most losses come from fighting the dominant trend.