Chart Patterns Every Trader Should Know
Reversals, continuations and how to trade them.
Chart patterns are recurring shapes that signal either a reversal of the trend or a pause before it continues. A handful do most of the work.
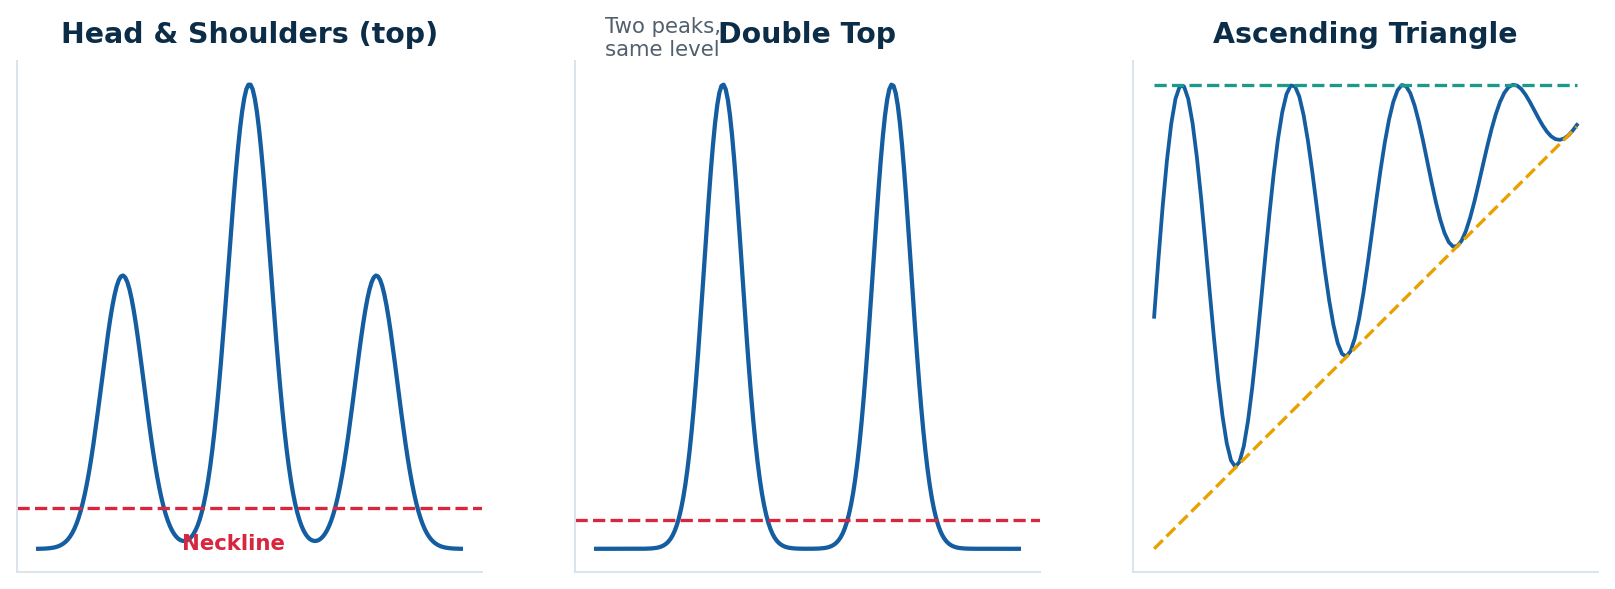
Two reversals (head & shoulders, double top) and a continuation (ascending triangle).
Reversal patterns
Head and Shoulders is the classic top: three peaks with the middle highest, and a "neckline" joining the lows. A close below the neckline signals a reversal, and the head's height gives a rough target. The inverted version marks bottoms. Double Tops (M) and Double Bottoms (W) form when price tests a level twice and fails to break it.
Continuation patterns
Triangles show price coiling into a tighter range before breaking out, usually in the direction of the prior trend. Flags and pennants are brief pauses after a sharp move — a rest before the trend resumes.
| Pattern | Type | Signal |
|---|---|---|
| Head & Shoulders | Reversal | Trend top (or bottom, inverted) |
| Double Top / Bottom | Reversal | Failure at a level |
| Ascending Triangle | Continuation | Usually a bullish breakout |
| Flag / Pennant | Continuation | Trend resumes after a pause |
| Cup & Handle | Continuation | Bullish continuation |
How to trade a pattern
The pattern itself is only a setup — the trade begins when price breaks the key line (the neckline, the trendline, the edge of the triangle). Enter on the break, ideally on a clear rise in volume. Place your stop on the other side of the pattern, where the break would be proven false. For a price target, "measure" the pattern: the height of a head-and-shoulders or a triangle, projected from the breakout point, gives a reasonable objective.
Avoid the false breakout trap
- Demand volume. Real breakouts are backed by a surge in participation.
- Beware the open. Many false breaks happen in the first volatile minutes.
- Wait for the close. A candle that closes beyond the line is stronger than one that merely pokes through it.
- Respect the trend. Breakouts in the direction of the larger trend succeed far more often than counter-trend ones.
KEY TAKEAWAY · Wait for the break, confirm with volume. A pattern is only a setup until price breaks its key line. Breakouts on rising volume are far more reliable than those on thin volume.
Key takeaways
- A handful of patterns do most of the work: H&S, double top/bottom, triangles.
- Patterns signal reversals or continuations — know which is which.
- Enter on the break of the key line, confirmed by volume.
- Project the pattern's height for a reasonable price target.
Ready to practise this? Open a Demat & trading account with Aditya Trading Solutions — low brokerage, pro charting, 24×7 support. More free guides at adityatrading.in/EBooks.
Educational use only. Published by ATS Share Brokers Pvt. Ltd. (SEBI Regn. INZ000205136). Not investment advice or a recommendation to buy or sell any security. Trading and investing carry a high risk of loss; patterns and strategies can fail and past performance does not indicate future results. Consult a SEBI-registered adviser before trading.
Frequently Asked Questions
Candlesticks form over one to three candles and signal short-term sentiment; chart patterns form over many candles and map larger moves like reversals and breakouts.
Not when the pattern forms, but when price breaks its key line (neckline, trendline or triangle edge), ideally on rising volume.
When price breaks a level then quickly reverses back, trapping traders. Waiting for a candle to close beyond the level and demanding volume helps filter these out.