4. What Does the Net Profit Margin Indicate?
The Net Profit Margin is one of the most important profitability indicators. It tells you how much of every rupee of revenue a company actually keeps as profit after covering all expenses—including cost of goods sold, operating costs, interest, and taxes.
In other words, this ratio answers a fundamental question:
"After paying for everything—materials, salaries, rent, debt, and taxes—how much profit does the company actually keep?"
Net Profit Margin: The Formula
Net Profit Margin (%) = (Net Profit / Revenue) × 100
- Net Profit (also called net income or bottom line): The final figure on the income statement after all expenses.
- Revenue: The total income generated from the sale of goods or services before any expenses are deducted.
What Does It Show?
The Net Profit Margin measures the efficiency of a business in converting revenue into actual profit. It reflects the company's capability to control costs across production, operations, financing, and taxation.
Key Insights from Net Profit Margin
| Range | Meaning |
|---|---|
Example Calculation
Let’s consider a company:
- Revenue: ₹2,00,00,000
- Net Profit: ₹20,00,000
Net Profit Margin = (20,00,000 / 2,00,00,000) × 100 = 10%
This means the company keeps ₹10 as profit from every ₹100 it earns in sales.
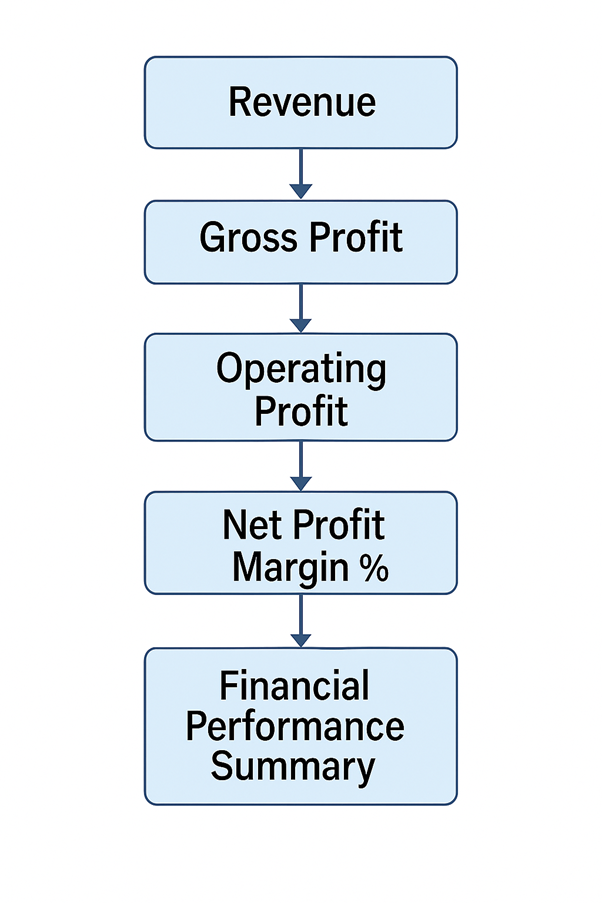
Net Profit Margin in the Context of the Income Statement
Industry Example: Comparing 3 Companies
| Company | Revenue (₹ Cr) | Net Profit (₹ Cr) | Net Profit Margin (%) | Industry |
|---|---|---|---|---|
Interpretation:
- ITC has a significantly higher net margin due to its high-margin tobacco business.
- HUL and Britannia, despite strong sales, operate in lower-margin consumer segments.
Factors Influencing Net Profit Margin
| Factor | Positive Impact | Negative Impact |
|---|---|---|
Real-World Investor Uses
-
Comparing Companies:
An investor comparing two companies with similar revenues can use net margin to identify the more profitable one. -
Tracking Performance Over Time:
If a company’s margin improves YoY, it may be controlling costs better or increasing pricing power. -
Valuation and Stock Screening:
Consistently high margins may indicate a competitive moat or strong brand.
Example: Stock Decision Based on Margin
Let’s say you're comparing two companies:
| Metric | Company A | Company B |
|---|---|---|
Even though both have equal revenue, Company A is more profitable, keeping over twice the profit as Company B.
Benefits of Using Net Profit Margin
| Benefit | Why It Matters |
|---|---|
Limitations of Net Profit Margin
| Limitation | Explanation |
|---|---|
Key Takeaways
- Net Profit Margin = ultimate profitability metric
- Indicates how much revenue turns into actual profit after all expenses
- High margins imply operational efficiency and pricing power
- Should be tracked over time and compared against industry peers
- Use alongside other ratios for a complete financial picture