6. What is ROA?
Return on Assets (ROA) is a profitability ratio that measures how efficiently a company uses its assets to generate profits. It helps investors and analysts assess the effectiveness of asset management by showing how much profit a company can generate per unit of its assets.
ROA is calculated using the following formula:
ROA = (Net Income / Total Assets) × 100
Where:
- Net Income represents the company’s total earnings after all expenses, taxes, and interest.
- Total Assets refers to the overall value of all resources owned by the company, such as cash, buildings, machinery, and inventory.
A higher ROA indicates that a company is using its assets more effectively to generate earnings. A lower ROA may suggest inefficiency or underutilization of resources.
Why ROA Matters
- Efficiency Measure: ROA tells you how well a company uses its assets to generate profits. It’s a direct reflection of how efficiently the company's management is utilizing its resources to create value.
- Capital-Intensive Industries: ROA is especially useful in comparing companies in sectors where large investments in assets are common. For example, manufacturing and utilities sectors tend to have higher asset values, making ROA a crucial metric.
- Investment Decision-Making: Investors use ROA to determine the ability of a company to generate profit from its assets, helping them make more informed decisions about where to allocate their funds.
- Growth Indicator: A high ROA suggests that the company is growing efficiently, generating strong returns on its investments in assets. It indicates potential for scaling operations without excessive investment in assets.
ROA in Practice
Example of ROA Calculation:
- Company A:
- Net Income: ₹50,000,000
- Total Assets: ₹500,000,000
- ROA = (₹50,000,000 / ₹500,000,000) × 100 = 10%
- Company B:
- Net Income: ₹30,000,000
- Total Assets: ₹200,000,000
- ROA = (₹30,000,000 / ₹200,000,000) × 100 = 15%
Despite having higher total assets, Company A generates a lower return on its assets compared to Company B, which indicates that Company B is more efficient in using its assets to generate profits.
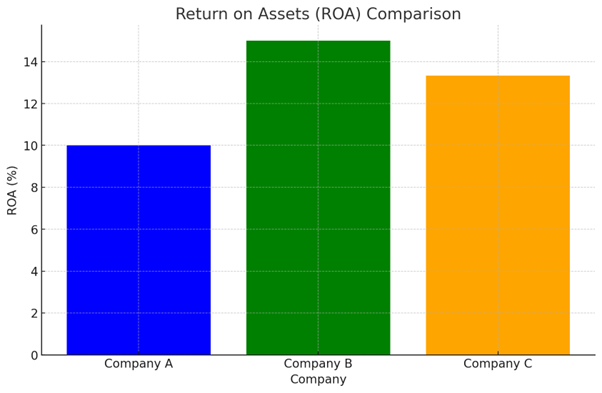
Table: ROA Comparison Across Companies
| Company | Net Income (₹) | Total Assets (₹) | ROA (%) |
|---|---|---|---|
Chart: ROA Comparison
Let me present a chart visualizing the ROA comparison among the companies.
Here is the updated ROA Comparison Chart. As shown, Company B has the highest ROA, which suggests it is more efficient in utilizing its assets to generate profits compared to the other companies.
Key Takeaways
- Company A generates ₹10 profit for every ₹100 of assets, resulting in an ROA of 10%.
- Company B is the most efficient, with an ROA of 15%, generating ₹15 profit for every ₹100 of assets.
- Company C shows a slightly lower ROA of 13.33%, indicating effective, though slightly less efficient, use of assets compared to Company B.
ROA is an important metric for comparing companies, especially in capital-intensive industries, to assess how well they are leveraging their assets to create value and generate profits.