7. What Are Liquidity Ratios?
Liquidity ratios are financial metrics used to assess a company's ability to meet its short-term liabilities with its most liquid assets. These ratios provide insight into a company's financial health, indicating whether it has enough assets available to pay off its current obligations, such as bills, loans, and other short-term debts.
Liquidity ratios are essential for both investors and creditors, as they give a clear picture of a company's financial flexibility and its ability to weather economic downturns or unexpected expenses.
Common Liquidity Ratios
Here are the two most commonly used liquidity ratios:
- Current Ratio
The current ratio measures a company's ability to cover its short-term obligations with its short-term assets. It is calculated as:

Where:
- Current Assets: Assets that are expected to be converted into cash within one year (e.g., inventory, receivables, cash).
- Current Liabilities: Liabilities that are due within one year (e.g., accounts payable, short-term debt).
A higher current ratio indicates a stronger liquidity position, meaning the company is better able to meet its short-term obligations. Typically, a ratio of 1 or above is considered healthy, as it means the company has enough assets to cover its liabilities.
Example:
- Company A has Current Assets of ₹5,000,000 and Current Liabilities of ₹3,000,000:
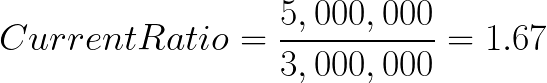
This indicates that Company A has ₹1.67 in assets for every ₹1 in liabilities, suggesting good liquidity.
- Quick Ratio (Acid-Test Ratio)
The quick ratio is a more stringent test of liquidity. It excludes inventory from current assets, as inventory might not be as easily converted into cash in the short term. It is calculated as:

Where:
- Inventory: The value of goods held for resale.
The quick ratio gives a more conservative view of a company's ability to meet its short-term obligations because it excludes inventory, which may not be easily liquidated.
A quick ratio of 1 or higher is generally considered good, as it suggests the company can cover its short-term liabilities with liquid assets without relying on inventory.
Example:
- Company B has Current Assets of ₹5,000,000, Inventory of ₹2,000,000, and Current Liabilities of ₹3,000,000:
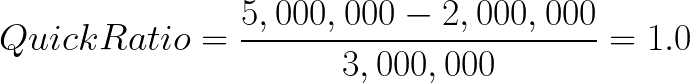
This suggests that Company B can cover its liabilities entirely with liquid assets (excluding inventory).
Why Liquidity Ratios Matter
- Assessing Financial Health: Liquidity ratios indicate how easily a company can meet its immediate financial obligations. Low liquidity ratios can signal potential financial trouble, while high ratios indicate solid financial health and the ability to handle unexpected expenses.
- Investor and Creditor Confidence: Investors and creditors often rely on liquidity ratios to gauge the risk of investing in or lending to a company. Strong liquidity ratios increase confidence, while weak liquidity ratios might signal financial instability.
- Operational Flexibility: Companies with strong liquidity ratios have greater flexibility in managing their operations and can react more effectively to short-term challenges.
Liquidity Ratios Comparison Example
Let’s look at a quick comparison between two companies with different liquidity positions:
| Company | Current Assets (₹) | Inventory (₹) | Current Liabilities (₹) | Current Ratio | Quick Ratio |
|---|---|---|---|---|---|
Key Insights:
- Company A has a higher current ratio and quick ratio, indicating a stronger liquidity position compared to Company B.
- Company B has a current ratio above 1, but its quick ratio is lower due to high inventory, suggesting it may struggle to meet liabilities if inventory is slow to convert into cash.
Visualizing Liquidity Ratios
Here’s a chart comparing the current ratio and quick ratio for the two companies.
Here is the Liquidity Ratios Comparison Chart between Company A and Company B. It shows both the Current Ratio and the Quick Ratio for each company.
Key Takeaways
- Company A has a strong liquidity position with both a high Current Ratio (1.67) and Quick Ratio (1.33), indicating good short-term financial stability.
- Company B has a lower Quick Ratio (0.50), suggesting that its liquidity position is weaker when excluding inventory, despite having a decent Current Ratio (1.33).
Liquidity ratios provide important insights into a company's ability to manage its short-term obligations effectively.