9. What is the Debt-to-Equity Ratio?
The Debt-to-Equity Ratio (D/E) is a fundamental financial metric used to evaluate a company's capital structure—specifically how much of the company’s funding comes from borrowed funds (debt) versus owner-invested funds (equity).
It is a leverage ratio, providing insight into the risk a company carries and its financial strategy. This metric is widely used by investors, lenders, credit rating agencies, and analysts.
In simple terms:
The Debt-to-Equity ratio tells us:
“How many rupees of debt has the company borrowed for every rupee of shareholder capital?”
Formula
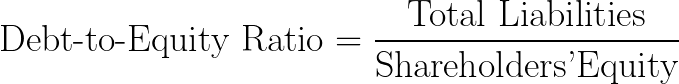
- Total Liabilities include all short-term and long-term debts, such as bank loans, bonds, lease obligations, and any other borrowings.
- Shareholders' Equity is the total capital owned by shareholders, including common equity and retained earnings.
Interpretation: What the Ratio Means
| D/E Ratio Value | Meaning |
|---|---|
Real-World Example
Let’s say a company has:
- Total Liabilities: ₹150 crore
- Shareholders’ Equity: ₹75 crore
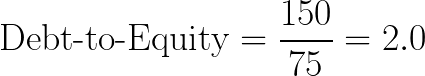
Interpretation: The company has ₹2 in debt for every ₹1 of equity—a high leverage ratio indicating increased risk.
Application Across Industries (FY24 Example)
| Company | Total Debt (₹ Cr) | Equity (₹ Cr) | D/E Ratio | Commentary |
|---|---|---|---|---|
Why It’s Important
| Use Case | Insight Provided |
|---|---|
Sector-Wise Norms for D/E
| Industry | Normal D/E Range | Reasoning |
|---|---|---|
Benefits and Risks of High D/E
| Benefits | Risks |
|---|---|
Visual Flow: How Debt and Equity Impact D/E
graph TD
A[Total Liabilities] --> D[Debt-to-Equity Ratio]
B[Shareholders' Equity] --> D
D --> E[Capital Structure Risk Indicator]
Key Limitations
| Limitation | Explanation |
|---|---|
Key Takeaways
- Debt-to-Equity Ratio measures the balance between borrowed funds and shareholder capital.
- A high D/E ratio may indicate higher risk due to financial leverage.
- A low D/E ratio reflects strong financial health and greater investor safety.
- Ideal levels of D/E vary across industries—it must always be interpreted in sectoral context.
- Combine with other metrics like Interest Coverage Ratio and Cash Flow from Operations for deeper insight.