ADANI PORTS AND SEZ LTD
APSEZ - Company Profile
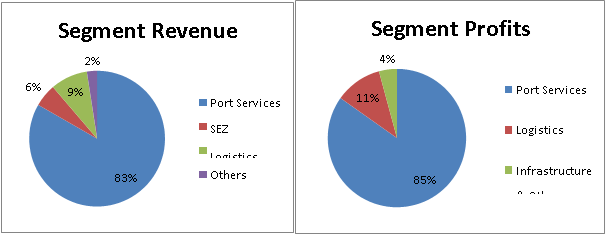
Adani Ports and Special Economic Zone Limited (APSEZ) is one of the largest conglomerates which operates port services, logistics, infrastructure leasing and other ancillary services. APSEZ is India’s largest Ports Developer and Operator Company. APSEZ has built, acquired and developed a portfolio of ports infrastructure and services across India. The ten strategically located ports and terminals represent 24% of India’s port capacity, cargo handling and servicing. APSEZ was established in 1998 and has grown exponentially over 19 years. In logistics business, the company has 24 berths in India’s largest port- Mundra Ports.
APSEZ - Investment Summary
|
CMP(22/8/17)(Rs) |
376.05 |
|
52 Week H/L |
421.60/229.20 |
|
Market Cap (Cr) |
77,039.41 |
|
Equity Cap (Cr) |
414.19 |
|
Face Value (Rs) |
2.00 |
|
Promoter Holding(%) |
61.30 |
|
Non-Promoter Holding (%) |
38.70 |
|
Total (%) |
100.00 |
-
Market leader in ports and shipping business with ambitious expansion plans.
-
Sound business with robust growth in revenue and profits over last 5 years.
-
Penetration into complete value chain in port and shipping business and successful foray into ancillary businesses
-
Growing importance of India in global trade presents opportunity for market leaders like APSEZ.
APSEZ - Financial Summary
|
Particulars(Rs. Cr) |
FY13 |
FY14 |
FY15 |
FY16 |
FY17 |
|
Net Sales |
3,486.42 |
4,580.89 |
5,893.78 |
6,968.76 |
8,427.35 |
|
Cost of Sales |
2,164.46 |
3,529.88 |
4,336.41 |
4,783.69 |
5,578.03 |
|
Profit after Tax |
1,638.83 |
1,741.00 |
2,324.49 |
2,829.94 |
3,892.24 |
|
EPS( Rs) |
8.00 |
8.00 |
11.00 |
14.00 |
19.00 |
Outlook
The company’s revenues have grown at an average of 24.81% over the last 5 years and the net profits have grown at an average rate of 24.75%. The company invests its net profits in deposits and gives out loans and does not invest back into property, plant and equipment. The company has not paid any significant dividends in FY17. The company has maintained an average profit margin of 42.3% from FY13-FY17 and the company’s earnings per share have grown year on year. The earnings accruing to the shareholder have doubled since FY13.
APSEZ - Company Overview
Below is the breakdown of the company’s different businesses:
-
Ports and Terminals
West Coast Ports
East Coast Ports
Mundra Port
Dhamra Port
Tuna Terminal
Vizag Terminal
Dahej Port
Kattupalli Port
Hazira Port
Ennore Terminal
Murmugao Port
Vizhinjam Port
-
Industrial Land
Adani’s Mundra Industrial land spans over 15,000 hectares on the western coast of India’s Gulf of Kutch. It is the hub for Indian imports and exports. Mundra Industrial land includes integrated facilities with investment options in multi-product Special Economic Zone, Free Trade Warehousing Zone, and Domestic Industrial Zone. The zone offers developed industrial clusters for small/medium projects as well as for mega projects with desired land parcels along with excellent logistic connectivity, power, and other utilities. APSEZ has an industrial land parcel in the Mundra Industrial zone for its mega projects. Mundra offers a manufacturing zone that is well connected with all global locations through the sea - Middle-East, US, Africa, Europe, Indian Subcontinent, and South-East Asia. APSEZ’s integrated verticals help reduce time to market and allow the company to operate at optimum cost.
-
Logistics
Adani Logistics Limited (ALL) is a wholly-owned subsidiary of APSEZ. Investments in tightly integrated assets help the company reduce bottlenecks in the overall logistics value chain. The company has 5,00,000 TEU container capacity, a customer service center and Online cargo tracking facility. The facility is ISO 9001 certified and has a category 1 license for Indian Railways for transporting import and export cargo.
-
Services
Dry Bulk Cargo
Fertilizers
APSEZ ports have capabilities and infrastructure to handle fertilizes at Mundra, Tuna and Hazira. Various types and grades of fertilizers are handled at APSEZ ports including Granular Urea, Prilled Urea, DAP, DAP Lite, MOP Red, MOP White, NP and NPK. APSEZ has dedicated berths, dedicated fleets, equipment and storage facilities and adequate labor for handling fertilizers at the ports.
Agri Cargo
At APSEZ, agri-cargo is handled at Mundra, Tuna and Hazira ports. Agri-commodities include Yellow Peas, Chick Peas, Sugar, Wheat, de-oiled cakes, Barley, Sorghums, Maize and Rice. Agri-products are handled according to stringent handling standards. Dedicated berths, contamination-free storage facilities and railway connectivity ensure that agri-commodities are transported across the country safely and hygienically.
Minerals
Minerals including Bauxite, Bentonite, Cement, Clay, Industrial Salt, Iron Ore, Rock Phosphate and Gypsum are handled at Mundra, Tuna, Dahej, Hazira and Dhamra ports by APSEZ. Dedicated infrastructure with regards to equipment and storage, including concrete storage yards ensure zero ground loss.
Coal
APSEZ handles different types of coal cargo including steam coal, imported coking coal and thermal coal. The company has installed high speed ship unloaders and mobile harbor cranes for faster discharge of coal cargo and mechanized storage yards and integrated conveyor system to handle huge volumes of coal cargo. APSEZ ports equipped to handle coal cargo are at Mundra, Hazira, Tuna, Dahej, Murmugao, Vizag and Dhamra.
Break Bulk Cargo
Steel
APSEZ handles all types of steel cargo including Plates, Beams, Coils, Pipes, Slabs, Bars, Billets, and products requiring specialized operations including large dimension Steel Plates/Beams/Pipes. Mundra port has Goliath cranes with vacuum lifters for scratch-free handling of sensitive cargo and a steel yard spread over 1,50,000 sq meters which can handle up to 6 MMT of steel per year. Steel cargo is handled at Mundra and Hazira.
Timber
Adani’s Mundra port has a storage area capable of 350,000MT timber storage.
Project Cargo
The APSEZ ports at Mundra, Tuna, Dahej and Hazira are capable of handling loaded, heavy, oversized or discharged machinery and equipment like Boilers, Rail Wagons (of Delhi Metro), Heavy Transformers, Windmills and Heavy Machineries.
Liquid Cargo
Crude Oil
The crude oil from Mundra is transported t refineries across Northern India through a cross- country pipeline network. APSEZ’s Mundra port operates two Single Point Mooring (SPM) facilities to evacuate imported crude oil. The SPMs can handle Very Large Crude Containers (VLCC) and Ultra Large Crude Containers (ULCC) which can carry up to 360,000 tons of dead weight.
Liquids
APSEZ has liquid cargo port capabilities at Mundra and Hazira. The berths are equipped with tank farms to ensure safe and efficient handling of liquid products in big parcels. The cargo handled includes vegetable oil, chemicals and petroleum, oil and lubricants.
Container Cargo
APSEZ container services include transportation of automobiles which was established in 2009. Mundra port serves at a gateway port for automobile companies situated in Delhi, NCR, Rajasthan and Gujarat region. Mundra port handles import and export of cars, buses and trucks.
Dredging and Marine Services
APSEZ provides dredging and reclamation solutions for port and harbor construction services. APSEZ has a fleet of 19 dredgers with the largest dredging capacity in India. APSEZ also has a fleet of support vessels and equipment such as Multi Utility Crafts, Survey Vessels, Floating Cranes and Jack-up Barges. The marine services include bunker, fresh water, ship stores, waste disposal and repair facilities at Mundra, Tuna, Dahej, Hazira and Dhamra.
Key Ratios
|
Key Ratios |
FY13 |
FY14 |
FY15 |
FY16 |
FY17 |
|
Debt-Equity Ratio |
1.67 |
1.33 |
1.41 |
1.47 |
1.17 |
|
Current Ratio |
1.69 |
2.20 |
1.25 |
0.84 |
1.82 |
|
Inventory Turnover Ratio (x) |
36.51 |
28.47 |
23.74 |
33.95 |
12.84 |
|
Total Asset Turnover Ratio (%) |
16.98 |
19.54 |
19.17 |
18.43 |
19.36 |
|
EBITDM (%) |
73.82 |
74.70 |
74.57 |
73.53 |
76.48 |
|
EBITM (%) |
62.02 |
61.24 |
59.75 |
58.65 |
62.73 |
|
ROCE (%) |
8.99 |
7.91 |
8.68 |
9.12 |
10.56 |
|
RONW (%) |
25.38 |
19.84 |
21.49 |
21.68 |
22.31 |
|
Payout (%) |
12.34 |
12.28 |
9.83 |
7.94 |
0.00 |
|
Price/Book Value (x) |
4.35 |
4.43 |
5.92 |
3.91 |
4.02 |
|
EV/EBITDA (x) |
14.31 |
13.91 |
17.10 |
13.12 |
13.80 |
|
Market Cap/Sales |
7.77 |
8.05 |
10.37 |
7.12 |
8.34 |
The company debt-equity ratio has reduced in FY17. The company has a healthy and stable current ratio which indicates that the company is well run. The company is able to meet its short term capital expenditures through operations. The company is highly diversified and operates in logistics and cargo handling services at various ports across the country, which generates the company short term cash to meet expenses and long term profits to enhance the company’s enterprise value. The return on capital employed has increased in the years FY16 and FY17. The company has also maintained stability with respect to the returns generated on capital employed.
Management Profile
|
Key Personnel |
Designation and Experience |
Auditors |
|
Gautam Adani |
Chairman and MD: Mr. Gautam Adani is the Chairman and founder of Adani Group. He has more than 33 years of business experience. Under his leadership, Adani Group has emerged as a global integrated infrastructure player with interest across resources, logistics and energy verticals |
SRBC and Co LLP |
|
Karan Adani |
CEO: Mr. Karan Adani holds a degree in economics from Purdue University, USA. He started his career at port operations at Mundra. Having accumulated experience throughout all levels of operations since 2009, he is responsible for the strategic development of the Adani group and oversees its day-to-day operations. |
|
Major Adani Ports in India
-
Mundra Port: Mundra Port is an all-weather, deep draft port with a high degree of mechanization. It is the largest commercial port in India. It has handling and storage facilities for crude oil, containers, dry bulk, break bulk, automobiles and liquid cargo.
-
Tuna Terminal: Tuna terminal handles all types of dry bulk cargo including fertilizers, coal, minerals, industrial salt and agricultural products. Tuna terminal has a fully mechanizedwarehouse to handle agro and fertilizer import and a highly automated dry bulk cargo handling facility. The terminal has an all-weather berthing facility with a deep draft of 16.2 meters.
-
Dahej Port: Dahej port is strategically located in the Gulf of Khambhat, with a capacity to handle 20 MMT of cargo per annum. It is a deep water, multi-cargo port with solid cargo handling capacity. It has two dedicated dry and break bulk berths with a capacity to handle project cargo. Dahej has a high-speed conveyor system for coal transportation and fully mechanized cargo loading and wagon loading systems.
-
Hazira Port: handles all types of cargo including bulk, break bulk, bulk liquid chemicals, petroleum products and edible oil, containers and automobiles. It is a convenient gateway for international locations like Europe, Africa, America and Middle-East.
-
Murmugao Terminal: is located in the south-west coast of India in the state of Goa. Adani Mormugao Port Terminal Pvt. Ltd (AMPTPL) has signed an agreement with Mormugao Port Trust for 30 years to design, build, operate, finance and transfer he port operations. The Murmugao terminal has a coal handling facility capable of handling large deep water vessels.
-
Vizhinjam Port: is a Greenfield project which is being developed through a 40-year agreement between Adani Vizinjam Port Private Limited and the Government of Kerala. It is expected to be India’s first Mega Transhipment Container Terminal. Vizhinjam is located close to major international shipping routes like Persian Gulf-Malacca shipping lane which accounts for almost one-third of world’s shipping traffic. It is also located central to eastern and western shipping lines of India.
-
Dhamra Port: is located in the east coast of India in the state of Odisha. It is one of India’s deep draft ports with a draft of 18 meters. It can handle vessels of up to 180,000 dead weight capacity. It is an all-weather, multi-user, multi-cargo port with a potential to handle more than 100 MMT of dry-bulk, break-bulk, liquid-bulk, containerized and general cargo. Dhamra Port Company Limited (DPCL) is a 100% subsidiary of APSEZ with a 34-year period concession from Government of Odisha to build, own, operate and transfer the port operations.
-
Vizag Terminal: is located in the east coast of India. The terminal is fully mechanized for handling coal with a storage yard space of 25 acres. Adani Vizag Port Terminal is located in the inner harbor of Vishakapatnam Port. The Adani Vizag Port terminal has a concession of 30 years.
-
Kattupalli Port: is located on the Coromandel Coast about 24 km north of Chennai Port in the state of Tamil Nadu. It has the highest container and port traffic.
-
Ennore Terminal: is designed to be Asia’s energy port. Adani ports have a concession with Kamarajar port limited to build a container terminal at Ennore near Chennai.
Industry Overview
Ports Sector
Maritime transport in India accounts for 95% of trading by volume and 70% trading by value. The country has 12 major ports and 200 minor and intermediate ports. The cargo traffic was 1,750 million metric tons (MMT) in FY17. The ports and shipping industry plays an important role in the country’s trade and commerce. India has a coastline of approximately 7,517 km. The Government of India has played an important role in promoting the ports sector by allowing 100% FDI under automatic route for port and harbor construction and maintenance. The government has also given a 10-year tax holiday to enterprises that develop, maintain and operate ports, inland waterways and inland ports.
The capacity addition at ports is expected to grow at a rate of 6% per annum till 2022. Indian ports are expected to add 275-325 MT of capacity each year. Under the Sagarmala programme, the government has taken up modernization of 189 ports, which involves an investment of $22 billion. This project is expected to be completed by 2035. The ministry of shipping has set a target of 3,130 MMT capacity by the year 2020. 50% of this capacity would come from non-major ports and participation of private sector.
Major ports in India:
|
Port |
Location |
|
Kandla Port |
Kutch, Gujarat |
|
Paradip Port |
Jagatsinghpur, Odisha |
|
Jawarharlal Nehru Port |
Mumbai, Maharashtra |
|
Viskhapatnam Port |
Visakhapatnam, Andhra Pradesh |
|
Chennai Port |
Chennai, Tamil Nadu |
|
Port of Kolkata |
Kolkata, West Bengal |
|
New Mangalore Port |
Panambur, Karnataka |
|
Tuticorin Port Trust |
Tuticorin, Tamil Nadu |
|
Kamarajar Port Limited |
Ennore, Tamil Nadu |
|
Krishnapatnam Port |
Nellore, Andhra Pradesh |
|
Cochin Port |
Kochi, Kerala |
|
Mormugao Port |
South Goa, Goa |
|
Mumbai Port Trust |
Mumbai, Maharashtra |
Kandla Port Trust: is a seaport in Kutch district in Gujarat state. It was constructed in 1950 as a chief seaport serving western India. It is India’s largest port by the volume of cargo handled. It is also one of the busiest ports in India due to private sector participation. It is well known for handling crude-oil cargo, mainly for Essar Oil’s Vadinar refinery in Gujarat. The port has 4 berths of clean cargo capacity and has a depth of 14 m, capable of handling 75,000 dead weight ton vessels.
Paradip Port Trust: Paradip Port has 20 berths with a minimum draft of 13m and can accommodate vessels upto 90,000 DWT. A fully automated coal handling plant can handle upto 20 million tonnes of coal imports per year. A single point mooring system handles Very Large Crude Carriers for Indian Oil. In 2015, the entry to the port was dredged to 18.7m to handle Capesize Vessels
Mumbai Port Trust: Mumbai port is a natural deep water port. It is an autonomous corporation wholly owned by Government of India. Mumbai port has three enclosed wet docks with 8 berths of 6.4m depth, 14 berths of 6.7m depth and 21 berths of 21m depth. The port has four jetties for handling Crude and other Petroleum products, which have a draft of 12.2m.
Chennai Port: is the second largest container port in India. It is the third oldest port among 13 major ports in India. The port is a major hub for containers, automobiles and project cargo in India. It contributes mainly to imports of Oil and Automobiles and exports of groundnuts, granite and ores.
Vishakapatnam Port: is India’s second largest port by the volume of cargo handled. It is located in the east coast of India. The port has three harbors – outer harbor, inner harbor and fishing harbor. The outer harbor has 6 berths with a depth of 17 m, and the inner harbor has 18 berths with 12.5m depth.
Port of Kolkata: is the oldest operating port in India and was constructed by the British East India Company. The port has two distinct dock systems – Kolkata docks at Kolkata and deep water dock at Haldia Dock Complex, Haldia.
Mangalore Port: The New Mangalore Port is located in Panambur, Karnataka and has the deepest inner harbor in the west coast. The port is operated by New Mangalore Port trust(NMPT). The chief exports from this port include iron ore-concentrates, pellets, fines; manganese, granite, coffee, cashew and containerized cargo. The main imports include Crude and petroleum products, LPG, wood pulp, timber logs, finished fertilizers, liquid ammonia, phosphoric acid, liquid chemicals and containerized cargo.
Cochin Port: is a major port in the Arabian sea and one of the largest ports in India. The International Container Transhipment Terminal (ICTT) is a part of the Cochin port and is the largest container transshipment facility in India. The port is governed by Government of India through Cochin Port Trust (CPT).
APSEZ - Logistics Sector
The logistics sector is important for economic growth as it involves management of flow of goods meant for consumption by other industries. This sector comprises of shipping, port-services, warehousing, rail, road, air-freight, express cargo and other value added services. The logistics market in India is expected to reach $307 billion by 2020. The global logistics sector generates over $8 trillion annually and represents around 11% of global GDP.
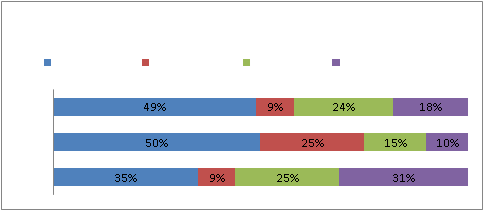
India spends 14.4% of GDP on logistics against a global average of 8%. Logistics in India is inefficient due to lagging infrastructure, lower average trucking speeds, congestion on roads and in ports etc. Excessive taxes and toll expenditures also add to the expense. As shown by the graph below, transportation costs in India are much below US and China due to lesser distances. However, other costs (taxes, losses etc) are much higher in India.
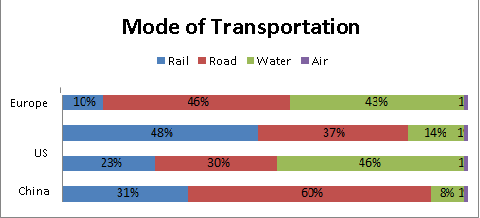
Some of the issues and challenges faced by the logistics sector in India are explained below. Indian has a slower transit time for movement of cargo through road and shipping networks. In terms of transportation through shipping channels, transit time is affected due to lengthy custom clearance processes and a number of intermediaries required for bringing products in and out of the country. The road logistics network is affected due to poor infrastructure as national highways constitute only 2% of the overall road network. In addition, toll collection, inter-state checkpoints and other stoppages lead to higher transit times. The logistics are also affected due to lower standardization of container cargos. Movement of cargo within the country is affected by inefficient use of rail and inland water networks, thus leading to inadequate transit gateways which hamper efficient movement of goods. Air transport is the fastest but constitutes a miniscule 1% of total cargo due to higher costs.
As seen by the graph below, 60% of the goods are moved by road as compared to just 37% in US, and just 8% of the goods are moved by water as compared to 46% in China.
APSEZ - Investment Rationale
-
Market leader in ports and shipping business with ambitious expansion plans.
The company has stake in 10 of India’s major ports. In ports like Vizag, Vizhinjam, Ennore and Mundra, APSEZ has concessions from the respective state governments to own, build, operate and transfer port operations for a span of 30-40 years. APSEZ has an ambitious plan to develop India’s first mega transshipment container port in Vizhinjam, Kerala through its Greenfield initiatives. The port is located strategically between east and west coast of India and close to international transshipment route of Malacca Straits. This route accounts for one-third of global shipping traffic. Vizhinjam has a natural depth of 20 m and therefore needs limited dredging maintenance. APSEZ has won concessions from Kamarajar Port Limited to develop Ennore terminal and first phase of the was commissioned this year. This port has a capacity of 1.4 million TEUs. APSEZ will begin a feasibility study on building a Greenfield container port in Carey Island, Malaysia. The port will be located 50 kms southwest of capital Kuala Lumpur and would be an extension of existing port Klang. The port is located close to global routes of Malacca Straits and will help drive APSEZ’s global transshipment strategy
-
Sound business with robust growth in revenue and profits over last 5 years
The company has grown at an average compounded rate of 25% per year over the last 5 years. The company’s net sales have grown from Rs.3,483.42 crores in FY13 to Rs.8,427.35 crores in FY17 at an average rate of 24.81%. The company’s net profits (PAT) have grown from Rs.1,638.83 crores in FY13 to Rs.3,892.24 crores in FY17 at an average rate of 24.76%. The company’s costs of sales have grown proportionally at an average of 28.21% over the last 5 years.
-
Penetration into complete value chain in port and shipping business and successful foray into ancillary businesses
APSEZ has a fully integrated vertical supply chain in import-export logistics in India transport and shipping of coal, port handling and infrastructure services. Since the company is involved in all verticals of logistics, it results in large cost savings to the company, leading to higher profits.
-
Growing importance of India in global trade presents opportunity for market leaders like APSEZ
India is strategically located between Europe and South-East Asia and is located near one of the world’s busiest shipping lanes-Malacca Straits. The country and hence APSEZ can capitalize on this strategic position as a trading hub between Europe and Middle-East in the west and large trading countries like Japan, Australia, Singapore and China in the east.
Consolidated Balance Sheet
|
FY13 |
FY14 |
FY15 |
FY16 |
FY17 |
|
|
EQUITIES AND LIABILITIES |
|||||
|
SHAREHOLDER'S FUNDS |
|||||
|
Equity Share Capital |
400.68 |
414.01 |
414.01 |
417 |
414.19 |
|
Preference Share Capital |
2.81 |
2.81 |
2.81 |
0 |
0 |
|
Total Share Capital |
403.49 |
416.82 |
416.82 |
417 |
414.19 |
|
Reserves and Surplus |
5,992.78 |
8,351.28 |
10,351.05 |
12,806.63 |
17,111.79 |
|
Total Reserves and Surplus |
5,992.78 |
8,351.28 |
10,351.05 |
12,806.63 |
17,111.79 |
|
Total Shareholders’ Funds |
6,396.27 |
8,768.10 |
10,767.87 |
13,223.63 |
17,525.98 |
|
Minority Interest |
142.31 |
143.67 |
158.98 |
142.88 |
139.24 |
|
NON-CURRENT LIABILITIES |
|||||
|
Long Term Borrowings |
10,257.50 |
11,288.41 |
13,849.78 |
16,305.56 |
17,993.24 |
|
Deferred Tax Liabilities [Net] |
552.97 |
674.47 |
859.02 |
1,066.53 |
215.71 |
|
Other Long Term Liabilities |
586.99 |
733.59 |
718.8 |
606.35 |
1,143.99 |
|
Long Term Provisions |
104.25 |
369.02 |
292.78 |
73.07 |
11.01 |
|
Total Non-Current Liabilities |
11,501.71 |
13,065.49 |
15,720.38 |
18,051.51 |
19,363.95 |
|
CURRENT LIABILITIES |
|||||
|
Short Term Borrowings |
404.7 |
405.55 |
1,305.55 |
3,194.16 |
2,533.89 |
|
Trade Payables |
174.22 |
264.8 |
328.1 |
404.84 |
1,221.95 |
|
Other Current Liabilities |
2,140.34 |
1,704.24 |
3,321.37 |
4,247.52 |
2,712.85 |
|
Short Term Provisions |
300.05 |
325.31 |
479.94 |
99.93 |
87.22 |
|
Total Current Liabilities |
3,019.31 |
2,699.90 |
5,434.96 |
7,946.45 |
6,555.91 |
|
Total Capital And Liabilities |
21,059.60 |
24,677.16 |
32,082.19 |
39,364.47 |
43,585.08 |
|
ASSETS |
|||||
|
NON-CURRENT ASSETS |
|||||
|
Tangible Assets |
11,217.93 |
13,003.54 |
17,807.66 |
18,339.24 |
16,569.26 |
|
Intangible Assets |
124.18 |
119.09 |
119.51 |
112.57 |
1,813.85 |
|
Capital Work-In-Progress |
2,951.22 |
2,024.83 |
1,275.55 |
2,386.63 |
4,513.97 |
|
Fixed Assets |
14,293.33 |
15,147.46 |
19,202.72 |
20,838.44 |
22,897.08 |
|
Non-Current Investments |
77.08 |
57.48 |
57.35 |
207.89 |
252.33 |
|
Deferred Tax Assets [Net] |
24.39 |
0.1 |
0 |
0.07 |
1,991.56 |
|
Long Term Loans And Advances |
1,225.04 |
3,092.80 |
2,928.99 |
7,696.77 |
759.32 |
|
Other Non-Current Assets |
299.91 |
390.66 |
502.55 |
1,360.06 |
3,106.98 |
|
Total Non-Current Assets |
15,960.10 |
18,728.85 |
25,291.33 |
32,702.95 |
31,677.66 |
|
CURRENT ASSETS |
|||||
|
Current Investments |
144.51 |
5.94 |
202.87 |
136.57 |
909.03 |
|
Inventories |
97.95 |
169.44 |
259.19 |
213.74 |
657.09 |
|
Trade Receivables |
728.28 |
1,427.56 |
1,287.77 |
1,943.69 |
2,692.99 |
|
Cash And Cash Equivalents |
830.55 |
513.92 |
633.78 |
1,290.95 |
1,976.80 |
|
Short Term Loans AndAdvances |
1,747.15 |
3,239.90 |
3,743.80 |
2,335.97 |
1,782.62 |
|
Other Current Assets |
1,551.06 |
591.55 |
663.45 |
740.6 |
3,888.89 |
|
Total Current Assets |
5,099.50 |
5,948.31 |
6,790.86 |
6,661.52 |
11,907.42 |
|
Total Assets |
21,059.60 |
24,677.16 |
32,082.19 |
39,364.47 |
43,585.08 |
Consolidated Income Statement
|
FY13 |
FY14 |
FY15 |
FY16 |
FY17 |
|
|
INCOME |
|||||
|
Revenue From Operations [Gross] |
3,486.42 |
4,580.89 |
5,893.78 |
6,968.76 |
8,427.35 |
|
Revenue From Operations [Net] |
3,486.42 |
4,580.89 |
5,893.78 |
6,968.76 |
8,427.35 |
|
Other Operating Revenues |
90.21 |
243.1 |
258.2 |
286.97 |
12 |
|
Total Operating Revenues |
3,576.63 |
4,823.99 |
6,151.98 |
7,255.73 |
8,439.35 |
|
Other Income |
264.44 |
683.63 |
685.64 |
684.82 |
1,040.11 |
|
Total Revenue |
3,841.07 |
5,507.62 |
6,837.62 |
7,940.55 |
9,479.46 |
|
EXPENSES |
|||||
|
Operating And Direct Expenses |
912.86 |
1,479.84 |
1,656.21 |
1,791.81 |
2,167.89 |
|
Employee Benefit Expenses |
130.75 |
161.61 |
237.16 |
282.17 |
383.14 |
|
Finance Costs |
541.84 |
976.76 |
1,175.06 |
1,099.04 |
1,393.18 |
|
Depreciation And Amortization Expenses |
421.97 |
649.48 |
911.68 |
1,079.44 |
1,160.19 |
|
Other Expenses |
157.04 |
262.19 |
356.3 |
531.23 |
473.63 |
|
Total Expenses |
2,164.46 |
3,529.88 |
4,336.41 |
4,783.69 |
5,578.03 |
|
Profit/Loss Before Exceptional, Extraordinary Items and Tax |
1,676.61 |
1,977.74 |
2,501.21 |
3,156.86 |
3,901.43 |
|
Exceptional Items |
0 |
0 |
0 |
0 |
277.44 |
|
Profit/Loss Before Tax |
1,676.61 |
1,977.74 |
2,501.21 |
3,156.86 |
4,178.87 |
|
Tax Expenses-Continued Operations |
|||||
|
Current Tax |
387.42 |
478.32 |
539.2 |
733.36 |
881.59 |
|
Less: MAT Credit Entitlement |
365.58 |
387.37 |
526.73 |
613.6 |
770.42 |
|
Deferred Tax |
101.24 |
145.79 |
195.54 |
207.43 |
175.33 |
|
Tax For Earlier Years |
0 |
0 |
-31.29 |
-0.27 |
0.13 |
|
Total Tax Expenses |
123.08 |
236.74 |
176.72 |
326.92 |
286.63 |
|
Profit/Loss After Tax And Before Extraordinary Items |
1,553.53 |
1,741.00 |
2,324.49 |
2,829.94 |
3,892.24 |
|
Profit/Loss From Continuing Operations |
1,553.53 |
1,741.00 |
2,324.49 |
2,829.94 |
3,892.24 |
|
Profit Loss From Discontinuing Operations |
419.57 |
0 |
0 |
0 |
0 |
|
Total Tax Expenses Discontinuing Operations |
334.27 |
0 |
0 |
0 |
0 |
|
Net Profit Loss From Discontinuing Operations |
85.3 |
0 |
0 |
0 |
0 |
|
Profit/Loss For The Period |
1,638.83 |
1,741.00 |
2,324.49 |
2,829.94 |
3,892.24 |
|
Minority Interest |
-15.61 |
-1.36 |
-10.16 |
42.1 |
10.02 |
|
Share Of Profit/Loss Of Associates |
0 |
0 |
0 |
-4.68 |
9.26 |
|
Consolidated Profit/Loss After MI And Associates |
1,623.22 |
1,739.64 |
2,314.33 |
2,867.36 |
3,911.52 |
|
OTHER ADDITIONAL INFORMATION |
|||||
|
EARNINGS PER SHARE |
|||||
|
Basic EPS (Rs.) |
8 |
8 |
11 |
14 |
19 |
|
Diluted EPS (Rs.) |
8 |
8 |
11 |
14 |
19 |
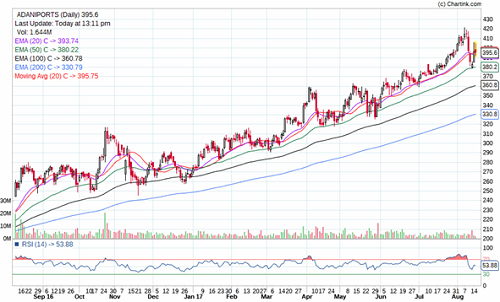
Stock Performance Chart
- Share :


Post a Comment
|
DISCLAIMER |
This report is only for the information of our customers. Recommendations, opinions, or suggestions are given with the understanding that readers acting on this information assume all risks involved. The information provided herein is not to be construed as an offer to buy or sell securities of any kind. ATS and/or its group companies do not as assume any responsibility or liability resulting from the use of such information.