GRP Limited Research Report
|
Industry |
Market Price |
Recommendation |
Target |
Time Horizon |
|
Auto Tyres and Rubber Products |
1405 |
BUY |
2,487 |
9 Months |
Q3 FY 2022 Review
GRP Limited reported net revenue of ₹9,341.96 lakhs for the quarter ended December 31, 2021, as compared to ₹9,005 lakhs for the quarter ended December 31, 2020. EBIT and Profit After Tax was ₹108.04 lakhs and ₹79 lakhs for the quarter ended, December 31, 2021, as compared to ₹ 2,331.91 lakhs and 164.17 lakhs during the corresponding quarter of the previous year.
Investment Summary
|
CMP (₹) |
1405 |
|
52 Week H/L |
1593/775 |
|
Market Cap (Lakhs) |
18733 |
|
Face Value (₹) |
10.00 |
|
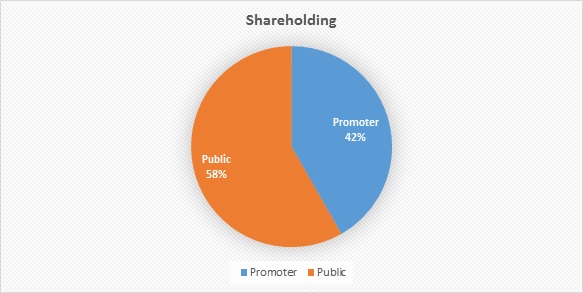
Promoter Holding (%) |
41.75 |
|
Non-Promoter Holding (%) |
58.25 |
|
Total (%) |
100.00 |
|
Book Value |
₹ 1,000 |
|
EPS TTM |
₹ 12.52 |
Overview
-
One of the top three manufacturers of reclaimed rubber globally and the largest in India.
-
7 manufacturing units with 76,100 tons/year capacity.
-
18% share in Indian Market & 50% India’s Export in reclaimed rubber.
-
GRP Limited supplies to 7 out of the top 10 global tyre companies.
-
Invested ₹15.25 Crore towards enhancing production capacity in the Engineering Plastic Division and Polymer Composite Division.
Quarterly Summary
|
Quarterly (₹ in Lakhs) |
Dec-21 |
Sep-21 |
Jun-21 |
Mar-21 |
Dec-20 |
|
Sales |
9,341.96 |
10,069.98 |
8,307.62 |
8,833.40 |
8,463.85 |
|
Other Income |
4.43 |
27.71 |
28.88 |
120.00 |
31.85 |
|
Total Revenue |
9,346.39 |
10,097.69 |
8,336.50 |
8,953.40 |
8,495.70 |
|
Total Expenditure |
9,099.94 |
9,827.72 |
8,185.77 |
8,393.62 |
8,123.89 |
|
EBIT |
246.45 |
269.97 |
150.73 |
559.78 |
371.81 |
|
Interest |
138.41 |
100.53 |
92.93 |
93.00 |
137.90 |
|
EBT |
108.04 |
169.44 |
57.80 |
466.78 |
233.91 |
|
Tax |
29.04 |
-167.33 |
129.47 |
-4.08 |
69.74 |
|
Net Profit |
79.00 |
336.77 |
-71.67 |
470.86 |
164.17 |
Business
-
GRP Limited, established by Mr. Rajendra V Gandhi in 1974, manufactures reclaimed rubber (recycled rubber) from end-of-life tyres and tubes. Having commenced operations as a tyre recycling company, GRP has transformed into sustainable materials company over the years. It also separates nylon tyres to produce raw material for sale to the engineering plastic components manufacturers in the automotive and electrical applications. The residue rubber from the above business is further used by other businesses with recycled plastic waste to produce composite material, which replaces wood and concrete.
-
The GRP Limitedcompany is a leader in the domestic tyre recycling industry, and amongst the top five manufacturers of the reclaimed rubber.
-
GRP has total installed capacity of 76,100 tons per year across all business segment.
-
GRP Limited operates in following segments:
-
Reclaim Rubber: This is the core business, as company procures tyres at its End-of-Life (EOL), to produce reclaimed rubber (a replacement to Natural & Synthetic Rubber), used predominantly by tyre manufacturers.
-
Engineered Plastics: Another business recovers Polymide waste from tyres and along with other forms of EOL waste to produce Engineering Plastic compounds for sale to the plastic manufacturers in the automotive and electrical applications.
-
Polymers Composites: The residue rubber from the above businesses is used by yet another business to blend with recycled plastic waste to produce composite material which replaces woods & concrete. The applications for these composite boards are mainly in the transportation industry and currently limited to North America only.
-
Tyre Retreading: A commercial Vehicle retreading business in Joint Venture with a global company, Maragoni SpA to help fleet owners’ life of their type by providing additional life.
-
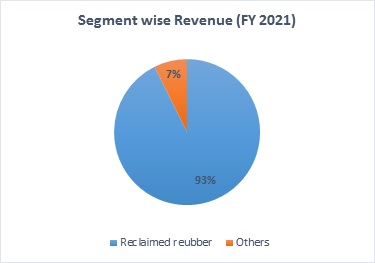
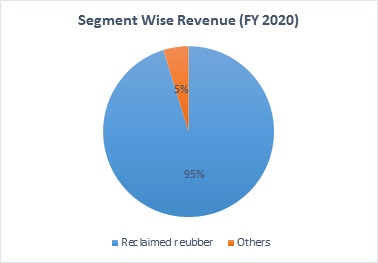
-
GRP Limited Revenue dropped by 20% in FY 2021, compared to previous year. Contribution of revenue in FY 2021 from reclaim rubber business was 93 % and from ‘Others’ was 7% as compared to 95% and 5% in previous year.
-
Due to Coivd-19 and increase in raw material prices, GRP Limited revenue and profit margin was impacted in FY 2021
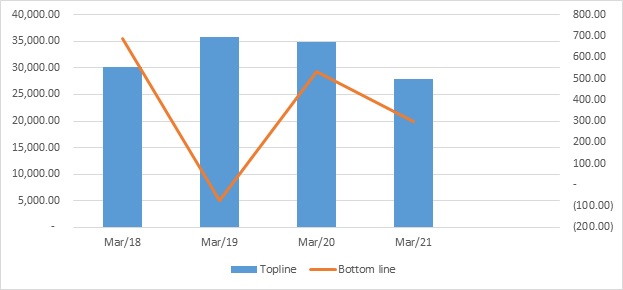
Revenue Trend
Topline and Bottomline trend (Lakhs)
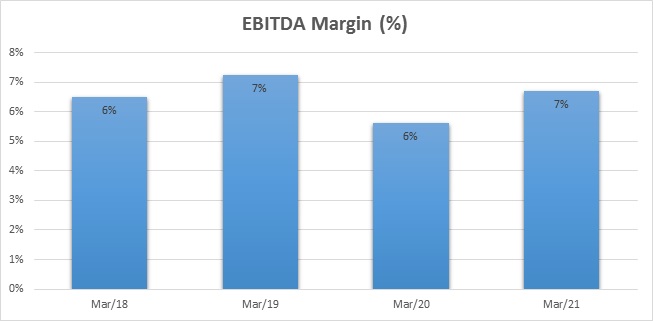
EBITDA Margin Trend (%)
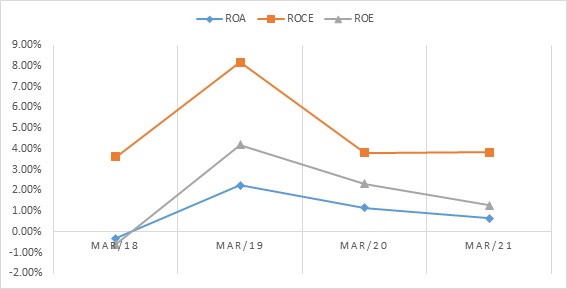
ROE, ROCE, and Asset Turnover trend (%)
Shareholding Pattern (%)
Top Shareholders
|
Rank |
Name |
Holdings % |
|
1 |
Individual/Hindu Undivided Family |
38.68 |
|
2 |
Meera Philip |
6.12 |
|
3 |
Koushik Shekhar |
3.83 |
|
4 |
Bodies Corporate |
4.58 |
|
5 |
Non-Resident Indian |
2.18 |
Ratio Analysis
|
YEAR END-MARCH |
Mar-18 |
Mar-19 |
Mar-20 |
Mar-21 |
|
Profitability Ratio |
|
|
|
|
|
Gross Margin |
55% |
52% |
51% |
52% |
|
EBITDA Margin/ Operating Profit Margin |
6% |
7% |
6% |
7% |
|
Pre-Tax Margin |
0% |
2% |
-1% |
0% |
|
EBIT Margin |
2% |
4% |
2% |
2% |
|
Net Profit Margin |
-0.25% |
1.49% |
0.85% |
0.60% |
|
|
|
|
|
|
|
Return On Investment |
|
|
|
|
|
Return On Asset – ROA |
-0.32% |
2.24% |
1.15% |
0.65% |
|
Return On Capital Employed – ROCE |
3.62% |
8.17% |
3.82% |
3.83% |
|
Return On Equity – ROE |
-0.60% |
4.20% |
2.31% |
1.29% |
|
|
|
|
|
|
|
Liquidity Ratio |
|
|
|
|
|
Current Ratio (X) |
0.80 |
0.78 |
0.80 |
0.63 |
|
Quick Ratio (X) |
0.81 |
0.90 |
0.83 |
1.07 |
|
|
|
|
|
|
|
Turnover Ratio |
|
|
|
|
|
Receivables Turnover |
6.05 |
6.10 |
5.33 |
4.33 |
|
Inventory Turnover |
2.75 |
2.91 |
2.60 |
2.10 |
|
Payables Turnover |
9.47 |
10.02 |
8.26 |
7.71 |
|
Asset Turnover |
1.28 |
1.50 |
1.35 |
1.08 |
|
|
|
|
|
|
|
Solvency Ratio |
|
|
|
|
|
Debt To Equity Ratio (X) |
0.60 |
0.65 |
0.77 |
0.64 |
Financial Overview
Profit and Loss Statement (₹ Lakhs)
|
YEAR END-MARCH |
Mar-18 |
Mar-19 |
Mar-20 |
Mar-21 |
|
Revenue |
30,240.54 |
35,736.85 |
34,869.80 |
27,977.32 |
|
Other Income |
70.51 |
48.79 |
63.65 |
187.32 |
|
Total Revenue |
30,311.05 |
35,785.64 |
34,933.45 |
28,164.64 |
|
|
|
|
|
|
|
Cost Of Goods Sold |
13,733.44 |
17,068.05 |
17,032.14 |
13,544.29 |
|
Gross Profit |
16,577.61 |
18,717.59 |
17,901.31 |
14,620.35 |
|
|
|
|
|
|
|
Excise Duty |
258.68 |
- |
- |
- |
|
Employee Benefits Expenses |
5,252.03 |
5,863.12 |
6,077.53 |
4,876.90 |
|
Others Expenses |
9,105.47 |
10,269.10 |
9,866.54 |
7,864.27 |
|
EBITDA |
1,961.43 |
2,585.37 |
1,957.24 |
1,879.18 |
|
|
|
|
|
|
|
Depreciation And Amortisation |
1,390.96 |
1,331.04 |
1,364.47 |
1,265.66 |
|
EBIT |
570.47 |
1,254.33 |
592.77 |
613.52 |
|
|
|
|
|
|
|
Finance Cost |
444.42 |
472.96 |
818.18 |
539.97 |
|
EBT Before Exceptional Items, Share of Net Profit/(Loss) Of Joint Venture, Exceptional Items |
126.05 |
781.37 |
-225.41 |
73.55 |
|
|
|
|
|
|
|
Joint Venture |
-49.10 |
-60.00 |
- |
- |
|
EBT Before Exceptional Items |
76.95 |
721.37 |
-225.41 |
73.55 |
|
|
|
|
|
|
|
Exceptional Items |
- |
- |
- |
- |
|
EBT |
76.95 |
721.37 |
-225.41 |
73.55 |
|
|
|
|
|
|
|
Tax Expenses |
152.17 |
188.69 |
-522.15 |
-93.36 |
|
PAT Before Non-Controlling Interest |
-75.22 |
532.68 |
296.74 |
166.91 |
|
|
|
|
|
|
|
Non-Controlling Interest |
-0.03 |
- |
- |
- |
|
PAT Attributable to Non-Controlling Interest |
-75.19 |
532.68 |
296.74 |
166.91 |
|
|
|
|
|
|
|
EPS |
|
|
|
|
|
Basic |
-5.64 |
39.95 |
22.26 |
12.52 |
|
Diluted |
-5.64 |
39.95 |
22.26 |
12.52 |
|
|
|
|
|
|
|
Number Of Shares |
|
|
|
|
|
Basic |
13.33 |
13.33 |
13.33 |
13.33 |
|
Diluted |
13.33 |
13.33 |
13.33 |
13.33 |
Cash Flow Statement (Lakhs)
|
Year End-March |
Mar-18 |
Mar-19 |
Mar-20 |
Mar-21 |
|
Net Profit Before Tax and Extra Ordinary Items |
76.95 |
721.37 |
-225.41 |
73.55 |
|
Net Cash from Operating Activities |
2,190.31 |
841.04 |
735.61 |
2,506.01 |
|
Net Cash Used for Investing Activities |
-659.38 |
-877.44 |
-1,117.63 |
86.34 |
|
Net Cash From (Used For) Financing Activities |
-1,477.48 |
383.14 |
766.38 |
-2,043.28 |
|
Net Increase in Cash and Cash Equivalents |
53.45 |
346.74 |
384.36 |
549.07 |
|
Cash And Cash Equivalents at The Beginning of The Year |
40.07 |
93.52 |
440.26 |
824.62 |
|
Cash And Cash Equivalents at The End of Year |
93.52 |
440.26 |
824.62 |
1,373.69 |
Balance Sheet (Lakhs)
|
YEAR END-MARCH |
Mar-18 |
Mar-19 |
Mar-20 |
Mar-21 |
|
ASSETS: |
|
|
|
|
|
Non-current assets: |
|
|
|
|
|
Property, Plant and Equipment |
12,457.71 |
12,073.70 |
11,074.67 |
9,943.90 |
|
Capital Work-In-Progress |
222.14 |
97.25 |
133.56 |
161.83 |
|
Right Of Use Assets |
- |
- |
1,042.70 |
972.06 |
|
Investment Property |
111.88 |
109.56 |
107.23 |
104.91 |
|
Goodwill |
- |
- |
- |
- |
|
Intangible Assets |
27.94 |
21.26 |
15.16 |
11.56 |
|
Intangible Assets Under Development |
14.10 |
11.79 |
31.49 |
31.49 |
|
Financial Assets: |
|
|
|
|
|
Investments |
82.94 |
61.15 |
65.77 |
17.18 |
|
Others |
0.30 |
0.33 |
0.34 |
0.35 |
|
Other Non-Current Assets |
393.79 |
515.08 |
324.45 |
286.85 |
|
Total Non-Current Assets |
13,310.80 |
12,890.12 |
12,795.37 |
11,530.13 |
|
|
|
|
|
|
|
Current Assets: |
|
|
|
|
|
Inventories |
3,409.84 |
3,481.39 |
4,676.83 |
4,335.75 |
|
Financial Assets: |
|
|
|
|
|
Investments |
- |
- |
- |
- |
|
Trade Receivables |
5,151.96 |
6,573.29 |
6,520.00 |
6,390.90 |
|
Cash And Cash Equivalents |
93.53 |
440.25 |
824.62 |
1,373.68 |
|
Other Bank Balances |
23.91 |
21.00 |
19.69 |
9.29 |
|
Other Financial Assets |
27.75 |
148.03 |
33.93 |
235.04 |
|
Current Tax Assets |
- |
- |
92.73 |
149.21 |
|
Other Current Assets |
942.31 |
1,123.90 |
1,920.69 |
748.94 |
|
Total Current Assets |
9,649.30 |
11,787.86 |
14,088.49 |
13,242.81 |
|
|
|
|
|
|
|
Total Assets |
22,960.10 |
24,677.98 |
26,883.86 |
24,772.94 |
|
|
|
|
|
|
|
Equity And Liabilities: |
|
|
|
|
|
Equity: |
|
|
|
|
|
Equity Share Capital |
133.33 |
133.33 |
133.33 |
133.33 |
|
Other Equity |
12,273.50 |
12,847.75 |
12,586.35 |
13,024.76 |
|
Total Equity Attributable to Owners |
12,406.83 |
12,981.08 |
12,719.68 |
13,158.09 |
|
|
|
|
|
|
|
Non-Controlling Interest |
0.04 |
0.04 |
0.04 |
0.04 |
|
Total Equity |
12,406.87 |
12,981.12 |
12,719.72 |
13,158.13 |
|
|
|
|
|
|
|
Liabilities: |
|
|
|
|
|
Non-Current Liabilities: |
|
|
|
|
|
Financial Liabilities |
|
|
|
|
|
Borrowings |
533.63 |
289.29 |
1,148.04 |
1,572.72 |
|
Others Financial Liabilities |
12.00 |
11.00 |
95.43 |
45.49 |
|
Provisions |
71.52 |
54.47 |
65.85 |
74.25 |
|
Deferred Tax Liabilities |
2,197.22 |
2,137.60 |
1,570.23 |
1,565.47 |
|
Total Non-Current Liabilities |
2,814.37 |
2,492.36 |
2,879.55 |
3,257.93 |
|
|
|
|
|
|
|
Current Liabilities: |
|
|
|
|
|
Financial Liabilities |
|
|
|
|
|
Borrowings |
4,575.90 |
5,929.78 |
6,951.83 |
5,163.36 |
|
Trade Payables: |
|
|
|
|
|
Total Outstanding Dues of Micro and Small Enterprise |
154.72 |
180.11 |
213.49 |
198.59 |
|
Other Creditors |
1,416.80 |
1,990.14 |
2,131.50 |
1,379.74 |
|
Other Financial Liabilities |
773.36 |
382.19 |
934.40 |
531.22 |
|
Other Current Liabilities |
769.30 |
691.48 |
947.32 |
982.39 |
|
Provision |
11.37 |
3.48 |
106.05 |
101.58 |
|
Current Tax Liabilities |
37.41 |
27.32 |
- |
- |
|
Total Current Liabilities |
7,738.86 |
9,204.50 |
11,284.59 |
8,356.88 |
|
|
|
|
|
|
|
Total Equity and Liabilities |
22,960.10 |
24,677.98 |
26,883.86 |
24,772.94 |
Industry Overview
-
The global reclaimed rubber market size has been estimated at $ 2,931.5 million in 2021 and is projected to register a CAGR of 9.6%.
-
Reclaimed rubber products are in high demand in major end use industries, such as automotive, consumer goods, aerospace, footwear and others. Due to a shift in the trend towards eco-friendly and recyclable materials, the growth of these industries in emerging countries has provided a major stimulus to market growth in the Asia Pacific countries. In developed countries, the ban of landfills in the EU, as well as other favorable regulatory frameworks provided by government to encourage and support recycling has increased the product demand.
-
India is the world’s third largest producer and fourth largest consumer of natural rubber. Within the country, the automobile industry is the largest consumer; India produces 6.5 lakh tyres every day.
-
Of the 1.5 billion plus waste tyres that are generated every year worldwide, 6% are in India. In addition, India also imports around three lakh tons of tyres to recycle every year. They are subject to thermochemical treatments in high temperature to produce industrial oil and other derivatives.
-
The Union environment ministry’s new draft notification, published on December 31,2021, proposes to regulate the disposal of such waste tyres by enforcing the ‘Enhanced Producer Responsibility’(EPR). According to new draft notification, by 2024-25, all manufacturers and importers of new tyres will need to recycle all their products, starting with recycling 35%, and then 75% of their products for the first two years, and achieving 100% by 2024.
-
GRP Limited is one the top three manufacturers of reclaimed rubber globally and the largest in India. The company has built healthy relationships with both domestic and many international tyre manufacturers and distributors. Exports mainly to Europe, US, and Latin America, contributed to 66% of total revenue in FY 2021.
-
GRP is likely to benefit from the upcoming regulations that will include tyre manufactures in the ERP framework of the government, thereby easing availability of its reclaimed rubber, which will remain key monitorable.
Recommendation Rationale
-
GRP Limited revenue has grown by 45% to ₹27,719 lakhs in first nine months of FY 2022, compared to previous year, backed by recovery in demand and volumes in both domestic and export market.
-
Revenue is likely to reach pre-pandemic levels in FY 2022, with the steady recovery in reclaimed rubber segment along with rising demand for non-reclaimed products, especially engineering plastic.
-
Allied businesses such as Engineering Plastics (EC), Polymer Composites (PC) and Customer Dies Form (CDF), have contributed to 9.5% of total revenue in the first nine months of FY 2022. Ramp up in PC and EC capacity, on the back of healthy demand and the recent capital expenditure (capex) should support further diversification in the revenue profile.
-
Export presence in more than 60 countries across 300 plus customers.
-
Raw material cost accounts for half of the operating income. End-of-Life rubber tyre, the key raw material, is procured from an extensive chain of suppliers. Fluctuations in raw material prices could impact the operating margin, as witnessed in the past.
-
GRP is highly dependent on performance of the tyre industry, which contribute around 60% of its revenue. While company has diversified presence into multiple segments such as EP, PC and CDF, extent of revenue contribution from these segments remains a critical aspect.
Valuation
-
Out of the last 4 financial years, company had reported negative revenue growth rate in 3 financial year (FY 2018, 2020 and 2021).
-
EBITDA margin has been ranging between 6% to 7% over the last 4 years.
-
Revenue and net profit of FY 2022 was impacted due to Covid-19 lockdowns and low demand for the products.
-
Company earns around 90 % of its total revenue from reclaimed rubber segment.
-
Performance of reclaimed rubber segment is indirectly dependent on Automobile Sector.
-
In last financial year, performance of Automobile Sector was weak due the shortage of semiconductor. Thus, it impacted performance of the company.
-
Even in current financial year, due to shortage of semiconductor and rise in price of raw material, automobile sector is impacted. As things are getting normal, there could be improvement in performance of the sector from the next financial year.
-
Based on current performance of company in first nine months, we expect, company could post higher revenue for the current financial (2022), corresponding to previous year.
-
With the improvement in Performance of automobile sector, Expansion plan, Diversification in revenue profile, ERP policy by Government, Adoption of upgrade technology: All this could help company to grow and improve its financial performance.
-
We have taken data of last 5 years (2017-2021), forecasted revenue for FY 2022-2026. Revenue growth is assumed to be 10%.
Estimated Income Statement (₹ in Lakhs):
|
|
Mar-22 |
Mar-23 |
Mar-24 |
Mar-25 |
Mar-26 |
|
|
2022-E |
2023-E |
2024-E |
2025-E |
2026-E |
|
Revenue |
30,981.10 |
34,079.21 |
37,487.14 |
41,235.85 |
45,359.43 |
|
COGS |
14,965.39 |
16,425.26 |
18,087.95 |
19,885.66 |
21,880.32 |
|
Gross Profit |
16,015.71 |
17,653.95 |
19,399.18 |
21,350.19 |
23,479.11 |
|
Employee Expenses |
5,364.22 |
5,900.64 |
6,490.70 |
7,139.78 |
7,853.75 |
|
Other Expenses |
8,679.31 |
9,547.24 |
10,501.96 |
11,552.16 |
12,707.37 |
|
EBITDA |
1,972.19 |
2,206.08 |
2,406.52 |
2,658.26 |
2,917.99 |
|
Depreciation |
1,231.00 |
1,354.10 |
1,489.51 |
1,638.46 |
1,802.31 |
|
EBIT |
741.19 |
851.97 |
917.00 |
1,019.80 |
1,115.67 |
|
Financial Cost |
370.59 |
425.99 |
458.50 |
509.90 |
557.84 |
|
EBT |
370.59 |
425.99 |
458.50 |
509.90 |
557.84 |
|
Tax expenses |
66.71 |
76.68 |
82.53 |
91.78 |
100.41 |
|
PAT |
303.89 |
349.31 |
375.97 |
418.12 |
457.43 |
-
We initiate coverage on GRP limited with a “BUY” and a 9 months Target Price of ₹ 2487.
Disclaimer: This report is only for the information of our customer's Recommendations, opinions or suggestions are given with the understanding that readers acting on this information assume all risks involved. The information provided herein is not to be construed as an offer to buy or sell securities of any kind.
- Share :


Post a Comment
|
DISCLAIMER |
This report is only for the information of our customers. Recommendations, opinions, or suggestions are given with the understanding that readers acting on this information assume all risks involved. The information provided herein is not to be construed as an offer to buy or sell securities of any kind. ATS and/or its group companies do not as assume any responsibility or liability resulting from the use of such information.