HDFC Asset Management Company Limited Research Report
HDFC Asset Management Company Limited
|
Industry |
Market Price |
Recommendation |
Target |
Time Horizon |
|
Finance-Investment |
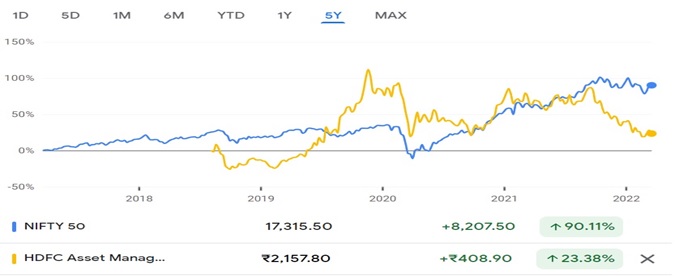
2,160.35 |
Buy |
2,926 |
1-Year |
Q3 FY 2022 Review
HDFC Asset Management Company (AMC) Limited reported net revenue of ₹549.67 crores for the quarter ended December 31, 2021, as compared to ₹481.86 crores for the quarter, ended December 31, 2020. EBIT and Profit After Tax were ₹487.30 crores and ₹359.75 crores for the quarter ended, December 31, 2021, as compared to ₹484.82 crores and ₹369.26 crores, during the corresponding quarter of the previous year.
HDFC Asset Management Company - Investment Summary
|
CMP (₹) |
2,160.35 |
|
52 Week H/L |
1,987/3,365 |
|
Market Cap (crores) |
46,071 |
|
Face Value (₹) |
5.00 |
|
Promoter Holding (%) |
68.84 |
|
Non-Promoter Holding (%) |
31.16 |
|
Total (%) |
100.00 |
|
Book Value |
₹224 |
|
EPS TTM |
₹62.11 |
Overview
-
HDFC AMC Limited is promoted by HDFC Limited and Standard Life, is one of the largest AMCs in India, with the Asset Under Management (AUM) of ₹4,36,700 crores as of December 2021.
-
HDFC AMC Limited got listed on NSE and BSE as of 06th August 2018.
-
The company also provides portfolio management & separately managed account services to HNIs, family offices, domestic corporates, trusts, provident funds, and global and domestic institutions.
-
The company has 227 branches and more than 70,000 empaneled distribution partners.
Beta 0.94 |
Alpha 4.91 |
Risk Reward Ratio: 1.67 |
Margin of Safety: 26% |
HDFC Asset Management Company - Quarterly Summary
|
Quarterly (INR in crore) |
Dec-21 |
Sep-21 |
Jun-21 |
Mar-21 |
Dec-20 |
|
Sales |
550 |
542 |
507 |
503 |
482 |
|
Other Income |
86.21 |
66.07 |
100.91 |
42.64 |
113.05 |
|
Total Revenue |
636 |
608 |
608 |
546 |
595 |
|
Total Expenditure |
149 |
145 |
140 |
120 |
110 |
|
EBIT |
487 |
464 |
468 |
425 |
485 |
|
Interest |
2.15 |
2.21 |
2.23 |
2.34 |
2.2 |
|
EBT |
485 |
461 |
466 |
423 |
483 |
|
Tax |
125.4 |
116.99 |
120.67 |
106.93 |
113.36 |
|
Net Profit |
360 |
344 |
345 |
316 |
369 |
Business
-
HDFC AMC Limited has been incorporated under the Companies Act, 1956 on December 10, 1999, and was approved to act, as the Asset Management Company for HDFC Mutual Fund by the Securities and Exchange Board of India (SEBI) vide its letter dated July 3rd, 2000.
-
The company is also registered under SEBI (Portfolio Managers) Regulations, 1993, and provides Portfolio Management Services.
-
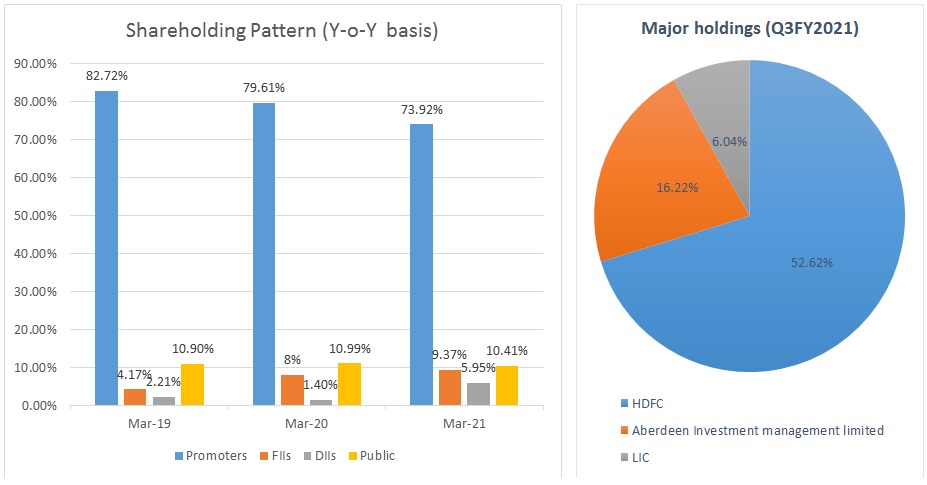
As of December 31st, 2021, HDFC Limited, the holding company owned 52.62% of the Company’s equity share capital.
-
The company launched two NFOs in Q3FY2022: Multicap fund (AUM of ₹4353 crores as on December 31, 2021) and Nifty Next 50 fund.
-
The company has got approval of nine ETF. Looking to launch debt and silver ETF. Further, it plans to launch sectoral, ETF, index and thematic funds in coming months. Have few funds in pipeline in thematic category.
-
HDFC AMC plans to enter alternative funds and will further launch category ii funds and filled permission with SEBI to launch 3 funds.
-
The company plans to launch a subsidiary to Gift City named HDFC AMC IFSC, which will act as investment manager to the schemes launched under Alternative Investments Funds.
-
Total Live Accounts were at 96 lakhs as on December 31, 2021. Unique customers as identified by PAN or PEKRN are now at 57 lakhs as on December 31, 2021 compared to 3.06 crores for the industry.
-
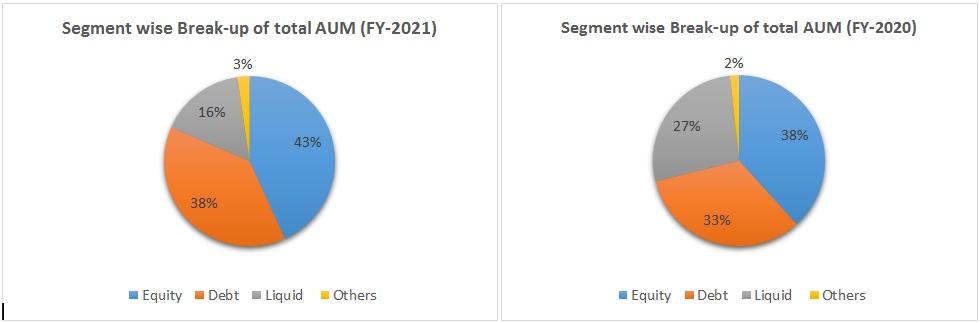
In FY 2021, Equity-oriented schemes constituted 43% of the total AUM, followed by Debt-oriented schemes 38.5%, Liquid Funds 16.1%, and Others 2.3%, compared to 38.3%, 32.8%, 27.2% and, 1.7 in FY 2020.
-
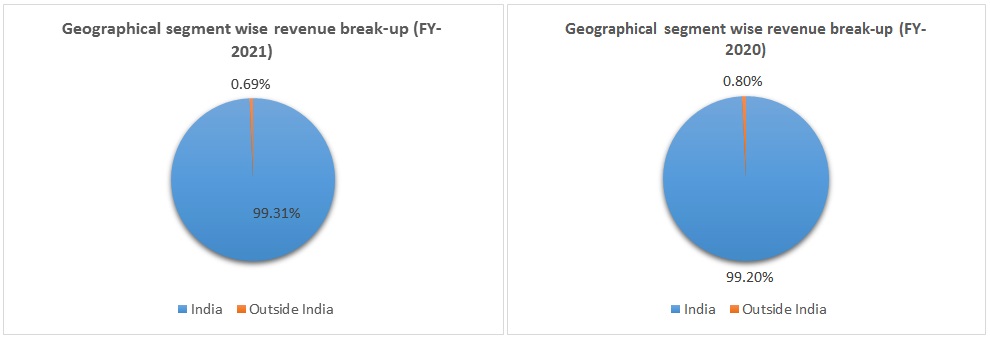
Out of the total revenue, 99% of revenue have generated from India and 0.69% from other countries in FY 2021, compared to 99% and 0.80% in FY 2020.
-
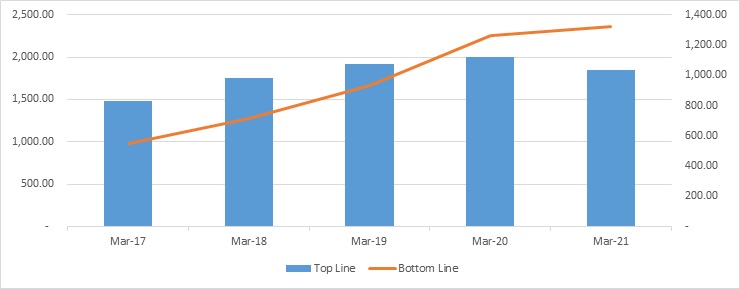
Total revenue (including other income) increased by 2.72 % to ₹2,201.74 crores in FY 2021, as compared to the previous year.
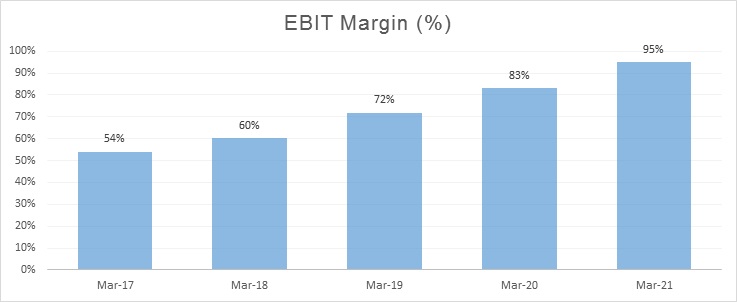
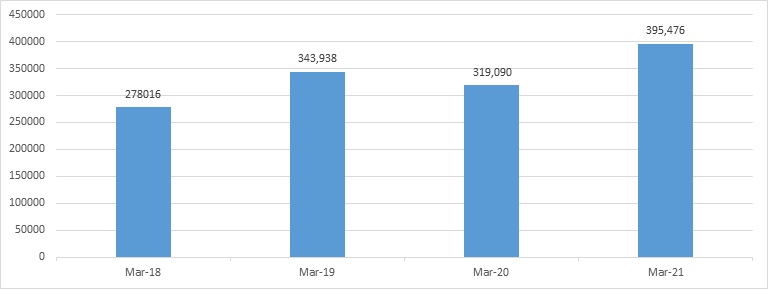
Revenue Trend
Topline and Bottomline trend (crores)
Asset Under Management (in crores)
Ratio Analysis
|
Mar-18 |
Mar-19 |
Mar-20 |
Mar-21 |
|
|
Profitability Ratio |
|
|
|
|
|
EBITDA Margin |
60.77% |
72.45% |
85.48% |
97.88% |
|
EBIT Margin |
60.24% |
71.78% |
82.97% |
94.89% |
|
Pre-Tax Margin |
60.24% |
71.78% |
82.52% |
94.41% |
|
Net Profit Margin |
40.49% |
48.59% |
63.02% |
71.52% |
|
|
|
|
|
|
|
Return on Investment |
|
|
|
|
|
Return on Asset – ROA |
84.33% |
67.25% |
53.19% |
39.40% |
|
Return on Capital Employed – ROCE |
55.35% |
50.87% |
46.20% |
39.28% |
|
Return on Equity – ROE |
37.72% |
34.95% |
35.56% |
30.09% |
HDFC Asset Management Company - Financial Overview
Profit and Loss Statement (₹ in Crores)
|
|
Mar-18 |
Mar-19 |
Mar-20 |
Mar-21 |
|
Revenue |
1,756.77 |
1,915.18 |
2,003.25 |
1,852.23 |
|
Other income |
113.00 |
181.60 |
140.18 |
349.21 |
|
Total Revenue |
1,869.77 |
2,096.78 |
2,143.43 |
2,201.44 |
|
|
|
|
|
|
|
Fees and Commission Expenses |
326.99 |
240.26 |
20.89 |
5.69 |
|
Impairment of Financial Instruments |
- |
40.00 |
- |
- |
|
Employees Benefits Expenses |
186.10 |
206.27 |
214.71 |
226.75 |
|
Other Expenses |
289.09 |
222.70 |
195.43 |
155.99 |
|
EBITDA |
1,067.59 |
1,387.55 |
1,712.40 |
1,813.01 |
|
|
|
|
|
|
|
Depreciation, Amortisation and Impairment |
9.36 |
12.85 |
50.37 |
55.41 |
|
EBIT |
1,058.23 |
1,374.70 |
1,662.03 |
1,757.60 |
|
|
|
|
|
|
|
Finance cost |
- |
- |
8.98 |
8.95 |
|
EBT |
1,058.23 |
1,374.70 |
1,653.05 |
1,748.65 |
|
|
|
|
|
|
|
tax expenses |
346.94 |
444.10 |
390.64 |
423.90 |
|
PAT |
711.29 |
930.60 |
1,262.41 |
1,324.75 |
|
|
|
|
|
|
|
EPS |
|
|
|
|
|
Basic |
34.52 |
43.87 |
59.37 |
62.23 |
|
Diluted |
34.47 |
43.78 |
59.23 |
62.11 |
|
|
|
|
|
|
|
Number of shares |
|
|
|
|
|
Basic |
20.60 |
21.21 |
21.26 |
21.29 |
|
Diluted |
20.64 |
21.26 |
21.31 |
21.33 |
Cash Flow Statement (₹ in crores)
|
|
Mar-18 |
Mar-19 |
Mar-20 |
Mar-21 |
|
Net Profit Before Tax and Extra Ordinary Items |
1,058.23 |
1,374.70 |
1,653.05 |
1,748.95 |
|
Net Cash from Operating Activities |
618.17 |
894.14 |
1,284.84 |
1,085.32 |
|
Net Cash Used for Investing Activities |
(632.79) |
(776.55) |
(927.54) |
(482.7) |
|
Net Cash From (Used For) Financing Activities |
15.41 |
(118.64) |
(331.5 |
(627.57) |
|
Net Increase in Cash and Cash Equivalents |
0.79 |
(1.05) |
25.74 |
(24.96) |
|
Cash And Cash Equivalents at The Beginning of The Year |
1.16 |
1.95 |
0.90 |
26.64 |
|
Cash And Cash Equivalents at The End of Year |
1.95 |
0.90 |
26.64 |
1.68 |
Balance Sheet (₹ in crores)
|
|
Mar-18 |
Mar-19 |
Mar-20 |
Mar-21 |
|
ASSETS: |
|
|
|
|
|
Financial Assets: |
|
|
|
|
|
Cash and Cash Equivalents |
1.95 |
0.90 |
26.64 |
1.68 |
|
Other Bank Balances |
0.11 |
31.09 |
0.46 |
0.67 |
|
Receivables: |
|
|
|
|
|
Trade Receivables |
90.27 |
82.66 |
60.59 |
79.91 |
|
Other Receivables |
12.71 |
20.20 |
3.99 |
3.85 |
|
Investments |
2,057.74 |
2,934.96 |
3,944.51 |
4,753.25 |
|
Other financial Assets |
22.37 |
27.98 |
29.95 |
32.35 |
|
Total Financial Assets |
2,185.15 |
3,097.79 |
4,066.14 |
4,871.71 |
|
|
|
|
|
|
|
Non-Financial Assets: |
|
|
|
|
|
Current Tax Assets (net) |
32.13 |
35.16 |
32.37 |
31.29 |
|
Deferred Tax Assets |
- |
- |
21.67 |
- |
|
Property, Plant and Equipment |
21.88 |
25.63 |
141.39 |
136.86 |
|
Intangible Assets Under Development |
5.96 |
3.17 |
4.60 |
1.18 |
|
Goodwill |
6.04 |
6.04 |
6.04 |
6.04 |
|
Other Intangible Assets |
3.01 |
8.03 |
9.28 |
10.32 |
|
Other Non-Financial Assets |
217.97 |
47.93 |
27.11 |
37.30 |
|
Total Non-Financial Assets |
286.99 |
125.96 |
242.46 |
222.99 |
|
|
|
|
|
|
|
Total Assets |
2,472.14 |
3,223.75 |
4,308.60 |
5,094.70 |
|
|
|
|
|
|
|
Liabilities and Equity: |
|
|
|
|
|
Liabilities: |
|
|
|
|
|
Payables: |
|
|
|
|
|
Total Outstanding Dues of Micro and Small Enterprises |
- |
- |
- |
- |
|
Other Creditors |
111.58 |
47.36 |
46.73 |
42.11 |
|
Other Financial Liabilities |
66.65 |
65.69 |
178.37 |
187.90 |
|
Total Financial Liabilities |
178.23 |
113.05 |
225.10 |
230.01 |
|
|
|
|
|
|
|
Non-Financial Liabilities: |
|
|
|
|
|
Current Tax Liabilities |
3.35 |
1.77 |
3.94 |
4.34 |
|
Provisions |
0.89 |
1.01 |
7.25 |
7.88 |
|
Deferred Tax Liabilities |
4.22 |
2.84 |
- |
32.13 |
|
Other Non-Financial Liabilities |
31.54 |
34.36 |
43.05 |
44.16 |
|
Total Non-Financial Liabilities |
40.00 |
39.98 |
54.24 |
88.51 |
|
|
|
|
|
|
|
Equity: |
|
|
|
|
|
Equity Share Capital |
105.28 |
106.29 |
106.40 |
106.48 |
|
Other Equity |
2,148.63 |
2,964.43 |
3,922.86 |
4,669.70 |
|
Total Equity |
2,253.91 |
3,070.72 |
4,029.26 |
4,776.18 |
|
|
|
|
|
|
|
Total Equity and liabilities |
2,472.14 |
3,223.75 |
4,308.60 |
5,094.70 |
Industry Overview
-
Mutual Fund Industry Recent Trends:
-
Assets Under Management (AUM) of the Indian Mutual Fund Industry for the month of February 2022 stood at ₹37,56,296 crore.
-
The total number of accounts (or folios as per mutual fund parlance) as of February 28, 2022, stood at 12.61 crores, while the number of folios under Equity, Hybrid, and Solution Oriented Schemes, wherein the maximum investment is from the retail segment stood at about 10.13 crore.
-
Individual investors held ₹21.02 lakh crore in mutual funds as of February 2022, an increase of 22.32% over February 2021.
-
The Mutual Fund industry has grown from ₹ 17.89 lakh crore as of February 28, 2017, to ₹37.56 lakh crore as of February, 28,2022, more than a 2-fold increase in a span of 5 years.
-
The Industry’s AUM had crossed the milestone of ₹10 Lakh Crore for the first time in May 2014 and in a short span of about three years, the AUM size had increased more than two folds and crossed ₹20 Lakh Crore for the first time in August 2017. The AUM size crossed ₹30 Lakh Crore for the first time in November 2020.
-
The AUM of the mutual fund industry has grown at a CAGR of 20.6% over the last five years, with the equity AUM growing at a CAGR of 25%.
-
Rising awareness about the benefits of investing in equity markets, the growing popularity of ways of investing, for example through SIP, are some of the factors contributing to the increased participation of domestic individual investors in the Indian mutual fund industry.
-
The Monthly Average Asset Under Management (MAAUM) of individual investors in the industry has received ₹17.3 lakh crores in March 2021 and has recorded a growth of 22.9% since March 2016.
-
The Asset Management industry has become a significant part of the financial services industry as well as the overall economy in India.
-
The industry has reached its current level after a lot of collective effort but given the low penetration of mutual funds in India, it still has a lot of headroom for growth.
-
|
Healthy growth of mutual fund AUM in India (₹ in lakh crores) |
|||||
|
5-Years CAGR: 20.6% |
|||||
|
|
2017 |
2018 |
2019 |
2020 |
2021 |
|
Equity AUM |
6.28 |
9.22 |
10.21 |
8.26 |
13 |
|
Debt AUM |
7.61 |
7.99 |
7.3 |
7.76 |
10.58 |
|
Liquid AUM |
3.14 |
3.36 |
4.36 |
4.15 |
4.08 |
|
Other AUM |
0.52 |
0.79 |
1.93 |
2.09 |
3.77 |
|
Total |
17.55 |
21.36 |
23.8 |
22.26 |
31.43 |
Peer Comparison
|
|
|
9 -Months FY-2022 |
Ratio- (FY-2021) |
||
|
|
Market Cap. (cr.) |
Revenue (cr.) |
PAT (cr.) |
ROCE |
ROE |
|
HDFC AMC Limited |
46,071 |
1,599.08 |
1,049.07 |
39% |
30% |
|
Nippon Life AMC Limited |
20,824 |
968.67 |
568.31 |
27.46% |
21.94% |
Technical Analysis
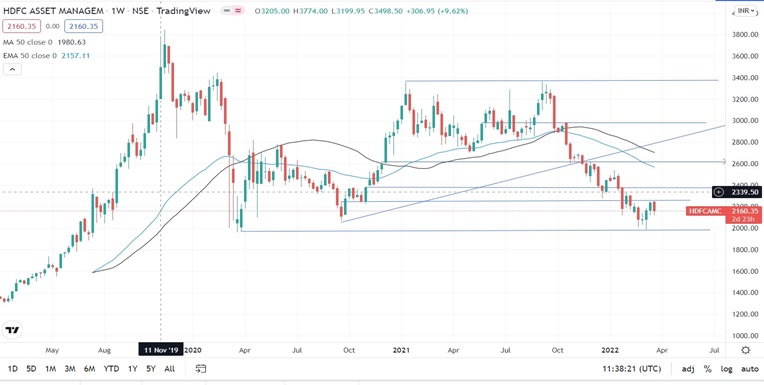
-
Stock is trading below EMA 50 and MA 50 indicator, with a strong support level ₹1,967 to ₹2,260 and a resistance level at ₹2,600.
-
Stock could consolidate at current levels.
Recommendation Rationale:
-
For the first nine months, HDFC AMC Limited revenue increased by 18% to ₹1599.08 crores, compared to the previous year at ₹1349.60 crores. Profit After Tax increased by 4% to ₹1,049.58 crores, compared to the previous year at ₹1,009.68 crores.
-
HDFC AMC Limited is one of the largest and most profitable mutual funds with an AUM of ₹ 4,37,000 lakh crores and with a market share of 11.6% as of December 2021.
-
The company has a strong distribution network with 227 branches and more than 70,000 empaneled distribution partners.
-
The is in a strong position in terms of branding and operational efficiency.
-
Life Insurance Corporation India has increased its stake from 5.15% to 6.05%.
-
FPI/FII has increased its stake from 8.95% to 10.54%.
-
The company’s Systematic Investment Plan (SIP) flows witnessed an increase from ₹1080 crore in Q2 FY2022 to ₹1190 crore in Q3FY2022.
-
With the increasing awareness of mutual funds, people have started switching from traditional investment products (Fixed deposits) towards mutual fund products for better returns.
Valuation
-
The company has grown at a 5.8% Compounded annual growth rate, from FY 2018 to FY 2021.
-
The company’s AUM decreased by 7% in FY 2020 compared to the previous year, due to the covid-19 pandemic. It rebounded with a growth of 24% in FY 2021.
-
Revenue decreased in FY 2021, due to a decrease in investment management fees by 6.40%.
-
Based on the current performance of the company in the first nine months, we expect, the company could post higher revenue for the current financial (2022), corresponding to the previous year.
-
We have taken data for the last 5 years (2017-2021), forecasted revenue for FY 2022-2026. Revenue growth is assumed to be 13%.
Estimated Income Statement (₹ in crores):
|
` |
Mar-22 |
Mar-23 |
Mar-24 |
Mar-25 |
Mar-26 |
|
|
2022-E |
2023-E |
2024-E |
2025-E |
2026-E |
|
Revenue |
2,455 |
2,741 |
3,066 |
3,435 |
3,852 |
|
Fees and Commission Expenses |
14 |
16 |
18 |
21 |
24 |
|
Employee Expenses |
241 |
274 |
311 |
353 |
400 |
|
Other Expenses |
191 |
217 |
246 |
279 |
317 |
|
EBITDA |
2,008 |
2,235 |
2,491 |
2,782 |
3,112 |
|
Depreciation |
57 |
54 |
54 |
56 |
60 |
|
EBIT |
1,951 |
2,181 |
2,437 |
2,726 |
3,051 |
|
Financial Cost |
9.79 |
11.11 |
12.60 |
14.30 |
16.23 |
|
EBT |
1,941 |
2,169 |
2,425 |
2,712 |
3,035 |
|
Tax expenses |
485 |
542 |
606 |
678 |
759 |
|
PAT |
1,456 |
1,627 |
1,818 |
2,034 |
2,276 |
-
We initiate coverage on HDFC Asset Management Company limited with a “BUY” and a 1-Year Target Price of ₹2,926.
Disclaimer: This report is only for the information of our customers Recommendations, opinions, or suggestions are given with the understanding that readers acting on this information assume all risks involved. The information provided herein is not to be construed as an offer to buy or sell securities of any kind.
- Share :


Post a Comment
|
DISCLAIMER |
This report is only for the information of our customers. Recommendations, opinions, or suggestions are given with the understanding that readers acting on this information assume all risks involved. The information provided herein is not to be construed as an offer to buy or sell securities of any kind. ATS and/or its group companies do not as assume any responsibility or liability resulting from the use of such information.