JK Paper
JK Paper
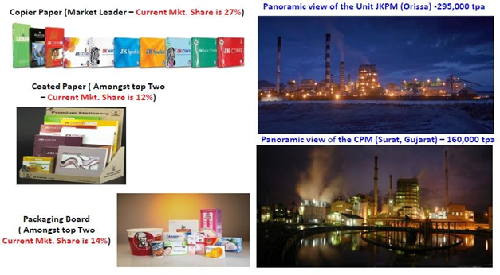
JK Paper (JKPL) is engaged in paper manufacturing business. Incorporated in 1960, the company is part of JK Organisation, which has business interests in automotive JK Tyres, JK Lakshmi Cement, v-belts, oil- seals, agri-seeds and pulp and paper. JK Paper Ltd is India’s largest producer of branded copier papers and leading player in the printing and writing segment. The company operates two manufacturing facilities located at Rayagada (Orissa) and Songadh (Gujarat).
JK Paper Limited manufactures and sells papers primarily in India. The company offers a range of office documentation papers, such as photocopy and multi-purpose papers for use in desktop, inkjet and laser printers, fax machines, photocopiers, and multi-functional devices; and premium watermarked and laid- marked business stationery papers for corporate customers and individuals under different brands. The company also exports its products to approximately 35 countries. 40% of paper produce by the company is sold under various brand names viz. JK Copier, JK Excel Bond, JK Bond, JK Savannah, JK Copier Plus and JK Easy Copier. The other major product is JK Maplitho, a superior uncoated writing and printing paper.It is the only company having a wide portfolio of branded products. JK Copier is the flagship brand of company which is largest selling copier brand in Sri Lanka. In the year 2005, the company established a 46,000 TPA coating plant to produce international quality coated art paper and boards. The company market's this product under the brand name JK Cote.
|
CMP (as on 20/01/2017) |
94.50 |
|
52 Week H/L |
101.80/40.30 |
|
Market Cap (Cr) |
1475.37 |
|
Equity Capital (Rs cr) |
148.53 |
|
Face Value (Rs) |
10 |
|
|
|
|
Promoters Holding |
54.99 |
|
Non promoters |
45.01 |
|
Grand Total |
100 |
JK Paper Limited - Investment Rationales:
-
Increased demand for packaging products
-
Export potential
-
Growth potential of coated paper
-
Brand visibility and strong franchises
-
Increased corporate activity and lifestyle changes
|
Particulars |
FY12 |
FY13 |
FY14 |
FY15 |
FY16 |
|
Revenue |
1558.9 |
1727.3 |
2042.03 |
2536.61 |
2920.91 |
|
EBITDA |
176.16 |
165.71 |
135.94 |
261.53 |
419.48 |
|
Net Profit |
48.07 |
38.15 |
-74.72 |
-18.42 |
72.92 |
|
EPS (Rs) |
3.24 |
2.57 |
-5.03 |
-1.24 |
4.91 |
|
PE ~(X) |
6.78 |
3.50 |
-6.61 |
4.32 |
5.70 |
Outlook
The company is one of the few players in the paper manufacturing industry with direct access to the entire value chain right from plantation, pulp, manufacturing and consuming markets. The company also has an established presence in all the three major growth segments viz., Copier, Coated and high end Packaging board. With the increase in demand of paper products combined with the increase in premium products on overall product mix we excepts the improvement in margins and outperform the industry in the medium and long term future.
JK Paper Limited - Company profile
JKPL is an integrated pulp and paper manufacturing company producing writing, printing paper and virgin packaging board with a total capacity of 4,55,000 tpa. JKPL is India’s one of the largest wood based paper manufacturer with two manufacturing facilities – JK Paper Mills (JKPM) located at Jaykaypur in Rayagada district of Orissa, Eastern India and Central Pulp Mills (CPM) located in Songadh in Gujarat, Western India. Both the units are fully integrated pulp and paper mills for their pulp and power. JKPL has added new plantation of 17,796 Ha in FY 16 (cumulatively till FY 16 over 1.44 Lac Ha). JKPL has captive pulping capacities of ~2.76 lakh ton and 85 MW of power generation for captive requirements. JKPL’s product portfolio includes value added products such as copier paper, coated paper and folding box board for high-end packaging purposes.
Brand profile
|
Office documentation |
Unocated paper & broard |
Coated paper & board |
Packaging board |
|
|
|||
|
|
|||
|
|
|||
JKPL runs in-house research programme, under which the company is conducting plantation on more than 45,000 hectares of land. The plantation with its superior quality plants provides high quality raw materials. The company is also implementing TPM (Total Productive Maintenance) with the help of Japan Institute of Plant Maintenance. The company exports its products to markets located at Sri Lanka, Bangladesh, Middle East, Africa, Australia, Singapore, Malaysia and many more. JK Paper Ltd is also engaged in outsourcing activity wherein it contracts the capacities of other mills in India and abroad to manufactures various grades of paper, maintaining the same quality and service assurance. Some of the paper grades outsourced include Chromo (one side coated), Maplitho (uncoated woodfree), CG (copier grade) and some varieties of coated paper (C2S) and packaging board to meet Indian market requirement.
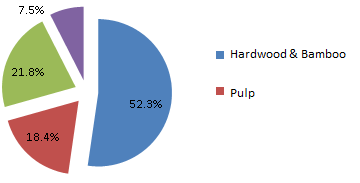
Raw materials cost breakup (FY16)
Product capacity(FY16)
|
Segment |
Capacity(mt) |
|
Uncoated paper |
292000 |
|
Coated paper |
54000 |
|
Packaging paer |
90000 |
|
Saleable pulp |
19000 |
|
Total |
455000 |
Key Ratios
|
|
FY12 |
FY13 |
FY14 |
FY15 |
FY16 |
|
|
|
|
|
|
|
|
Debt-Equity Ratio |
1.14 |
1.67 |
2.42 |
2.77 |
2.44 |
|
Current Ratio |
0.77 |
0.96 |
0.88 |
0.89 |
0.94 |
|
Fixed Assets |
1.03 |
1.11 |
0.86 |
0.81 |
0.93 |
|
Inventory |
10.69 |
9.09 |
8.03 |
7.61 |
8.19 |
|
Debtors |
12.37 |
13.11 |
14.07 |
16 |
20.38 |
|
Total Asset Turnover Ratio |
1 |
0.74 |
0.71 |
0.84 |
1.01 |
|
Interest Cover Ratio |
1.89 |
1.37 |
0.56 |
0.74 |
1.55 |
|
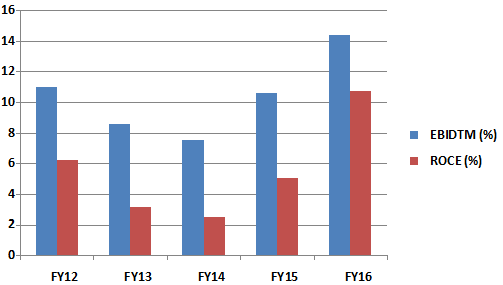
EBIDTM (%) |
10.96 |
8.53 |
7.53 |
10.55 |
14.36 |
|
CPM (%) |
7.54 |
5.46 |
5.58 |
4.08 |
6.26 |
|
ROCE (%) |
6.23 |
3.16 |
2.48 |
5.06 |
10.69 |
|
RONW (%) |
6.12 |
2.4 |
-1.51 |
-1.58 |
8.79 |
|
Payout (%) |
45.81 |
18.46 |
0 |
0 |
10.4 |
|
EBIT / Sales (X) |
0.07 |
0.04 |
0.01 |
0.06 |
0.11 |
|
Sales / Assets (X) |
0.96 |
0.71 |
0.67 |
0.8 |
0.96 |
|
Price Earning (P/E) |
10.79 |
10.39 |
NA |
NA |
8.81 |
|
Price to Book Value ( P/BV) |
0.58 |
0.44 |
0.51 |
0.56 |
0.71 |
|
Price/Cash EPS (P/CEPS) |
4.1 |
3.46 |
7.86 |
4.43 |
3.47 |
|
EV/EBIDTA |
8.14 |
12.88 |
19.44 |
9.63 |
6.09 |
|
Market Cap/Sales |
0.31 |
0.22 |
0.2 |
0.17 |
0.22 |
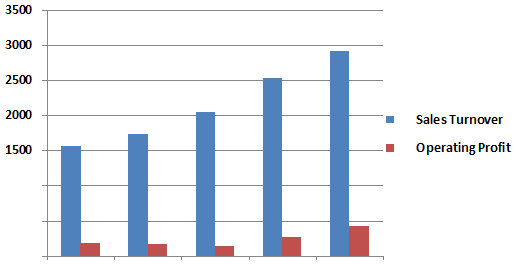
The revenue of JKPL is growing at a steady CAGR of 13.35% from Rs.1558.9 crore in FY12 to Rs.2920.91 crore in FY16. While the EBITDA is growing at CAGR of 18.95% mainly due to the increase in sales of high margin packaging and coated paper products. The debt portion of the balance was at Rs.538.35 crore in FY12 and it stood at Rs. 1941.3 crore in FY16, this substantial addition was mainly due to the capacity expansion of Rs.1700 crore started in FY13. And the higher debt has resulted the higher interest cost. The higher raw material prices have dragged the net profit of the company to negative territory in FY14 and FY16. With no capital expenditure planned in the coming future and the repayment of debt (approx Rs.300 crore each year till 2020) the debt burden of the company is expected to come down. The return ratios and the cash flow of the company are expected to improve in the coming quarters providing opportunity for JKPL to have better financials.
Revenue and operating profit performance
EBITDAM and ROCE performance
Industry Overview
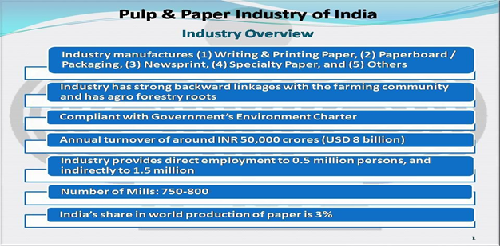
The Indian paper industry accounts for about 3% of the world’s production of paper. The estimated turnover of the industry is Rs.50,000 crore (USD 8 billion) approximately. The industry provides employment to more than 0.5 million people directly and 1.5 million people indirectly.
The operating capacity of the industry currently stands at around 12.7 million tonnes. During 2015-16, domestic production is estimated to be 12.2 million tonnes. As per industry guesstimates, over all paper consumption has now touched 13.9 million tonnes and per capita consumption is pegged at 13 kg. Demand of paper has been growing around 8% per annum for some time. So far, the growth in paper industry has mirrored the growth in GDP. According to IPMA India is the fastest growing market for paper globally and it presents an exciting scenario; paper consumption is poised for a big leap forward in sync with the economic growth. The futuristic view is that growth in paper consumption would be in multiples of GDP and hence an increase in consumption by one kg per capita would lead to an increase in demand of 1 million tonnes.
Most of the paper mills are in existence for a long time and hence present technologies fall in a wide spectrum ranging from oldest to the most modern. The mills use a variety of raw material viz. wood, bamboo, recycled fibre, bagasse, wheat straw, rice husk, etc. In terms of share in total production, approximately 24% are based on wood, 65% on recycled fibre and 11% on agro-residues. The geographical spread of the industry as well as market is mainly responsible for regional balance of production and consumption. The domestic paper consumption is about 13 million tonnes annually and there are indications that this number is likely to steadily go up over the next few years. The growth will particularly come from tissue and packaging industry, the latter driven by various segments, including e- commerce.
The Indian paper industry can be broadly classified into three segments:
-
Printing & writing (P&W):
Printing and writing segment caters to office stationary, textbooks, copier papers, notebooks etc. This segment forms ~31% of domestic paper industry. Governments thrust on education through steps like Right to Education, Sarva Shiksha Abhiyan, rise in service sector are key factors contributing to the growth of this segment.
-
Packaging & paper board:
Packaging paper & board segment caters to tertiary and flexible packaging purposes in industries such as FMCG, food, pharma, textiles etc. This segment forms ~47% of the domestic paper industry. This is currently fastest growing segment owing to factors such as rising urbanization, increasing penetration of organized retail, higher growth in FMCG, pharmaceutical.
-
Newsprint:
Newsprint serves the newspaper & magazines industry. This segment forms ~18% of Indian paper industry. This segment is under stress due to lower growth rates and import threat.
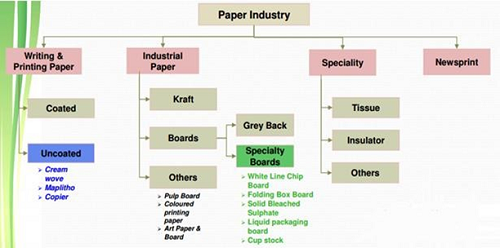
In terms of demand subset, Indian paper industry market (13.1 million tonne) consisting of printing & writing paper (4.8 million tonnes), news print (2.5 million tonne), industrial paper (5.1 million tonne) and specialty paper (0.6 million tonne). The packaging board market size is estimated at 2.4 million tonne, growing 11.6% (vs. 6% growth in printing & writing paper demand).
Paper and paper board can be manufactured by using different types of raw materials. Raw materials account for 45-50 per cent of the total cost of production and form an important segment of manufacturing paper and paper board. Of the total installed capacity, 43 per cent is dependent on forest based raw materials, 28 per cent on agro based raw materials and the remaining 29 per cent on other materials including waste paper.
Contrary to popular perception, paper is not a sunset industry, but a sunrise industry in India with a bright future. An investment of over Rs.25,000 crore in the last five years in capacity creation and technology upgrade has supported the drive to produce paper which matches world-class standards to meet the growing needs. While the paper industry has been witnessing declining demand in the developed markets in view of the increased use of information technology, India represents an island of growth for the industry. Expanding middle class, rise in disposable incomes and exposure to international trends is leading to lifestyle changes, which in turn are providing a fillip to consumption of paper in India.
The two sectors of the Indian Printing Industry which are projected to grow the most in India are Packaged Printing and Published Printing. Packaged printing will grow more rapidly at a rate of 7.8% in 2017. The market size of the packaged printing sector will increase from USD 10.2 billion in 2014 to USD 12.7 billion in 2017, and will comprise of 43% of the total print product sales in 2017. The growth of packaged printing will be driven by an increasing demand for non-commodity consumer goods in developed countries in the Asia-Pacific region that are slowly shifting from producer countries to consumer countries(especially China).
Published Printing’s market size will grow from USD 3.9 billion in 2014 to USD 4.5 billion in 2017. This growth is primarily due to increase in population, higher rate of literacy and a growing economy. Countries like UK, USA and Japan outsource printing jobs to India because of the low cost of labor, English language proficiency, design capabilities, talent pool, technology and communication costs. India’s geographical location adds to its advantage in order to do business with the east or the west.
Investment rationales
Increased demand for packaging products
The paper packaging products are an important part of the overall packaging industry in India. The growth in the India paper packaging industry has been largely impelled by the augmenting demand for better quality of paper packaging products and changing consumer preferences. Increasing demand for paper packaging products along with high urban population growth, rising disposable incomes and paper production in India are anticipated to further stimulate the country's overall paper packaging industry in the following years. A higher demand for paper packaging products, especially an increased trend in the usage of folding cartons, has been observed in India. The increase in the folding cartons has been observed on account of factors such as increasing FMCG and the food & beverage sector. The corrugated box market has been increasing mainly due to development of the country's logistics sector and escalating exports in the country. Additionally, the Indian FMCG sector is growing at a rapid rate due to strong demand from a large and growing middle class. As a result, the packaging industry, growing by more than 15 percent annually, will likely increase demand for corrugated boxes, leading to increased demand for kraft papers, and the key raw material.
The paper industry in India has become more promising as the domestic demand is on the rise, though despite being second most populated country in the world after China, India consumes less than 13 kilograms of paper as against global average of 58 kilogram, this means that there is huge potential of growth for the sector, which can be met through use of modern technologies. There are some concerns too, paper manufacturers are wary of rise in dumping from China and Indonesia after US imposed anti subsidy duty in June 2015 on import of paper from these countries, which can redirect the dumping to India, a growing market for them. Nevertheless, the considerable growth of e-commerce in the country has opened up a new horizon and could contribute significantly to the demand where paper is being extensively used for packaging. Increasing population and literacy rate, growth in GDP, improvement in manufacturing sector and lifestyle of individuals are expected to further provide support to the paper industry. This seems like it will continue for years to come. Indian e-commerce market is expected to grow to $228 billion by 2030 from current levels of $14-14.5 billion. The industry is entering new phase of growth and this will surely help JKPL in coming time.
Export potential
Exports of paper and paper products from India have not grown over the last three to four years in spite of steadily increasing domestic production. Exports of 48,553 mt in FY 16 compared to 12,900 mt in FY15Turning the page on India’s paper industry a new chapter in investment potential and growth is primarily due to increasing domestic demand and low quality of finished product, making the products unsuitable for export to the developed markets. Currently, exports form a very small proportion of paper production in India (2.1 percent) and are much lower than imports Major export destinations today are markets in the Middle East, Africa, and South Asia. The top three countries by value of exports are Nigeria, Sri Lanka, and the United Arab Emirates. These countries import paper, paperboard, and printed material. However, exports to developed markets in Europe and North America are restricted to books and printed material only. With further increase in production capacity in India, there is scope for increased exports to the traditional export markets. In addition, by improving quality through better machinery, processes, and raw materials, there is further scope for exports of high-value-added paper products to quality-sensitive markets in Europe and North America.
Growth potential of coated paper
The major driving factor for the global coated papers market share growth is the increasing demand of flexible packaging in the food and beverages industry. With growing awareness about the harms due to plastic packaging of food products, the trend is witnessing a shift towards the usage of bio-based and degradable packaging materials. Flexible packaging is also used for industrial goods, consumer products, medical products, and others. Food and beverage industry has more than 50% of the global share of flexible packaging and with growing trend towards consumption of packaged and easy-to-cook meals, this demand is expected to grow healthily. High demand for good quality print images will also influence the global coated paper market size. Printing, being the largest segment of coated paper market, is used heavily for magazines and advertisement purposes as inserts, brochures, pamphlets, cards, etc. Global media ad expenses crossed USD 600 billion in 2015 and are expected to increase rapidly with rising amount of commercialization in the market. The materials used for printing may be designed to have a glossy, matte, silk, satin or even dull finish depending on the aesthetic requirements. With increasing demand of flexible packaging owing to demand from food and beverages industry as well as e- commerce industry, global coated paper market size in packaging is expected to have a noteworthy growth in the forecast time span. With retail market growing rapidly with growing demand of the population, the packaging industry is anticipated to dominate throughout the forecast timeframe. Packaging applications are expected to rise by more than 4.5% CAGR from 2016 to 2024 leading to a coated paper market share of more than 50% by 2024.
Brand visibility and strong franchises
With 14 ware houses, 206 distributes and over 4000 dealers, JKPL is amongst the most well known brand in the paper industry. It is the third largest player in the paper industry with dominant market share in the areas in which it operates in. It has completed Rs.1 700-crore expansion project in Rayagada, Odisha, as it gears up to consolidate its specialty paper business. With no big further capex in the coming period of time the increase in revenue share from the specialty paper business in the overall revenue is expected to improve the product mix of premium products and it can help in improving the margins moving forward.
Increased corporate activity and lifestyle changes
India is the fastest growing paper market in the world, with annual growth of 7 to 8 per cent. Indian demographics, the focus on literacy and government spending on education are all fuelling this. While India remains a great market opportunity, it has also attracted competition from around the world. Especially from Asean, where the basic customs duty on paper is nil under the Indo-Asean Free Trade Agreement. Economic development and globalization have led to an increase in corporate activity and increased per-capita consumption of paper. At the same time, increased commercial activity has spurred demand for packaged goods. Lifestyle changes have also pushed up the demand for specialty paper, such as tissue papers. The GDP has grown at a rate of more than 8 percent in the last decade, increasing affluence. This has led to increased consumption growth in key urban towns and rural markets. The higher consumption per capita leads to a higher newspaper and Increase of per capita paper consumption by 1 kg will increase the demand by about 1.25 million tonnes per annum. The demand for uncoated Printing & Writing Paper is expected to grow at 6% per annum and high-end Packaging Board at 11.6% per annum. JKPL being a major player is expected to be a major beneficiary from the change in consumption pattern and life style changes.
|
Particulars |
2015 |
2018E |
|
Population |
1.26billion |
1.3billion |
|
GDP |
2.22trillion |
2.5trillion |
|
Per capita income |
$1,675 |
$2,100 |
|
Size of middle class(earns $10-100 daily) |
55 |
175 |
|
Urban population |
32% |
35% |
|
Per capita consumption |
11kg |
14kg |
|
Segment |
2013 consumption(mt) |
2013 Value (USD billion) |
2018 demand(mt) |
2018 Value ($ billion) |
CAGR(%) |
|
Paperboard |
5.9 |
4.17 |
8.67 |
6.13 |
8 |
|
Writing & printing |
4.1 |
3.08 |
8.67 |
4.32 |
7 |
|
Newsprint |
2.5 |
1.88 |
5.75 |
2.4 |
5 |
|
Specialty |
6 |
0.75 |
3.19 |
0.92 |
4 |
|
Total |
13.1 |
9.88 |
0.73 |
13.76 |
6.96 |
Growth in the education industry
The government has increased focus on education and initiated several central and state-level programs such as Sarva Siksha Abhiyan (Education for All) and Operation Blackboard. The result has been increased expenditure on textbooks and notebooks, providing a good opportunity for paper companies. Additionally, with higher literacy levels, circulation of other print media, such as newspapers, has also increased. Despite the continued focus on digitization, India’s demand for paper is expected to rise 53 per cent in the next six years, primarily due to a sustained increase in the number of school-going children in rural areas. This initiative is expected to add to the demand for the products of JKPL and improve the revenue growth visibility.
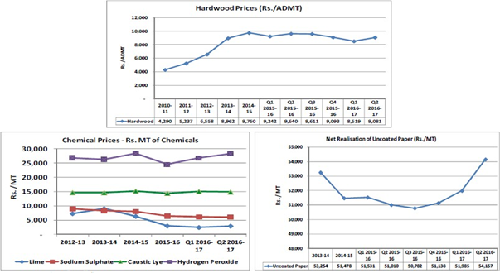
Favorable price forecast of raw materials
Raw materials constitute 40-50% of cost of paper production. Energy costs can vary from 7% to 15% of the cost of pulp production. Currently, the wood and bamboo demand of the country’s Pulp & Paper Industry is around 11 million tonnes against availability of 9 million tonnes per annum. The demand is expected to increase to 15 million tonnes by 2024-25. Wood costs for the pulp industry have been falling steadily worldwide for almost five years with hardwood fiber prices declining the most, according to the Wood Resource Quarterly (WRQ). The Hardwood Wood Fiber Price Index (HFPI) fell by 0.6 per cent in the Q1/16 mainly because of lower prices for hardwood pulp in Russia, Eastern Canada, France and Germany. The HFPI has been on a consistent decline the past few years with the current index being 29 per cent lower than it’s record-high in 2011. The biggest price drops since the peak of the HFPI index have mainly occurred in countries with fast-growing plantations such as Chile, Brazil, Australia and Indonesia. The price declines have entirely been the result of a stronger U.S. dollar, with hardwood log costs in the local currencies going up over 25 per cent in countries such as Brazil, Chile, Indonesia and Russia. With the prices of both wood and fuel is expected to soften mainly due to strong dollar and no substantial pickup in demand from developed markets, JKPL can be a major beneficiary.
Growth in press publications
India is the second largest print market in the world, with a readership base of over 250 million. There are approximately 130,000 printing presses in India. The Press in India 2014-15 report states that Print media in India recorded a 5.8 per cent growth in 2014-15, with 5,817 new publications getting registered during the year, taking the total number up to 1, 05,443. The printing and packaging industry is growing at a compound annual growth rate of over 16.2 percent since 1989. The strong growth in the printing industry is expected to continue to fuel the demand for paper.
Conclusion and Recommendation
JKPL is a major player in the domestic paper industry with wide product and brand portfolio catering the various product demands. The per capita consumption of paper is expected to improve in the coming future mainly because of change in consumption pattern, change in lifestyle and increase in per capita income. The margins of the company are expected to improve due to improvement in premium products. With no major capex plans in coming future, soft raw material prices combined with debt reduction we expect stock to do considerably well in medium and long term future.
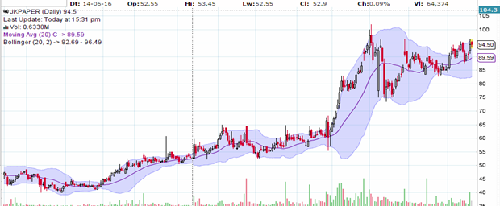
Stock performance chart
Financials
Profit and loss account (Consolidated)
|
|
FY12 |
FY13 |
FY14 |
FY15 |
FY16 |
|
INCOME : |
|
|
|
|
|
|
Sales Turnover |
1558.9 |
1727.3 |
2042.03 |
2536.61 |
2920.91 |
|
Excise Duty |
67.05 |
83.49 |
100.36 |
121.14 |
127.01 |
|
Net Sales |
1491.85 |
1643.81 |
1941.67 |
2415.47 |
2793.9 |
|
Other Income |
19.69 |
10.49 |
12.64 |
8.96 |
11.25 |
|
Stock Adjustments |
16.13 |
9.79 |
58.36 |
25.46 |
-19.15 |
|
Total Income |
1527.67 |
1664.09 |
2012.67 |
2449.89 |
2786 |
|
EXPENDITURE : |
|
|
|
|
|
|
Raw Materials |
793.6 |
914.86 |
1148.67 |
1360.79 |
1469.49 |
|
Power & Fuel Cost |
186.62 |
184.97 |
212.68 |
252.75 |
214.44 |
|
Employee Cost |
126.2 |
141.83 |
159.91 |
152.75 |
183.84 |
|
Other Manufacturing Expenses |
37.12 |
39.39 |
80.07 |
76.63 |
88.6 |
|
Selling and Administration Expenses |
199.02 |
228.34 |
247.85 |
263.73 |
349.59 |
|
Miscellaneous Expenses |
8.95 |
-11.01 |
27.55 |
81.71 |
60.56 |
|
Less: Pre-operative Expenses Capitalised |
0 |
0 |
0 |
0 |
0 |
|
Total Expenditure |
1351.51 |
1498.38 |
1876.73 |
2188.36 |
2366.52 |
|
Operating Profit |
176.16 |
165.71 |
135.94 |
261.53 |
419.48 |
|
Interest |
51.47 |
53.76 |
128.53 |
205.35 |
199.77 |
|
Gross Profit |
124.69 |
111.95 |
7.41 |
56.18 |
219.71 |
|
Depreciation |
73.74 |
73.77 |
126.52 |
115.76 |
109.83 |
|
Minority Interest (before tax) |
0 |
0 |
0.01 |
0 |
0 |
|
Profit Before Tax |
50.95 |
38.18 |
-119.12 |
-59.58 |
109.88 |
|
Tax |
9.46 |
-1.82 |
1.42 |
1.55 |
-0.13 |
|
Fringe Benefit Tax |
0 |
0 |
0 |
0 |
0 |
|
Deferred Tax |
-6.58 |
1.85 |
-45.82 |
-42.71 |
37.09 |
|
Net Profit |
48.07 |
38.15 |
-74.72 |
-18.42 |
72.92 |
|
Minority Interest (after tax) |
0 |
0 |
0 |
-0.03 |
0 |
|
Profit/Loss of Associate Company |
0.45 |
-0.16 |
0 |
0 |
0 |
|
Net Profit after Minority Int & P/L Asso.Co. |
48.52 |
37.99 |
-74.72 |
-18.39 |
72.92 |
|
Extraordinary Items |
4.22 |
17.55 |
-17.74 |
-6.04 |
-0.17 |
|
Adjusted Net Profit |
44.3 |
20.44 |
-56.98 |
-12.35 |
73.09 |
|
|
|
|
|
|
|
|
Dividend |
20.49 |
6.83 |
0 |
0 |
7.43 |
|
Preference Dividend |
0.01 |
0 |
0 |
0 |
0 |
|
Equity Dividend (%) |
15 |
50 |
0 |
0 |
5 |
|
Dividend Per Share(Rs) |
1.5 |
5 |
0 |
0 |
0.5 |
Balance Sheet (Consolidated)
|
|
FY12 |
FY13 |
FY14 |
FY15 |
FY16 |
|
SOURCES OF FUNDS : |
|
|
|
|
|
|
Share Capital |
136.65 |
136.62 |
136.62 |
136.62 |
148.53 |
|
Reserves Total |
714.36 |
738.71 |
663.57 |
638.99 |
741.08 |
|
Total Shareholders Funds |
851.01 |
875.33 |
800.19 |
775.61 |
889.61 |
|
Minority Interest |
0 |
0 |
0.09 |
0.02 |
0.02 |
|
Secured Loans |
924.67 |
1505.79 |
1832.79 |
1678.5 |
1526.62 |
|
Unsecured Loans |
168.88 |
278.45 |
414.88 |
425.8 |
414.68 |
|
Total Debt |
1093.55 |
1784.24 |
2247.67 |
2104.3 |
1941.3 |
|
Other Liabilities |
26.92 |
31.18 |
38.05 |
41.33 |
47.36 |
|
Total Liabilities |
1971.48 |
2690.75 |
3086 |
2921.26 |
2878.29 |
|
APPLICATION OF FUNDS : |
|
|
|
|
|
|
Gross Block |
1536.13 |
1575.05 |
3179.83 |
3077.94 |
3182.35 |
|
Less: Accumulated Depreciation |
678.03 |
751.23 |
603.16 |
708.01 |
815.95 |
|
Net Block |
858.1 |
823.82 |
2576.67 |
2369.93 |
2366.4 |
|
Capital Work in Progress |
583.74 |
1540.98 |
22.74 |
27.46 |
20.18 |
|
Investments |
64.29 |
6.22 |
69.37 |
3.86 |
10.46 |
|
Current Assets, Loans & Advances |
|
|
|
|
|
|
Inventories |
164.19 |
216 |
292.59 |
374.35 |
338.95 |
|
Sundry Debtors |
144.16 |
119.38 |
170.8 |
146.25 |
140.46 |
|
Cash and Bank |
147.82 |
33.92 |
12.05 |
17.83 |
15.97 |
|
Loans and Advances |
144.09 |
190.32 |
293.62 |
303.99 |
334.18 |
|
Total Current Assets |
600.26 |
559.62 |
769.06 |
842.42 |
829.56 |
|
Less : Current Liabilities and Provisions |
|
|
|
|
|
|
Current Liabilities |
263.73 |
279.66 |
372.38 |
372.5 |
352.33 |
|
Provisions |
26.13 |
12.64 |
2.67 |
1.2 |
13.98 |
|
Total Current Liabilities |
289.86 |
292.3 |
375.05 |
373.7 |
366.31 |
|
Net Current Assets |
310.4 |
267.32 |
394.01 |
468.72 |
463.25 |
|
Deferred Tax Assets |
0 |
0 |
0 |
312.35 |
302.61 |
|
Deferred Tax Liability |
121.82 |
119.97 |
77.34 |
345.54 |
372.89 |
|
Net Deferred Tax |
-121.82 |
-119.97 |
-77.34 |
-33.19 |
-70.28 |
|
Other Assets |
276.77 |
172.38 |
100.55 |
84.48 |
88.28 |
|
Total Assets |
1971.48 |
2690.75 |
3086 |
2921.26 |
2878.29 |
- Share :


Post a Comment
|
DISCLAIMER |
This report is only for the information of our customers. Recommendations, opinions, or suggestions are given with the understanding that readers acting on this information assume all risks involved. The information provided herein is not to be construed as an offer to buy or sell securities of any kind. ATS and/or its group companies do not as assume any responsibility or liability resulting from the use of such information.