Mold-Tek Packaging limited Research Report
|
Market Price |
Recommendation |
Target |
Time Horizon |
|
1025.20 |
Buy |
1241 |
1-Year |
Mold-Tek Packaging limited - Q2FY2023 REVIEW
Mold-Tek Packaging Limited reported net revenue of ₹182.74 crores for the quarter ended September 30, 2022, compared to ₹159.76 crores for September 30, 2021. Profit After Tax was ₹19.42 crores for the quarter ended September 30, 2022, compared to ₹17.59 crores during the corresponding quarter of the previous year, respectively.
STOCKDATA
|
52 Week H/L |
648.15/1058 |
|
Market Cap (crores) |
3,395 |
|
Face Value (₹) |
5.00 |
|
Book Value |
146.25 |
|
EPS TTM |
21.14 |
|
NSE Code |
MOLDTKPAC |
Mold-Tek Packaging limited - OVERVIEW
-
Mold-Tek Packaging produces injection-molded containers for lubricants, paints, food, and other goods.
-
Mold-Tek Packaging Limited has been awarded a letter of recognition from Grasim Industries Limited's Birla Paints Division for the provision of packaging materials (PAILS). As a result, the company will establish a co-located plant at Cheyyar, close to Chennai, to meet their needs. The new plant would require an expenditure of about 30 crores to build up and be operational by the end of the calendar year 2025. To meet the demand for these items as well as serve customers who purchase PAILS in Southern India, the company also proposes to establish food and FMCG IML container production facilities in Cheyyar.
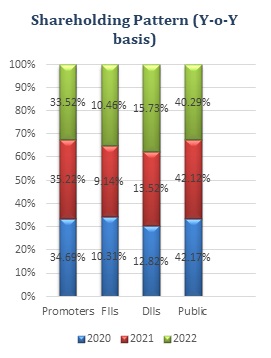
SHAREHOLDING PATTERN (%)
|
|
June-22 |
Sep-22 |
Dec-22 |
|
Promoter |
34.23 |
34.11 |
34.01 |
|
Public |
37.00 |
31.82 |
31.43 |
|
FII |
12.02 |
13.94 |
14.51 |
|
DII |
16.75 |
20.13 |
20.05 |
Mold-Tek Packaging limited - BENCHMARK COMPARISON
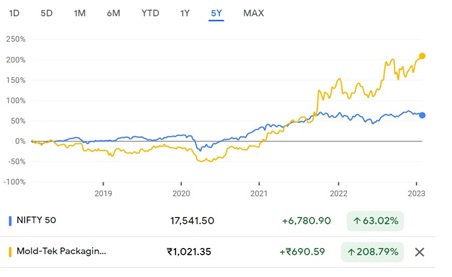
Beta: 0.82 |
Alpha: 38.72 |
Risk Reward Ratio: 1.34 |
Margin of Safety: 17% |
BUSINESS
-
Mold-Tek Packaging Limited (MTPL), which was founded in 1986, is the industry pioneer in rigid plastic packaging in India.
-
1993 marked the year that MTPL was publicly listed.
-
The business includes a fully integrated production plant where it can produce packaging products and apply various types of labels.
-
The "In-Mold labeling" (IML) concept for decorating plastic containers using ROBOTS was originally introduced by Mold-tek as a company in India. IML makes it possible to produce containers for food and FMCG items that are completely clean and hands-free while also having photographic-grade ornamentation.
-
In addition to producing IMl Labels in-house, Mold-Tek is the only packaging company in the world to develop and produce ROBOTS for IML decorating.
-
10 manufacturing facilities and 2 stocking locations are part of Mold-Tek Packaging Limited. Over 45,000 TPA of installed injection moulding capacity currently exists.
-
Asian Paints, Castrol, Shell, Mondelez, Hindustan Unilever, and other significant clients are among those where MTPL has a prominent presence.
-
Due to its cost advantage from backward integration, MTPL enjoys higher margins in the packaging sector.
-
The business has a cutting-edge R&D facility in Hyderabad and a robust Tool Room on which to concentrate.
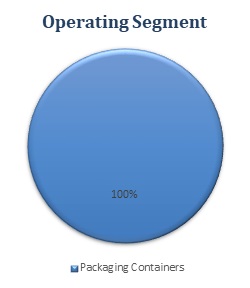
-
one operating segment, namely Packaging Containers, has been determined based on the company's performance from a product perspective.
Mold-Tek Packaging limited - SWOT ANALYSIS
STRENGTH
-
Annual Profit improving.
-
Company with low debt.
-
Diversified Product Portfolio.
-
Strong customer base.
WEAKNESS
-
Promoter share are pledged.
-
Decline in net profit Q-o-Q basis.
-
DIIs have decreased their shareholding.
-
High customer concentration
OPPORTUNITIES
-
backward integration, MTPL enjoys higher margins in the packaging sector
-
In-house R&D facility.
THREAT
-
Increasing global uncertainty.
-
An increase in prices of raw materials costs could impact the profit of the company.
-
High supplier concentration.
PACKAGING INDUSTRY ANALYSIS
-
In the two years after the pandemic began, the packaging sector has undergone tremendous change.
-
New patterns that have arisen during the various pandemic episodes have been embraced by several packaging businesses. In the food, pharmaceutical, beverage, cosmetic, and other FMCG industries, packaging trends have become increasingly prominent.
-
These trends range from smart packaging to sustainable and safe packaging with innovation and aesthetic touch.
-
From 2022 to 2027, the Indian packaging market is projected to grow at a CAGR of 12.60%.
-
Growing population, rising income levels, and changing lifestyles are expected to increase consumer spending across a variety of businesses, which will increase the need for packaging product solutions.
-
To control the scenario where the supply chain is disrupted, the government introduced the production-linked incentive (PLI) plan to incentivise businesses in 10 industries to promote local manufacturing and enhance exports. Atmanirbhar and structural changes are other factors that should improve India's packaging industry's development potential.
-
In India, packaging consumption has surged by about 200% in the past ten years, from 4.3 kilograms per person per year (pppa) in 2010 to 8.6 kilos pppa in 2020, according to the Indian Institute of Packaging (IIP). In contrast to other industrialised nations across the world, this business still has a lot of room for expansion despite the rapid rise over the past ten years. India is also becoming a popular international location for organized retail. E-commerce is spreading quickly, bringing about a transformation in the retail industry, and raising the need for packaging.
Mold-Tek Packaging limited - FINANCIAL OVERVIEW
Mold-Tek Packaging limited - QUARTERLY SUMMARY
|
Quarterly (INR in lakhs) |
Sep-22 |
Jun-22 |
Mar-22 |
Dec-21 |
Sep-21 |
|
Revenue from Operations |
18,255.22 |
20,783.45 |
17,792.27 |
16,028.49 |
15,953.17 |
|
Other income |
18.65 |
12.90 |
105.25 |
15.14 |
22.90 |
|
Total Income |
18,273.87 |
20,796.35 |
17,897.52 |
16,043.63 |
15,976.07 |
|
|
|
|
|
|
|
|
Total Expenditure |
15,588.40 |
17,779.91 |
15,301.54 |
13,552.84 |
13,403.42 |
|
EBIT |
2,685.47 |
3,016.44 |
2,595.98 |
2,490.79 |
2,572.65 |
|
|
|
|
|
|
|
|
Finance cost |
78.24 |
100.77 |
112.92 |
275.30 |
275.42 |
|
EBT before Exceptional Items |
2,607.23 |
2,915.67 |
2,483.06 |
2,215.49 |
2,297.23 |
|
|
|
|
|
|
|
|
Exceptional Items |
- |
- |
- |
- |
- |
|
PBT |
2,607.23 |
2,915.67 |
2,483.06 |
2,215.49 |
2,297.23 |
|
|
|
|
|
|
|
|
Tax Expenses |
665.60 |
744.84 |
751.40 |
549.06 |
537.94 |
|
PAT |
1,941.63 |
2,170.83 |
1,731.66 |
1,666.43 |
1,759.29 |
PROFIT AND LOSS STATEMENT (₹ IN lakhs)
|
|
Mar-19 |
Mar-20 |
Mar-21 |
Mar-22 |
|
Revenue from Operations |
40,571.88 |
43,820.23 |
47,892.54 |
63,146.97 |
|
Other Income |
112.79 |
115.92 |
88.50 |
156.58 |
|
Total Income |
40,684.67 |
43,936.15 |
47,981.04 |
63,303.55 |
|
|
|
|
|
|
|
Cost of Goods sold |
24,492.93 |
25,048.04 |
27,240.08 |
37,658.86 |
|
Gross Profit |
16,191.74 |
18,888.11 |
20,740.96 |
25,644.69 |
|
|
|
|
|
|
|
Excise Duty |
- |
- |
- |
- |
|
Employee Benefits Expense |
4,327.18 |
3,148.42 |
3,289.34 |
3,868.15 |
|
Other Expenses |
4,719.38 |
7,945.27 |
7,913.57 |
9,551.11 |
|
EBITDA |
7,145.18 |
7,794.42 |
9,538.05 |
12,225.43 |
|
|
|
|
|
|
|
Depreciation and Amortisation Expense |
1,610.50 |
1,921.59 |
2,150.48 |
2,642.29 |
|
EBIT |
5,534.68 |
5,872.83 |
7,387.57 |
9,583.14 |
|
|
|
|
|
|
|
Finance Costs |
756.89 |
1,039.81 |
994.43 |
932.33 |
|
EBT before Exceptional Items |
4,777.79 |
4,833.02 |
6,393.14 |
8,650.81 |
|
|
|
|
|
|
|
Exceptional Items |
- |
- |
- |
- |
|
EBT |
4,777.79 |
4,833.02 |
6,393.14 |
8,650.81 |
|
|
|
|
|
|
|
Tax Expense |
1,585.98 |
1,089.27 |
1,597.52 |
2,285.48 |
|
PAT |
3,191.81 |
3,743.75 |
4,795.62 |
6,365.33 |
|
|
|
|
|
|
|
EPS |
|
|
|
|
|
Basic |
11.53 |
12.96 |
16.82 |
22.12 |
|
Diluted |
11.53 |
12.96 |
16.14 |
21.14 |
|
|
|
|
|
|
|
Number of Shares |
|
|
|
|
|
Basic |
276.91 |
288.84 |
285.12 |
287.77 |
|
Diluted |
276.91 |
288.84 |
297.08 |
301.08 |
Mold-Tek Packaging limited - Balance Sheet (₹ in Lakhs)
|
|
Mar-19 |
Mar-20 |
Mar-21 |
Mar-22 |
|
ASSETS: |
|
|
|
|
|
Non-Current Assets: |
|
|
|
|
|
Property, Plant and Equipment |
18,745.53 |
19,836.33 |
23,526.54 |
25,725.96 |
|
Capital Work-in-Progress |
1,604.25 |
1,153.26 |
1,130.20 |
1,383.78 |
|
Investment Property |
5.36 |
5.23 |
5.10 |
4.97 |
|
Intangible Assets |
30.87 |
64.12 |
60.18 |
65.31 |
|
Intangible Assets Under Development |
19.17 |
21.24 |
41.76 |
98.12 |
|
Right-of-Use Assets |
341.89 |
338.37 |
334.84 |
370.33 |
|
Financial Assets: |
|
|
|
|
|
Investments |
971.78 |
733.60 |
864.86 |
1,708.55 |
|
Other Financial Assets |
22.09 |
23.45 |
348.36 |
396.13 |
|
Other Non-Current Assets |
647.91 |
1,325.43 |
305.50 |
588.03 |
|
Total Non-Current Assets |
22,388.85 |
23,501.03 |
26,617.34 |
30,341.18 |
|
|
|
|
|
|
|
Current Assets: |
|
|
|
|
|
Inventories |
4,593.67 |
4,999.57 |
7,082.02 |
9,590.42 |
|
Financial Assets: |
|
|
|
|
|
Trade Receivables |
7,036.99 |
5,890.59 |
9,013.05 |
14,301.18 |
|
Cash and Cash Equivalents |
17.82 |
36.72 |
43.03 |
411.98 |
|
Other Bank Balances |
76.70 |
77.81 |
85.71 |
1,219.39 |
|
Loans |
33.64 |
28.85 |
32.11 |
61.44 |
|
Other Financial Assets |
251.98 |
307.40 |
234.48 |
315.35 |
|
Current Tax Assets |
136.01 |
131.92 |
122.50 |
153.60 |
|
Other Current Assets |
995.51 |
1,356.29 |
418.40 |
1,021.51 |
|
Total Current Assets |
13,142.32 |
12,829.15 |
17,031.30 |
27,074.87 |
|
|
|
|
|
|
|
Total Assets |
35,531.17 |
36,330.18 |
43,648.64 |
57,416.05 |
|
|
|
|
|
|
|
EQUITY AND LIABILITIES: |
|
|
|
|
|
Equity: |
|
|
|
|
|
Equity Share Capital |
1,384.55 |
1,386.30 |
1,395.52 |
1,562.80 |
|
Other Equity |
17,781.98 |
18,359.06 |
24,200.10 |
44,147.80 |
|
Total Equity |
19,166.53 |
19,745.36 |
25,595.62 |
45,710.60 |
|
|
|
|
|
|
|
Liabilities: |
|
|
|
|
|
Non-Current Liabilities: |
|
|
|
|
|
Financial Liabilities: |
|
|
|
|
|
Borrowings |
1,894.68 |
2,518.24 |
1,661.51 |
2,537.29 |
|
Lease Liabilities |
- |
- |
- |
9.49 |
|
Provisions |
203.28 |
261.74 |
348.63 |
377.60 |
|
Deferred Tax Liabilities |
1,306.05 |
1,161.37 |
1,204.86 |
1,473.17 |
|
Other Non-Current Liabilities |
17.16 |
8.53 |
2.59 |
23.01 |
|
Total Non-Current Liabilities |
3,421.17 |
3,949.88 |
3,217.59 |
4,420.56 |
|
|
|
|
|
|
|
Current Liabilities: |
|
|
|
|
|
Financial Liabilities: |
|
|
|
|
|
Borrowings |
8,397.84 |
8,146.00 |
9,152.81 |
1,864.23 |
|
Trade Payables: |
|
|
|
|
|
Total Outstanding Dues of Micro and Small Enterprises |
27.18 |
10.57 |
37.70 |
32.27 |
|
Other Creditors |
1,793.29 |
1,794.38 |
3,185.63 |
2,773.90 |
|
Other Financial Liabilities |
2,318.27 |
2,243.22 |
1,918.15 |
1,879.10 |
|
Lease Liabilities |
- |
- |
- |
29.52 |
|
Other Current Liabilities |
250.42 |
390.52 |
362.97 |
536.11 |
|
Provisions |
156.47 |
50.25 |
91.13 |
114.84 |
|
Current Tax Liabilities |
- |
- |
87.04 |
54.92 |
|
Total Current Liabilities |
12,943.47 |
12,634.94 |
14,835.43 |
7,284.89 |
|
|
|
|
|
|
|
Total Equity & Liabilities |
35,531.17 |
36,330.18 |
43,648.64 |
57,416.05 |
Mold-Tek Packaging limited - Cash Flow Statement (₹ in Lakhs)
|
|
Mar-19 |
Mar-20 |
Mar-21 |
Mar-22 |
|
Net Profit Before Tax |
4,777.79 |
4,833.02 |
6,393.14 |
8,650.81 |
|
Net Cash from Operating Activities |
8,348.13 |
5,993.22 |
6,053.46 |
197.85 |
|
Net Cash Used for Investing Activities |
-7,558.31 |
-2,580.88 |
-5,087.87 |
-5,479.79 |
|
Net Cash From (Used For) Financing Activities |
-790.64 |
-3,393.45 |
-959.28 |
5,650.89 |
|
Net Increase in Cash and Cash Equivalents |
-0.82 |
18.89 |
6.31 |
368.95 |
|
Cash And Cash Equivalents at The Beginning of The Year |
18.64 |
17.82 |
36.71 |
43.02 |
|
Cash And Cash Equivalents at The End of the Year |
17.82 |
36.71 |
43.02 |
411.97 |
|
|
Mar-19 |
Mar-20 |
Mar-21 |
Mar-22 |
|
Profitability Ratio |
|
|
|
|
|
Gross Profit |
39.91% |
43.10% |
43.31% |
40.61% |
|
EBITDA Margin |
17.61% |
17.79% |
19.92% |
19.36% |
|
EBIT Margin |
13.64% |
13.40% |
15.43% |
15.18% |
|
Pre-Tax Margin |
11.78% |
11.03% |
13.35% |
13.70% |
|
Net Profit Margin |
7.87% |
8.54% |
10.01% |
10.08% |
|
|
|
|
|
|
|
Return on Investment |
|
|
|
|
|
Return on Asset – ROA |
10% |
10% |
12% |
13% |
|
Return on Capital Employed – ROCE |
26% |
25% |
28% |
24% |
|
Return on Equity – ROE |
17% |
19% |
21% |
18% |
|
|
|
|
|
|
|
Liquidity Ratio (x) |
|
|
|
|
|
Current ratio |
1.02 |
1.02 |
1.15 |
3.72 |
|
Quick Ratio |
0.66 |
0.62 |
0.67 |
2.40 |
|
|
|
|
|
|
|
Turnover Ratio |
|
|
|
|
|
Receivables Turnover |
5.2 |
6.8 |
6.4 |
5.4 |
|
Inventory Turnover |
5.0 |
5.2 |
4.5 |
4.5 |
|
Payables Turnover |
13.8 |
11.0 |
13.1 |
2,551.4 |
|
Asset Turnover |
1.2 |
1.2 |
1.2 |
1.2 |
|
|
|
|
|
|
|
Solvency Ratio |
|
|
|
|
|
Debt to Equity |
0.10 |
0.13 |
0.06 |
0.06 |
|
Interest Coverage Ratio |
7 |
6 |
7 |
10 |
Mold-Tek Packaging limited - Technical Analysis
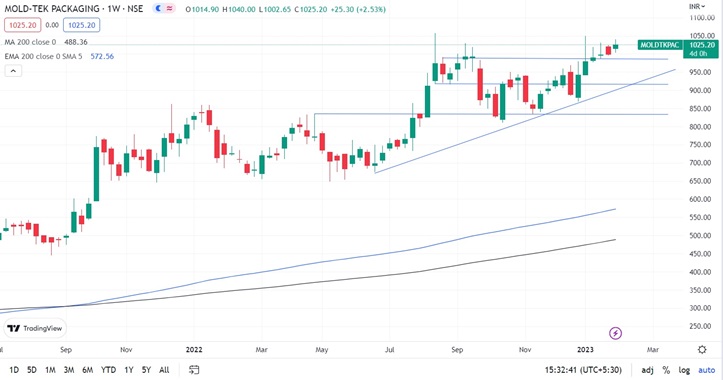
-
Stock is trading above Moving Average 200 Days with a support level of ₹830 and a resistance level of ₹980.
-
Stock is on upward trend on the weekly and Monthly chart.
-
One can accumulate this stock at current levels
CONCALL
-
By FY24 (up 51% from FY22), the company wants to increase its manufacturing capacity by 25,000 MT. In FY23, it's anticipated to have a capex of $125 billion.
-
The management has forecast a volume CAGR of over 20% for FY22–24E, driven by the introduction of new products, new clients, and increases in the wallet shares of current customers.
-
It takes three to six months for OTC pharma items to receive clearance, therefore the company is expected to begin producing packaging for GSK's OTC medicine Iodex. Pharma product commercial manufacturing is anticipated to begin in Q3FY24.
-
The business has created new moulds for Horlicks SKUs of 1 kilogram and 2 kg, and manufacturing will begin in Q4 FY 23.
-
Due to the delay in IML printing machine installation, output was lost (amid a shortage of semiconductors). Had there not been a delay in the supply of IML printing machines, which are anticipated to be commissioned by the end of December 2022, the company would have seen a 15% volume rise in Q2FY23. As a result, starting in Q4FY23, the EBITDA margin will return to normal.
-
Within the next two years, Hyderabad will rank among the top pharma centres worldwide (as 15000 acres of land have been allotted to multiple pharma players to boost manufacturing). Due to its strong R&D-driven product introductions and shorter lead times, Mold-Tek Packaging is sure that its IBM packaging products will attract significant business from major pharmaceutical companies.
Mold-Tek Packaging limited -Recommendation Rationale
-
Strong Customer Base:
-
Repeat business is ensured by Moldtek's long-standing ties with key clients in the paints, lubricants, and food sectors.
-
Moldtek can recoup any rise in raw material prices, albeit with a time lag, because it may pass on raw material costs every month to some of its clients and every quarter to others.
-
-
Diversified Product:
-
The firm operates in food, FMCG, paints, lubricants, and areas. Revenue growth has been aided by new goods introduced in the previous two years including dispensing pumps (used for hand sanitizers and other FMCG items) and QR code-printed IML.
-
Additionally, the company's introduction into the pharmaceutical industry would aid in further diversifying its income sources over the following two years.
-
-
Experience over three decades in the packaging industry:
-
The business, which was formed in 1985 to produce hard plastic packaging materials, has nearly three decades of experience in the decorative plastic pail packaging market.
-
It primarily serves the paint, lubricants, food, and FMCG industries where it has built strong connections with marquee clients that make it easier to complete recurrent orders.
-
-
Capex Plan:
-
Mold-Tek Packaging Limited has been awarded a letter of recognition from Grasim Industries Limited's Birla Paints Division for the provision of packaging materials (PAILS). The new plant would require an expenditure of about 30 crores to build up and be operational by the end of the calendar year 2025.
-
The company wants to increase its manufacturing capacity by 25,000 MT. In FY23, it's anticipated to have a capex of $125 billion.
-
The company has spent between 12 and 13 crores on its dispensing pump equipment and moulds.
-
-
Strong Financial Profile:
-
The company has a strong financial profile, which is characterised by favorable coverage indicators, minimal leverage, and good profitability. With an increase in earnings and a reduction in working capital debt, its coverage measures, including DSCR and ICR, increased in FY2022 to 5.5 times and 13.0 times, respectively, from 3.8 and 9.5 times in FY2021. Similar to how the capital structure has improved sequentially from FY2020, with over Rs. 170 crores added through rights issues and QIP in FY2021, FY2022, and Q1 FY2023, capital structure has also exhibited improvement.
-
Mold-Tek Packaging limited - Valuation
-
Mold-Tek Packaging Limited has shown revenue growth of 15% CAGR for FY2018-2022.
-
The company’s net profit has shown a growth of 23% CAGR for FY2018-2022.
-
The company’s ROE and ROCE are 18% & 24% for FY2022.
-
The company has low debt.
-
We anticipate the company could generate higher revenue for the following FY 2023, comparable to the prior year, based on the company's present performance in FY 2022.
-
We used data from the last five years (2018-2022) to anticipate revenue for the fiscal years 2023–2027.
Estimated Income Statement (₹ in Lakhs)
|
|
Mar-23 |
Mar-24 |
Mar-25 |
Mar-26 |
Mar-27 |
|
|
2023-E |
2024-E |
2025-E |
2026-E |
2027-E |
|
Revenue |
72,962.01 |
84,094.54 |
96,926.14 |
1,11,716.18 |
1,28,763.63 |
|
COGS |
43,409.53 |
50,038.34 |
57,679.40 |
66,487.29 |
76,640.18 |
|
Gross Profit |
29,552.49 |
34,056.20 |
39,246.74 |
45,228.89 |
52,123.45 |
|
Employee Expenses |
4,729.08 |
5,451.23 |
6,283.65 |
7,243.19 |
8,349.26 |
|
Other Expenses |
11,518.55 |
13,277.48 |
15,305.00 |
17,642.14 |
20,336.17 |
|
EBITDA |
13,304.86 |
15,327.49 |
17,658.08 |
20,343.56 |
23,438.02 |
|
Depreciation |
2,696.58 |
2,816.06 |
2,982.41 |
3,199.96 |
3,474.02 |
|
EBIT |
10,608.29 |
12,511.43 |
14,675.67 |
17,143.60 |
19,964.01 |
|
Financial Cost |
1,032.07 |
1,217.22 |
1,427.78 |
1,667.88 |
1,942.27 |
|
EBT |
9,576.22 |
11,294.21 |
13,247.90 |
15,475.72 |
18,021.74 |
|
Tax expenses |
2,394.06 |
2,823.55 |
3,311.97 |
3,868.93 |
4,505.43 |
|
PAT |
7,182.17 |
8,470.66 |
9,935.92 |
11,606.79 |
13,516.30 |
Disclaimer: This report is only for the information of our customer Recommendations, opinions, or suggestions are given with the understanding that readers acting on this information assume all risks involved. The information provided herein is not to be construed as an offer to buy or sell securities of any kind.
- Share :


Post a Comment
|
DISCLAIMER |
This report is only for the information of our customers. Recommendations, opinions, or suggestions are given with the understanding that readers acting on this information assume all risks involved. The information provided herein is not to be construed as an offer to buy or sell securities of any kind. ATS and/or its group companies do not as assume any responsibility or liability resulting from the use of such information.