Mphasis Limited
|
Industry |
Market Price |
Recommendation |
Target |
Time Horizon |
|
Computers – Software |
3,079 |
Buy |
3,525 |
1 Year |
Q2 FY22 Review
Mphasis Limited reported a total income of Rs 2,869 crore for the quarter ended Sept 30, 2021, when compared to Rs 2,435 crore for the quarter ended Sept 30, 2020. EBIT and Profit After Tax was Rs 476 crore and Rs 341 crore for the quarter ended Sept 30, 2021, as compared to Rs 418 crore and Rs 299 crore during the corresponding quarter of the previous year.
Investment Summary
|
CMP (Rs) |
3,079 |
|
52 Week H/L |
1511/3659 |
|
Market Cap (Cr) |
57,818 |
|
Face Value (Rs) |
10.00 |
|
Promoter Holding (%) |
55.9 |
|
Non-Promoter Holding (%) |
44.1 |
|
Total (%) |
100.00 |
Overview
-
Leading provider of Information Technology/IT enabled services
-
Reducing dependence on DXC business
-
Strong presence in America
-
Net TCV wins of over $200 million for seven consecutive quarters
-
Front2Back approach; “Tribes and squad” driven competency model
-
Acquisition of Blink Interactive Inc
Quarterly Summary
|
Quarterly (Cr) |
Sep-2021 |
Jun-2021 |
Mar-2021 |
Dec-2020 |
Sep-2020 |
|
Operating Revenues |
2,869.2 |
2,690.8 |
2,524.3 |
2,474.4 |
2,435.4 |
|
Other Income |
43.9 |
46.7 |
32.6 |
36.6 |
26.1 |
|
Total Income |
2,913.2 |
2,737.5 |
2,556.9 |
2,510.9 |
2,461.5 |
|
Total Expenditure |
2,437 |
2,263 |
2,118 |
2,069 |
2,042 |
|
EBIT |
476.2 |
473.8 |
438 |
441.4 |
418.5 |
|
Interest |
16.3 |
15.7 |
14.4 |
14.8 |
14.7 |
|
Tax |
118.2 |
118.4 |
106.7 |
101.1 |
104.6 |
|
Net Profit |
341.5 |
339.7 |
316.9 |
325.5 |
299.2 |
Business
Mphasis Limited is a global technology company with a specialization in providing a suite of application development and maintenance services, infrastructure outsourcing services and business & knowledge process outsourcing solutions to its clients across the world. It has deep domain expertise in the Banking, Financial Services and Insurance sectors (BFSI) and serves 35 of the top 50 US BFSI firms. The company has a global presence through its delivery centers in several countries like Australia, China, Singapore, US, UK, France, Canada and other countries. Mphasis was incorporated in the year 1992, formed after the merger of Mphasis Corporation, a US-based IT consulting company and BFL Software Limited, an India-based IT services company. The company has BLINK, Mphasis Datalytyx, Mphasis Digital Risk, Mphasis Javelina, Mphasis Stelligent and Mphasis Wyde as its subsidiaries.
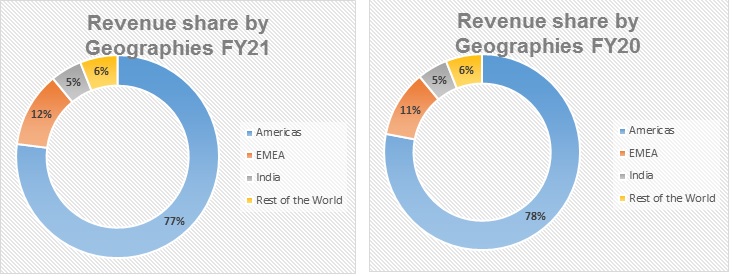
The company’s services are broadly categorized into two businesses – Direct and DXC. Under its Direct business, the company predominantly caters to its customers in the sectors like banking, diversified financial services and insurance. From this business, the company realizes around 83% of the total revenue. DXC business was formed through a merger of HP Enterprise (HPE) and Computer Sciences Corporation (CSC), after the private equity firm Blackstone bought the firm in April 2016 for over USD 1 billion from Hewlett-Packard. As a part of the deal, HP offered a minimum revenue commitment of USD 990 million over a period of five years. The commitment period ended in 2021, and the company reduced its dependence on DXC business. The revenue from DXC is expected to stabilize at 10-12%, and currently, the revenue from DXC is at 15% of the total revenue in FY21.
Mphasis identifies the business segments as Banking and Capital Market, Logistics and Transportation, TMT (Technology, Media & Entertainment, and Telecommunication), Insurance, and Others. The segmental revenue from Banking and Capital Market was around Rs 49,860.7 crore (51.28% of the total revenue) in FY21, an increase of ~25% when compared to the revenue from this segment in FY20. Revenue from Logistics and Transportation was around Rs 12,681.5 (13.04% of the total revenue) in FY21, an increase of ~4.5% when compared to the revenue from this segment in FY20. Revenue from the segment TMT was around Rs 12,924.9 (13.3% of the total revenue) in FY21, a decrease of ~7.5% when compared to the revenue from this segment in FY20. Revenue from the segment Insurance was around Rs 9,508.9 (9.8% of the total revenue) in FY21, a decrease of ~5.4% when compared to the revenue from this segment in FY20. Revenue from the segment others was around Rs 11,944.35 (12.3% of the total revenue) in FY21, a decrease of ~0.45% when compared to the revenue from this segment in FY20.
In April 2021, the PE firm Blackstone dropped its plan of selling its stake in Mphasis and transferred its entire shareholding to its two new funds. Blackstone believes that the market value of Mphasis will grow to over $10 billion from then valuation of $ 4 billion.
Mphasis acquired a US-based design consultancy services firm, Blink Interactive Inc for $ 94 million in September 2021. Blink provides design consultancy services around user experience (UX) and customer experience (CX) for marquee brands. This acquisition is expected to boost the company’s experience competencies with end-to-end capabilities in user experience research, strategy, design and implementation. This deal is revenue-accretive and is expected to be in line with the company’s Front2Back transformation and growth strategy.
Revenue Trend
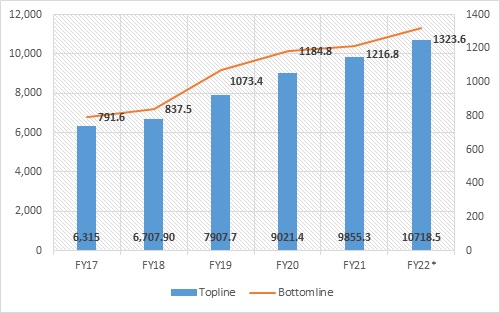
Topline and Bottomline trend (Crores)
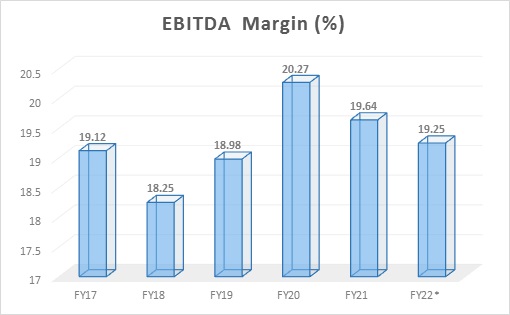
EBITDA Margin Trend (%)
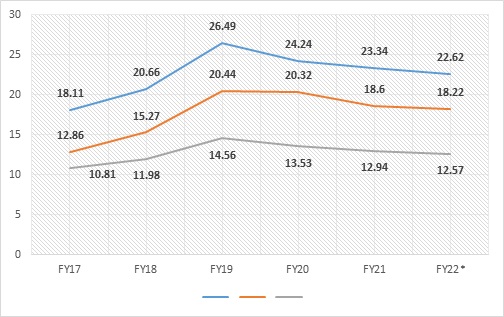
ROE, ROCE, and Asset Turnover trend (%)
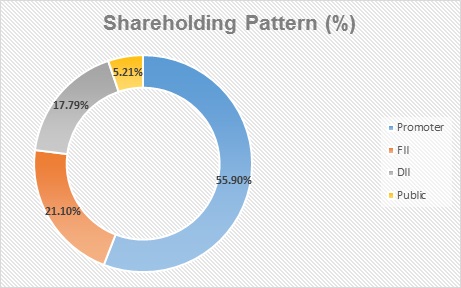
Shareholding Pattern (%)
Top 10 Shareholders
|
Rank |
Name |
Holdings % |
|
1 |
BCP Topco IX Pte. Ltd |
55.90% |
|
2 |
Mirae Asset Fund |
2.41% |
|
3 |
HDFC Life Insurance Com. Ltd |
1.37% |
|
4 |
UTI |
1.29% |
|
5 |
Government Pension Fund Global |
1.21% |
|
6 |
Nomura India Investment Fund |
1.06% |
|
7 |
First State Asian Equity Plus Fund |
1.04% |
|
8 |
Axis Mutual Fund Trustee Ltd |
1.01% |
|
9 |
Bodies Corporate |
0.73% |
|
10 |
Clearing Members |
0.08% |
Ratio Analysis
|
Year-end March |
FY17 |
FY18 |
FY19 |
FY20 |
FY21 |
|
Per share data (Rs) |
|
|
|
|
|
|
Basic EPS |
37.6 |
42.6 |
55.5 |
63.1 |
64.4 |
|
Diluted EPS |
37.6 |
42.6 |
55.5 |
63.1 |
64.4 |
|
Cash EPS |
41.4 |
47 |
61.7 |
75.9 |
78 |
|
BV/Share |
292.4 |
283.6 |
281.9 |
312.5 |
348.9 |
|
P/E |
15.42 |
19.66 |
17.85 |
10.46 |
27.72 |
|
Dividend/share |
- |
20 |
27 |
35 |
65 |
|
Net Profit/share |
37.6 |
43.3 |
57.6 |
63.5 |
65.1 |
|
Profitability Ratios (%) |
|
|
|
|
|
|
EBDIT Margin (%) |
19.12% |
18.12% |
18.98% |
20.27% |
19.64% |
|
EBIT Margin (%) |
18.56% |
17.62% |
18.42% |
18.05% |
17.42% |
|
PBT Margin (%) |
18.08% |
17.22% |
18.20% |
17.13% |
16.77% |
|
Net Profit Margin (%) |
13.02% |
12.79% |
13.88% |
13.39% |
12.51% |
|
Return on Assets (%) |
10.81% |
11.98% |
14.56% |
13.53% |
12.94% |
|
Total Debt/Equity (X) |
0 |
0.1 |
0.1 |
0.1 |
0.1 |
|
Asset Turnover Ratio (%) |
83.04% |
93.70% |
104.88% |
101.02% |
103.44% |
|
Liquidity Ratios (%) |
|
|
|
|
|
|
Current Ratio (X) |
4.1 |
2.8 |
2.1 |
2 |
2.4 |
|
Quick Ratio (X) |
4.1 |
2.8 |
2.1 |
2 |
2.4 |
|
Inventory Turnover Ratio (X) |
- |
- |
- |
- |
- |
|
Dividend Payout Ratio NP (%) |
53.08% |
47.18% |
36.02% |
42.46% |
53.66% |
|
Dividend Payout Ratio CP (%) |
48.25% |
43.50% |
33.64% |
35.51% |
44.76% |
|
Earnings Retention Ratio (%) |
46.92% |
52.82% |
63.98% |
57.54% |
46.34% |
|
Cash Earnings Retention Ratio (%) |
51.75% |
56.50% |
66.36% |
64.49% |
55.24% |
|
Valuation Ratios (X) |
|
|
|
|
|
|
Enterprise Value (Cr.) |
11,805.1 |
15,989.1 |
18,315.9 |
11,841.4 |
32,810.5 |
|
Market Cap/Sales (X) |
2 |
2.5 |
2.4 |
1.4 |
3.4 |
|
Price/BV (X) |
2 |
3 |
3.5 |
2.1 |
5.1 |
Financial Overview
Profit and Loss Statement (crore)
|
Year-end March |
FY17 |
FY18 |
FY19 |
FY20 |
FY21 |
|
INCOME (Cr.) |
|
|
|
|
|
|
Revenue From Operations [Gross] |
5,997.4 |
6,377.5 |
7,819.4 |
8,823.8 |
9,692 |
|
Less: Excise/Service Tax/Other Levies |
0 |
0 |
0 |
0 |
0 |
|
Revenue From Operations [Net] |
5,997.4 |
6,377.5 |
7,819.4 |
8,823.8 |
9,692 |
|
Total Operating Revenues |
6,076.4 |
6,545.8 |
7,731 |
8,843.5 |
9,722.3 |
|
Other Income |
238.6 |
162.1 |
176.7 |
177.8 |
132.9 |
|
Total Revenue |
6,315 |
6,7079 |
7,907.7 |
9,021.4 |
9,855.3 |
|
EXPENSES |
|
|
|
|
|
|
Cost Of Materials Consumed |
0 |
0 |
0 |
0 |
0 |
|
Purchase Of Stock-In Trade |
0 |
0 |
0 |
0 |
0 |
|
Changes In Inventories Of FG,WIP And Stock-In Trade |
4.1 |
0 |
0 |
0 |
0 |
|
Employee Expenses |
3,709.6 |
3,817.9 |
4,298.7 |
4,922.6 |
5,629.8 |
|
Depreciation And Amortization Expenses |
79.1 |
70.8 |
75.8 |
231.6 |
241.8 |
|
Other Expenses |
1,023.6 |
1,048.4 |
1,186.8 |
1,044.7 |
2,099.5 |
|
Total Expenses |
5,200.6 |
5,567.3 |
6,500.4 |
7,506 |
8,224.6 |
|
Profit/Loss Before Tax |
1,099.2 |
1,127.6 |
1,407.3 |
1,515.4 |
1,630.6 |
|
Total Tax Expenses |
307.6 |
290.1 |
334 |
330.5 |
413.8 |
|
Profit/Loss After Tax Before Extraordinary Items |
791.6 |
837.5 |
1,073.4 |
1,184.8 |
1,216.8 |
|
Profit/Loss For The Period |
791.6 |
837.5 |
1,073.4 |
1,184.8 |
1,216.8 |
Cash Flow Statement (crore)
|
Year-end March |
FY17 |
FY18 |
FY19 |
FY20 |
FY21 |
|
|
1,099.2 |
1,127.6 |
1,407.3 |
1,515.4 |
1,630.6 |
|
Net Cash From Operating Activities |
664.1 |
733 |
949.7 |
1,321 |
1,454.5 |
|
Net Cash (used in)/from Investing Activities |
267.9 |
492.5 |
289.3 |
140.8 |
-821.9 |
|
Net Cash (used in)/from Financing Activities |
-710 |
-1,379.7 |
-1,341.8 |
-824.7 |
-861.5 |
|
Net Cash and Cash Equivalents |
222 |
-154.3 |
-102.8 |
637.1 |
-228.8 |
|
Opening Cash & Cash Equivalents |
392.6 |
613.3 |
464.2 |
352 |
988 |
|
Closing Cash & Cash Equivalents |
613.3 |
464.2 |
352 |
990.1 |
771.1 |
Balance Sheet (crore)
|
As on 31-03-2021 |
FY17 |
FY18 |
FY19 |
FY20 |
FY21 |
|
EQUITIES AND LIABILITIES |
|
|
|
|
|
|
SHAREHOLDER'S FUNDS |
|
|
|
|
|
|
Equity Share Capital |
210.4 |
193.3 |
186.2 |
186.5 |
187 |
|
Total Share Capital |
210.4 |
193.3 |
186.2 |
186.5 |
187 |
|
Reserves and Surplus |
5,942 |
5,288.5 |
5,063.6 |
5,643.1 |
6,339.7 |
|
Total Reserves and Surplus |
5,942 |
5,288.5 |
5,063.6 |
5,643.1 |
6,339.7 |
|
Total Shareholders’ Funds |
6,152.4 |
5,481.8 |
5,249.8 |
5,829.6 |
6.526.7 |
|
NON-CURRENT LIABILITIES |
|
|
|
|
|
|
Deferred Tax Liabilities [Net] |
15.8 |
5 |
2.8 |
13.7 |
34.3 |
|
Other Long Term Liabilities |
60.3 |
91.6 |
124.7 |
743 |
694.3 |
|
Long Term Provisions |
0 |
5 |
0 |
0 |
0 |
|
Total Non-Current Liabilities |
76.1 |
101.6 |
127.5 |
756.7 |
728.5 |
|
CURRENT LIABILITIES |
|
|
|
|
|
|
Trade Payables |
387.8 |
502.4 |
785 |
666.7 |
596.4 |
|
Other Current Liabilities |
403.3 |
485.1 |
657. |
922.4 |
984.2 |
|
Short Term Provisions |
37.3 |
24.6 |
8.3 |
6.8 |
49.7 |
|
Total Current Liabilities |
1,088.6 |
1,402 |
1,993.7 |
2,167.2 |
2,143.7 |
|
Total Capital And Liabilities |
7,317.1 |
6,985.3 |
7,371.1 |
8,753.5 |
9,398.9 |
|
ASSETS |
|
|
|
|
|
|
NON-CURRENT ASSETS |
|
|
|
|
|
|
Fixed Assets |
224.4 |
184.8 |
214.2 |
889.7 |
890.1 |
|
Total Non-Current Assets |
2,867.9 |
3,039.3 |
3,268 |
4,340.4 |
4,258.7 |
|
CURRENT ASSETS |
|
|
|
|
|
|
Total Current Assets |
4,449.2 |
3,946 |
4,103.1 |
4,413.1 |
5,140.3 |
|
Total Assets |
7,317.1 |
6,985.3 |
7,371.1 |
8,753.5 |
9,398.9 |
Industry Overview
In the last decade, the IT industry grew five times in terms of revenue. IT-Business Process Management (BPM) is the largest private sector employer in India. India is the leading sourcing destination across the world and captures around 55% of the total global sourcing business (USD 200-250 billion). This industry contributed to 8% of India’s GDP in 2020 and is expected to contribute 10% to India’s GDP by 2025. According to Software Technology Park of India (STPI), the IT exports in the first quarter of FY22 stood at Rs 1.2 lakh crore. According to Gartner estimates, Indian IT spending is expected to reach USD 98.5 billion in FY22. The Indian software product industry is estimated to reach USD 100 billion by 2025.
Indian IT companies are expanding their footprint across the globe by acquiring off-shore companies, to enhance their global delivery centers. Similarly, the major countries have significantly invested in Indian IT. Over the last 21 years, Indian computer software and hardware sector attracted foreign direct investment (FDI) worth USD 74.12 billion. Japanese Investments in the IT sector increased 4X between 2016 and 2020 and stood at USD 9.2 billion in FY21. Indian IT-BPM industry is well diversified across all verticals ranging from BFSI to telecom and media.
India has the largest qualified talent pool of technical skilled manpower in the world. Low-cost human resources, when compared to other countries make India a favorable destination for outsourcing global projects. In Union Budget 2021, the Central government allocated Rs 3,108 crore to the IT and telecom sector. The Indian government extended tax holidays to the IT sector for STPIs and Special Economic Zones (SEZs). In August 2021, the Ministry of State for Electronics and IT announced that the IT export would reach USD 400 billion by the end of FY22. The government plans to increase its focus in areas such as cybersecurity, hyper-scale computing, artificial intelligence and blockchain technology.
In the year 2021, India saw the most number of unicorns and stood as the third largest number of unicorns adding country after the US and China. Commerce and Industry Minister Piyush Goyal gave a target of 75 unicorns for 2022. The pandemic in 2020 increased the reliance of the world on IT, and this led to enormous growth potential for the IT industry in India and across the world. National Software Product Policy 2019 was launched with the aim to develop India as the global software product hub. This policy aimed to help the industry grow at a CAGR of 40% to reach USD 70-80 billion by 2025, by creating new employment opportunities for 35 lakh people. The Indian states are also implementing IT favorable policies to attract FDIs and talent pool.
In the post-Covid world, the tech landscape is evolving rapidly and it is believed that the three engines that would drive the sustainable growth of the industry are:
-
Increased global tech spending when compared to 2020
-
The companies’ migration from CAPEX driven tech investment model to tech consumption “as a service”
-
Close alignment of technology themes with the business
The trends witnessed in the IT industry are availability of high-speed internet at low cost, cloud computation, e-governance, and green communication. Advanced technologies are emerging and changing the dynamics of the world at a rapid pace. Some of the technologies that are disrupting the industry are Artificial Intelligence, Internet of things (IoT), Robotics, Blockchain technology, Machine Learning, Virtual Reality, 3D Printing and Immersive Media.
Peer Comparison
|
Company Name |
TTM PE |
PB Ratio |
Debt to Equity |
CMP |
Mkt Cap (Cr) |
|
Mphasis |
43.68 |
8.86 |
0 |
3080 |
57,819 |
|
TCS |
38.47 |
16.63 |
0 |
3,915 |
14,48,215 |
|
Infosys |
36.64 |
10.32 |
0 |
1,874 |
7,87,986 |
|
Wipro |
28.09 |
6.22 |
0 |
620 |
3,40,197 |
|
HCL Tech |
28.19 |
5.41 |
0 |
1198 |
3,25,220 |
Recommendation Rationale
Mphasis Limited, with nearly two decades of presence in the IT industry, has a strong customer base across the world, mainly in America. The company is a leading Information Technology service provider, with a specialization in cloud and digital solutions. Mphasis enjoys strong tailwinds as global enterprises increasingly migrate to the cloud. The company is positioned exceptionally well in the market with strong management, strong order book, long-term strategic customer base, deep domain expertise in BFSI, and a world-class suite of cloud and digital offerings.
The company has long-term relationships with multiple marquee global customers. Since FY20, Mphasis has signed 20 Fortune 500 firms that are well distributed across verticals. With the acquisition of Blink Interactive Inc in September 2021, the company has added 10 more in the Fortune 500 category to its customer base. The average contribution of its top 5 clients exceeds $120 million on a TTM basis, while the top 4 clients individually contribute over $100 million on a TTM basis. The growth in revenue from clients 6 to 10 and 11 to 20 grew at a rate of 49% and 14% on a TTM basis. The overall increase in client base and revenue across the client base reduces the company’s dependence on its top 5 clients.
Mphasis’ strategy of reducing its dependence on DXC business by increasing its revenue from direct business has yielded good results. The revenue from direct increased to 92% in Q2 of FY22 from 82% at the end of FY21. The company envisions to reduce revenue from DXC business to a mid-single digit. Geography-wise, all markets of the company are witnessing strong growth. Europe region is expected to be a growth driver in the coming years, as the company has a strong pipeline and acquiring new clients. The company has recorded total contract value wins of $241 million in the second quarter, seventh consecutive quarter winning of $200 billion plus net new total contract value excluding renewal deals.
Mphasis is customer centric, and this is reflected in Mphasis’ Front2Back Transformation approach. This approach provides a hyper-personalized digital experience to its clients by using the exponential power of cloud and cognitive. The company’s four pillar strategy is to increase its investment in line with its Continuity and Acceleration theme, along four vectors to drive sustainable growth:
-
Geographic expansion of sales and delivery
-
Greater Leadership breadth and dept
-
Buildup of digital capabilities include M&A
-
Expanding IP-driven offerings in AI and ML
The industry on whole has faced headwinds and tailwinds in the form of high attrition rate and revenue growth respectively. In order to address the problem of a high attrition rate, the company has increased wages and also significantly increased hiring over the last few quarters. The company plans to increase the hiring of freshers in FY22. The tailwind of revenue growth resulted in the shortage of supply of digital technology oriented-skilled personnel. The company faces risks in the form of vendor consolidation in favor of large players, EBIT margin impact due to a tight supply environment and stagnation in BFS demand.
Valuation
Mphasis Limited delivered a strong performance, with an EBITDA margin of 19.64% in FY21. Net Profit grew from Rs 791 crore in FY17 to Rs 1216 crore in FY21. A strong sales team, experienced management, increasing client base, healthy deal intake, and M&A activities are expected to drive the company’s growth rate. The company’s EPS is increasing at a good rate and it had an EPS of 64.4 in the last year. The company is currently trading at a P/B ratio of 8.85. We expect the company to perform better in the coming quarters, led by strong demand, additional revenue contribution from acquisitions, and increased contract wins. Valuing the stock at an expected P/E of 50 on TTM EPS of Rs 70.5, we initiate coverage on Mphasis Limited with Buy and a 1-year Target price of Rs 3525. FIIs have increased their holdings in the company to 21.10% from 20.85%, while the DIIs have decreased their holdings in the company to 55.90% from 55.95% in the quarter of December 2021. BUY
- Share :


Post a Comment
|
DISCLAIMER |
This report is only for the information of our customers. Recommendations, opinions, or suggestions are given with the understanding that readers acting on this information assume all risks involved. The information provided herein is not to be construed as an offer to buy or sell securities of any kind. ATS and/or its group companies do not as assume any responsibility or liability resulting from the use of such information.