Redington Limited Research Report
|
Market Price |
Recommendation |
Target |
Time Horizon |
|
187.70 |
Buy |
254 |
1-Year |
Redington Limited - Q2FY2023 Review
Redington Limited reported net revenue of ₹19,050.74 crores for the quarter ended September 30, 2022, compared to ₹15,287.46 crores for September 30, 2021. Profit After Tax was ₹391.91 crores for the quarter ended September 30, 2022, compared to ₹323.09 crores during the corresponding quarter of the previous year, respectively.
Redington Limited - Investment Summary
|
CMP (₹) |
187.70 |
|
52 Week H/L |
109/202.30 |
|
Market Cap (crores) |
14,669 |
|
Face Value (₹) |
2.00 |
|
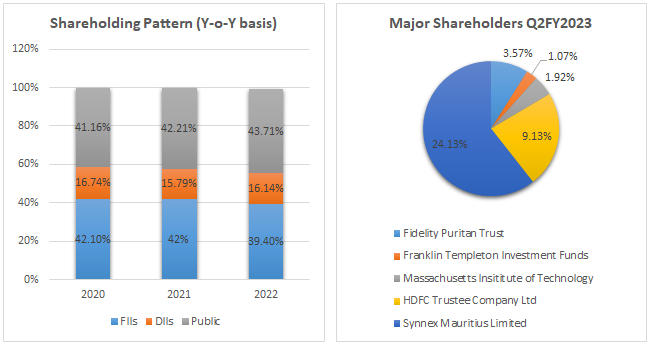
Promoter Holding (%) |
00.00 |
|
Non-Promoter Holding (%) |
100.00 |
|
Total (%) |
100.00 |
|
Book Value |
₹78.16 |
|
EPS TTM |
₹16.39 |
Redington Limited - Overview
-
In India, the Middle East, Turkey, and Africa, Redington Ltd is a top distributor of IT and mobility products and a supplier of supply chain management systems and support services.
-
IT and mobility items are purchased by Redington Ltd from vendors, distribution logistics are handled, and the products are then sold to resellers and dealers. The company continues to offer ancillary services including after-sales support and third-party logistics through its subsidiary businesses and has periodically introduced new goods to its inventory.
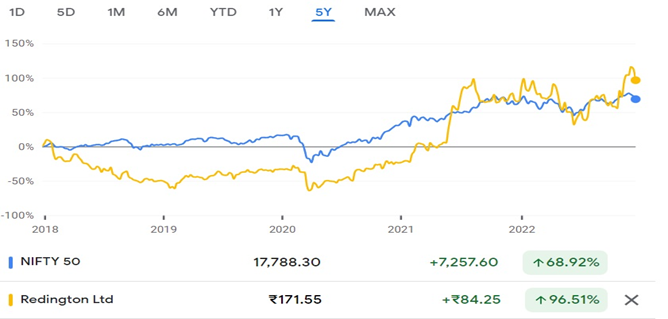
Beta: 1.07 |
Alpha: 37.09 |
Risk Reward Ratio: 1.63 |
Margin of Safety: 26% |
Redington Limited - Quarterly Summary
|
Quarterly (INR in crores) |
Sep-22 |
Jun-22 |
Mar-22 |
Dec-21 |
Sep-21 |
|
Revenue from Operations |
19,050.74 |
16,803.14 |
17,301.76 |
16,600.74 |
15,287.46 |
|
Other income |
30.04 |
25.18 |
22.68 |
19.07 |
25.86 |
|
Total Income |
19,080.78 |
16,828.32 |
17,324.44 |
16,619.81 |
15,313.32 |
|
|
|
|
|
|
|
|
Total Expenditure |
18,555.45 |
16,377.80 |
16,847.82 |
16,109.23 |
14,891.93 |
|
EBIT |
525.33 |
450.52 |
476.62 |
510.58 |
421.39 |
|
|
|
|
|
|
|
|
Finance cost |
54.48 |
36.84 |
33.08 |
23.85 |
30.66 |
|
EBT before Share of Loss of Associate |
470.85 |
413.68 |
443.54 |
486.73 |
390.73 |
|
|
|
|
|
|
|
|
Share of Loss of Associate |
- |
- |
- |
- |
- |
|
PBT |
470.85 |
413.68 |
443.54 |
486.73 |
390.73 |
|
|
|
|
|
|
|
|
Tax Expenses |
78.94 |
87.34 |
87.97 |
89.67 |
67.64 |
|
PAT |
391.91 |
326.34 |
355.57 |
397.06 |
323.09 |
Business
-
In 1993, Redington Limited started doing business by marketing items for the information technology industry.
-
1995 saw the beginning of Redington's operations in Eastern India. That same year, the business also started distributing Compaq and Philips products. In the year 1996, the business began to distribute Intel products.
-
In the year 2007 the company’s shares got listed on NSE and BSE and in the same year, it commenced distribution of Apple products.
-
Throughout FY 19–20, the company made significant strides in its pivot toward being a solution-oriented distributor and strengthened its competencies in crucial new technologies, including cloud cybersecurity, the internet of things (IoT), artificial intelligence (AI), and machine learning (ML).
-
In 1997, the company formed a partnership with Microsoft for the marketing of software products. In 1998, the company also formed partnerships with IBM APC and Canon for the distribution of their products. The company has a wide network and strong relationships with over 290+ brand associations and servicing 43,000 + channel partners.
-
The company has been assigned AA+ long-term rating by ICRA/CRISIL.
-
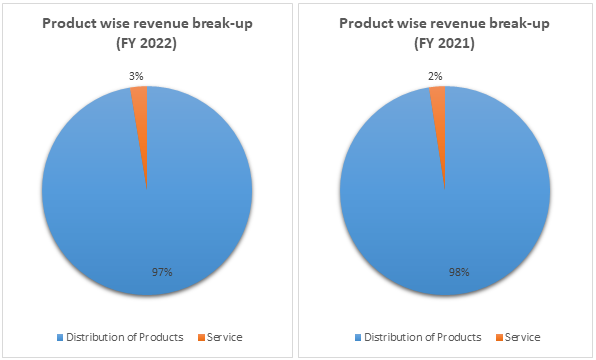
Out of the total revenue, 97% has been generated from Distribution Products and 3% from Services in FY 2022 compared to 98% and 2% in FY 2021, respectively.
-
-
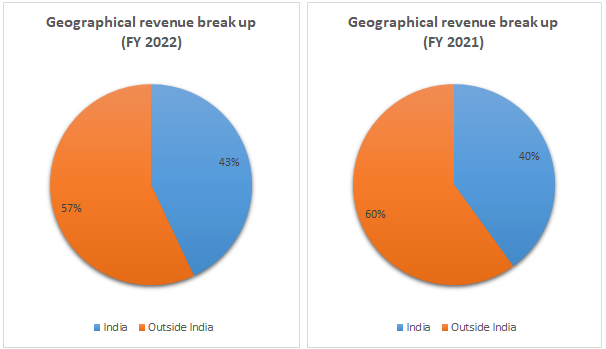
Geographically contribution from India was 43% and from Outside India was 57% in FY 2022 compared to 40% and 60% in FY 2021, respectively.
-
SWOT ANALYSIS
-
Strength
-
Strong product and service portfolio.
-
Strong Brand Value.
-
Long-term vendor relation.
-
Strong Financials.
-
Wide reach and superior logistics capabilities.
-
-
Weakness
-
Extra cost of building a new supply chain & Logistics Network.
-
Zero Promoters’ shareholding
-
High cost of goods sold.
-
-
Opportunity
-
Local collaboration.
-
Increasing customer base in the lower segment.
-
Increasing government regulations.
-
-
Threat.
-
Increasing global uncertainties.
-
Increase in competition.
-
Dependency on top five clients for revenue.
-
Company’s low market share in Non-IT Products.
-
Redington Limited - Ratio Analysis
|
|
Mar-19 |
Mar-20 |
Mar-21 |
Mar-22 |
|
Profitability Ratio |
|
|
|
|
|
Gross Profit |
5.99% |
5.57% |
5.69% |
6.19% |
|
EBITDA Margin |
2.07% |
2.08% |
2.53% |
3.00% |
|
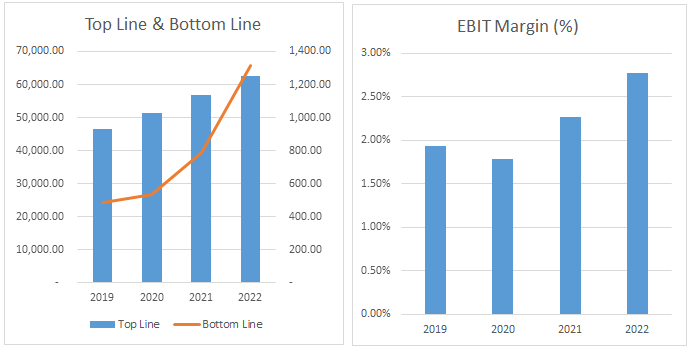
EBIT Margin |
1.93% |
1.78% |
2.27% |
2.77% |
|
Pre-Tax Margin |
1.49% |
1.35% |
1.99% |
2.59% |
|
Net Profit Margin |
1.09% |
1.00% |
1.33% |
2.04% |
|
|
|
|
|
|
|
Return on Investment |
|
|
|
|
|
Return on Asset – ROA |
4% |
4% |
5% |
8% |
|
Return on Capital Employed – ROCE |
22% |
20% |
24% |
29% |
|
Return on Equity – ROE |
12% |
12% |
15% |
22% |
|
|
|
|
|
|
|
Liquidity Ratio (x) |
|
|
|
|
|
Current ratio |
1.45 |
1.41 |
1.52 |
1.46 |
|
Quick Ratio |
0.97 |
1.03 |
1.20 |
1.09 |
|
|
|
|
|
|
|
Turnover Ratio |
|
|
|
|
|
Receivables Turnover |
48 |
47 |
44 |
43 |
|
Inventory Turnover |
29 |
28 |
22 |
20 |
|
Payables Turnover |
48 |
47 |
44 |
43 |
|
Asset Turnover |
4.00 |
3.80 |
3.90 |
3.80 |
|
|
|
|
|
|
|
Solvency Ratio |
|
|
|
|
|
Debt to Equity |
0.31 |
0.54 |
0.08 |
0.10 |
|
Interest Coverage Ratio |
4.40 |
4.18 |
8.25 |
15.04 |
Redington Limited - Financial Overview
Cash Flow Statement (₹ in crores)
|
|
Mar-19 |
Mar-20 |
Mar-21 |
Mar-22 |
|
Net Profit Before Tax |
484.47 |
533.92 |
788.50 |
1,314.87 |
|
Net Cash from Operating Activities |
1,068.44 |
965.65 |
3,496.89 |
989.20 |
|
Net Cash Used for Investing Activities |
-94.40 |
-57.54 |
-496.82 |
-56.52 |
|
Net Cash From (Used For) Financing Activities |
-650.69 |
443.26 |
-2,241.05 |
-476.11 |
|
Net Increase in Cash and Cash Equivalents |
323.35 |
1,351.37 |
759.02 |
456.57 |
|
Cash And Cash Equivalents at The Beginning of The Year |
492.09 |
816.11 |
2,279.30 |
2,925.26 |
|
Cash And Cash Equivalents at The End of the Year |
816.11 |
2,279.30 |
2,925.26 |
3,271.38 |
Redington Limited - Profit and Loss Statement (₹ in crores)
|
|
Mar-19 |
Mar-20 |
Mar-21 |
Mar-22 |
|
Revenue from Operations |
46,536.15 |
51,465.17 |
56,945.86 |
62,644.01 |
|
Other Income |
63.23 |
48.61 |
95.73 |
87.56 |
|
Total Income |
46,599.38 |
51,513.78 |
57,041.59 |
62,731.57 |
|
|
||||
|
Cost of Goods sold |
43,812.84 |
48,648.28 |
53,800.97 |
58,855.00 |
|
Gross Profit |
2,786.54 |
2,865.50 |
3,240.62 |
3,876.57 |
|
|
||||
|
Excise Duty |
- |
- |
- |
- |
|
Employee Benefits Expense |
724.20 |
783.78 |
831.98 |
885.66 |
|
Other Expenses |
1,100.43 |
1,010.30 |
969.53 |
1,111.68 |
|
EBITDA |
961.91 |
1,071.42 |
1,439.11 |
1,879.23 |
|
|
||||
|
Depreciation and Amortisation Expense |
63.36 |
155.40 |
148.20 |
141.28 |
|
EBIT |
898.55 |
916.02 |
1,290.91 |
1,737.95 |
|
|
||||
|
Finance Costs |
204.15 |
219.06 |
156.44 |
115.59 |
|
EBT before Exceptional Item |
694.40 |
696.96 |
1,134.47 |
1,622.36 |
|
|
||||
|
Exceptional Item |
-71.06 |
-4.68 |
-6.34 |
0.00 |
|
EBT |
623.34 |
692.28 |
1,128.13 |
1,622.36 |
|
|
||||
|
Tax Expense |
138.87 |
158.36 |
339.63 |
307.49 |
|
PAT before Non-controlling Interest |
484.47 |
533.92 |
788.50 |
1,314.87 |
|
Non-Controlling Interest |
-23.31 |
18.71 |
30.22 |
34.96 |
|
PAT |
507.78 |
515.21 |
758.28 |
1,279.91 |
|
|
||||
|
EPS |
||||
|
Basic |
12.8 |
13.24 |
9.74 |
16.40 |
|
Diluted |
12.8 |
13.24 |
9.72 |
16.39 |
|
|
||||
|
Number of Shares |
||||
|
Basic |
39.67 |
38.91 |
77.82 |
78.07 |
|
Diluted |
39.67 |
38.91 |
77.99 |
78.10 |
Redington Limited - Balance Sheet (₹ in crores)
|
|
Mar-19 |
Mar-20 |
Mar-21 |
Mar-22 |
|
ASSETS: |
|
|
|
|
|
Non-current assets: |
|
|
|
|
|
Property, plant and Equipment |
186.87 |
174.11 |
147.02 |
147.14 |
|
Capital work-in-progress |
7.56 |
0.06 |
0.29 |
84.83 |
|
Right of use assets |
- |
230.26 |
177.09 |
206.28 |
|
Goodwill |
22.03 |
18.38 |
18.30 |
61.70 |
|
Other Intangible assets |
245.40 |
291.67 |
262.37 |
284.96 |
|
Intangible assets under development |
30.27 |
11.41 |
0.65 |
0.56 |
|
Financial assets: |
||||
|
Other financial assets |
25.72 |
20.24 |
20.49 |
18.63 |
|
Deferred tax assets |
40.14 |
29.95 |
31.12 |
38.48 |
|
income tax assets |
105.12 |
147.93 |
115.71 |
105.08 |
|
Other Non-current assets |
89.02 |
78.56 |
80.77 |
101.85 |
|
Total Non-current assets |
752.13 |
1,002.57 |
853.81 |
1,049.51 |
|
|
||||
|
Current assets: |
||||
|
Inventories |
3,859.17 |
3,672.76 |
2,902.11 |
4,383.04 |
|
Financial assets: |
||||
|
Investments |
7.03 |
- |
- |
- |
|
Trade receivables |
6,278.56 |
7,032.00 |
6,800.67 |
8,675.16 |
|
Cash and cash equivalents |
866.64 |
2,343.54 |
2,938.58 |
3,289.54 |
|
Bank balance |
10.55 |
33.54 |
554.39 |
369.76 |
|
Loans |
44.00 |
2.00 |
- |
- |
|
Other financial assets |
264.22 |
199.67 |
198.80 |
226.89 |
|
Other current assets |
338.38 |
370.15 |
305.51 |
414.99 |
|
Total Current assets |
11,668.55 |
13,653.66 |
13,700.06 |
17,359.38 |
|
|
||||
|
Asset held for sale |
- |
- |
8.00 |
7.01 |
|
|
||||
|
Total Assets |
12,420.68 |
14,656.23 |
14,561.87 |
18,415.90 |
|
|
||||
|
EQUITY AND LIABILITIES: |
||||
|
Equity: |
||||
|
Share capital |
77.82 |
77.82 |
77.84 |
156.29 |
|
Other Equity |
3,828.16 |
4,231.03 |
4,860.67 |
5,628.66 |
|
Equity Attributable to Equity holders of the company |
3,905.98 |
4,308.85 |
4,938.51 |
5,784.95 |
|
|
||||
|
Non-controlling Interest |
344.67 |
381.27 |
372.97 |
322.75 |
|
Total Equity |
4,250.65 |
4,690.12 |
5,311.48 |
6,107.70 |
|
|
||||
|
Non-current liabilities: |
||||
|
Financial Liabilities: |
||||
|
Borrowings |
24.54 |
- |
4.56 |
90.14 |
|
Lease liabilities |
- |
164.53 |
122.41 |
138.25 |
|
Trade payables: |
||||
|
Total outstanding dues of micro and small enterprise |
- |
- |
- |
- |
|
Other creditors |
- |
- |
- |
6.99 |
|
Other financial Liabilities |
7.00 |
0.38 |
6.53 |
7.26 |
|
Provisions |
97.10 |
124.76 |
127.02 |
155.01 |
|
Deferred Tax Liabilities |
1.53 |
4.90 |
2.75 |
8.47 |
|
Total Non-current Liabilities |
130.17 |
294.57 |
263.27 |
406.12 |
|
|
||||
|
Current Liabilities: |
||||
|
Financial Liabilities: |
||||
|
Borrowings |
1,282.86 |
2,537.48 |
440.42 |
542.65 |
|
Lease liabilities |
- |
72.70 |
54.52 |
59.72 |
|
Trade payables: |
||||
|
Total outstanding dues of micro and small enterprise |
92.21 |
34.63 |
4.49 |
13.46 |
|
Other creditors |
5,812.65 |
6,240.52 |
7,295.46 |
10,140.74 |
|
Other financial liabilities |
204.00 |
184.79 |
222.13 |
210.40 |
|
Others Current liabilities |
598.03 |
486.94 |
803.32 |
741.98 |
|
Provisions |
17.67 |
20.94 |
24.40 |
26.54 |
|
Other tax liabilities |
32.44 |
93.54 |
142.38 |
166.59 |
|
Total Current Liabilities |
8,039.86 |
9,671.54 |
8,987.12 |
11,902.08 |
|
|
||||
|
Total Equity and Liabilities |
12,420.68 |
14,656.23 |
14,561.87 |
18,415.90 |
Indian Personal Computer and Mobility Industry Overview
-
According to International Data Corporation's (IDC) in Q2FY2023, the traditional PC market in India decreased by 11.7% year over year (YoY) in the three months ending September, reversing two years of continuous expansion driven by remote and hybrid work.
-
During Q2FY2023, India shipped 3.9 million PCs, including desktops, laptops, and workstations. 2.1 million units were shipped to the consumer market, with PC shipments declining 10.9% year over year (YoY) although showing some rise in September thanks to online sales.
-
PC orders are being placed in the government and educational sectors, which is anticipated to boost demand in the commercial segments during the next two quarters.
-
In India, demand for smartphones will rise at a CAGR of 6% in the rural market and a CAGR of 2.5% in the urban market, with a total of around 400 million devices expected to be sold by 2026.
-
The development of e-learning, fintech, and e-health platforms has increased the demand for internet services in the rural sector, which has fueled this trend. The government's ambition to fiberize all villages by 2025 under the BharatNet programme will provide internet-enabled products in the rural sector a boost.
-
By 2026, 310 million 5G devices will account for 80% (or all of the demand for smartphones).
-
Additionally, the PLI programmes and the recently announced incentive package worth US$10 billion to promote semiconductor manufacture in India will stimulate handset production in India to serve the second-largest smartphone market in the following five years.
Concall Overview (Q2FY2023)
-
In comparison to Q2FY2022, the company ended the second quarter of FY2023 with a 25% increase in revenue, a 23% increase in EBITDA, and a 26% increase in PAT. These are all impressive results that were backed up by outstanding business and geographic performance.
-
As a result of ongoing investments in enhancing technical competence, deepening partnerships with vendors and partners, and partnering with Tier 2 and Tier 3 partners, Redington achieved record revenue and operating margin during the second quarter of FY2023.
-
The company anticipates or predicts that there will continue to be a constricted demand environment in several categories in the future, Categories would be access products such as home PCs and printers for work-from-home and learn-from-home.
-
Categories like data centers, clouds, services, accessories, and some mobility products will experience growth. Therefore, notwithstanding whatever is happening in the globe from a geopolitical and financial standpoint, Management anticipates maintaining reasonable revenue and margins from recently adopted operating environment enhancements that the company has made for itself.
Redington Limited - Technical Analysis
-
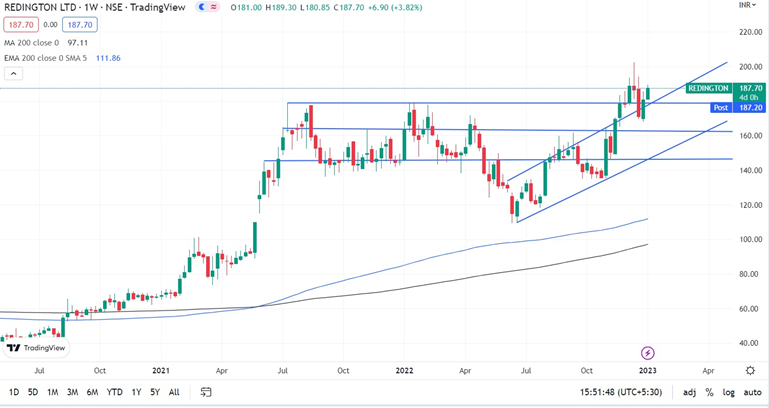
Stock is on a bullish trend on a monthly, weekly, and daily charts basis with a support level of ₹166 and a resistance level of ₹178.
-
One can accumulate this stock at current levels.
Recommendation Rationale
-
In its operating regions, which include India, the Middle East, Turkey, and Africa, Redington Limited is a sizable distributor of IT and mobile products.
-
A broad range of brands and a sizable product portfolio allow Redington Limited to maintain its market position despite shifting demand conditions.
-
In FY2022, Redington Limited's consolidated revenues increased by 10.0% YoY, helped by increases of 19% and 4% in the revenues from its domestic and international businesses, respectively. Due to advantageous scale economies, its operating and net margins increased to 3.0% and 2.1%, respectively, in FY2022. Given its broad range of products and solid relationships with both domestic and international suppliers, Redington Limited will maintain its excellent financial profile.
-
In both domestic and international markets, Redington Limited has over 200 vendors. In FY2022, its major suppliers—Apple, HP, Dell, Lenovo, and Samsung—contributed together to almost 64% of its revenues. With a 30% market share in FY2022, Apple has the largest percentage of vendors. The strong vendor ties help Redington Limited get favorable credit terms, which lowers the amount of operating capital it needs to maintain operations.
-
To reduce credit risks, Redington Limited upholds strict credit assessment standards and provisioning guidelines. It adheres to sensible methods for reducing the risks associated with foreign exchange fluctuations, such as hedging 100% of exchange rates.
Valuation
-
Redington Limited has shown revenue growth of 10% CAGR for FY2018-2022.
-
The company’s net profit has shown a growth of 28% CAGR for FY2018-2022.
-
The company’s ROE and ROCE are 22% & 29% for the FY2022.
-
We anticipate the company could generate higher revenue for the following FY 2023, comparable to the prior year, based on the company's present performance in FY 2022.
-
We used data from the last five years (2018-2022) to anticipate revenue for the fiscal years 2023–2027.
Estimated Income Statement (₹ in crores)
-
We initiate coverage on Redington Limited with a “Buy” and a 1-year Target Price of ₹254
Disclaimer: This report is only for the information of our customer’s Recommendations, opinions, or suggestions are given with the understanding that readers acting on this information assume all risks involved. The information provided herein is not to be construed as an offer to buy or sell securities of any kind.
- Share :


Post a Comment
|
DISCLAIMER |
This report is only for the information of our customers. Recommendations, opinions, or suggestions are given with the understanding that readers acting on this information assume all risks involved. The information provided herein is not to be construed as an offer to buy or sell securities of any kind. ATS and/or its group companies do not as assume any responsibility or liability resulting from the use of such information.