Visaka Industries Limited Research Report
|
Market Price |
Recommendation |
Target |
Time Horizon |
|
450.05 |
Buy |
635 |
1-Year |
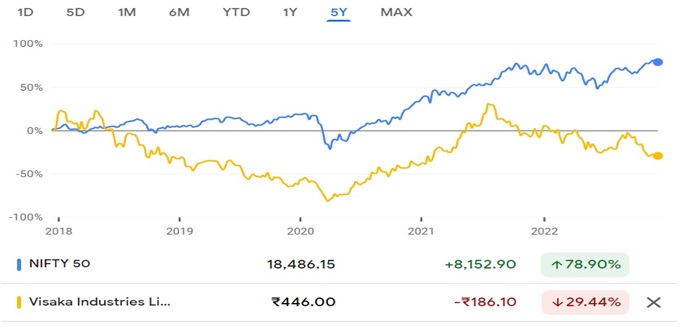
Visaka Industries Limited - Q2FY2023 Review
Visaka Industries Limited reported net revenue of ₹26,472.25 lakhs for the quarter ended September 30, 2022, compared to ₹29,242.89 lakhs for September 30, 2021. Profit After Tax was ₹737.56 lakhs for the quarter ended September 30, 2022, compared to ₹2,385.98 lakhs during the corresponding quarter of the previous year, respectively.
Visaka Industries Limited - Investment Summary
|
CMP (₹) |
450.05 |
|
52 Week H/L |
435/708 |
|
Market Cap (crores) |
777 |
|
Face Value (₹) |
10.00 |
|
Promoter Holding (%) |
48.36 |
|
Non-Promoter Holding (%) |
51.64 |
|
Total (%) |
100.00 |
|
Book Value |
₹190.82 |
|
EPS TTM |
₹46.29 |
Visaka Industries Limited - Overview
-
With effect from July 20, 2022, the company has started commercial production at its new panel unit (Panels Division - III), which is located in Udumalpet Village, Tirpur Dist., Tamilnadu, and has an installed capacity of 10,000 MT annually.
-
The production operations of the AC unit located at Patancheru at Sy No. 315, Yelumala (V), Hyderabad, Telangana will cease as of September 16, 2022 as part of Visaka Industries Ltd.'s strategic business strategy.
Beta: 1.07 |
Alpha: -9 |
Risk Reward Ratio: 1.80 |
Margin of Safety: 28% |
Visaka Industries Limited - Quarterly Summary
|
Quarterly (INR in lakhs) |
Sep-22 |
Jun-22 |
Mar-22 |
Dec-21 |
Sep-21 |
|
Revenue from Operations |
36,472.75 |
47,968.66 |
42,018.52 |
35,405.78 |
29,242.89 |
|
Other income |
222.45 |
270.20 |
263.13 |
308.64 |
204.00 |
|
Total Income |
36,695.20 |
48,238.86 |
42,281.65 |
35,714.42 |
29,446.89 |
|
|
|||||
|
Total Expenditure |
35,283.96 |
41,901.32 |
37,857.58 |
32,180.60 |
25,335.12 |
|
EBIT |
1,411.24 |
6,337.54 |
4,424.07 |
3,533.82 |
4,111.77 |
|
|
|||||
|
Finance cost |
396.91 |
1,149.30 |
338.59 |
243.51 |
900.53 |
|
EBT before Exceptional Items |
1,014.33 |
5,188.24 |
4,085.48 |
3,290.31 |
3,211.24 |
|
|
|||||
|
Exceptional Items |
- |
- |
- |
- |
- |
|
PBT |
1,014.33 |
5,188.24 |
4,085.48 |
3,290.31 |
3,211.24 |
|
|
|||||
|
Tax Expenses |
276.77 |
1,335.78 |
1,101.81 |
891.54 |
825.26 |
|
PAT |
737.56 |
3,852.46 |
2,983.67 |
2,398.77 |
2,385.98 |
Business
-
Incorporated in Hyderabad, Telangana, in 1981, Visaka Industries Limited was founded by Dr. G. Vivekanand, who is currently the Chairman.
-
Asbestos cement sheets (ACS), non-asbestos boards & panels, and synthetic fiber yarns are among the products made by the company.
-
The business of VIL is divided into two major verticals, Building Products (ACS & non-asbestos boards & panels) and Textiles (Synthetic fiber yarns).
-
With an installed capacity of 902,000 Metric Tonnes Per Annum (MTPA) across its eight manufacturing sites dispersed across eight states, the company is the second-largest participant in ACS manufacture in India.
-
In addition, VIL has three manufacturing facilities with a combined manufacturing capacity of 19,750 MTPA for panels and 2,20,000 MTPA for non-asbestos boards (branded as V-Next), in addition to 2,752 spinning positions for yarn at its factory in Nagpur, Maharashtra.
-
Around 15 countries receive the company's building materials (ACS and non-asbestos boards and panels), while 17 nations worldwide receive its synthetic yarns.
-
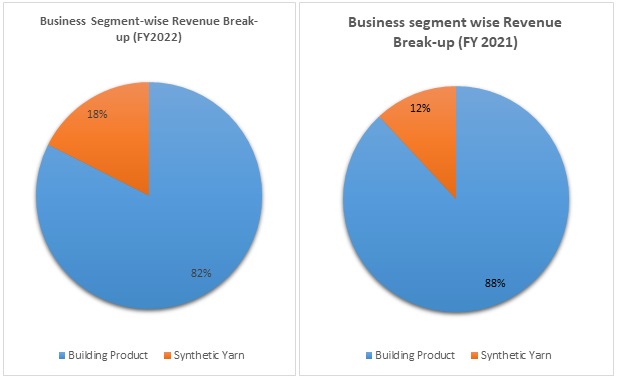
Out of the total revenue, 82% has been generated from Building Products and 18% from Synthetic Yarn in FY 2022 compared to 88% and 12% in FY 2021, respectively.
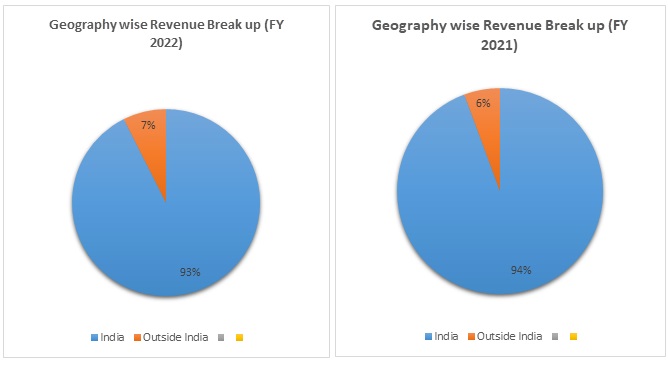
Revenue Trend
-
Geographically contribution from India was 93% and from Outside India was 7% in FY 2022 compared to 94% and 6% in FY 2021, respectively.
SWOT ANALYSIS
-
Strength
-
Diversified product portfolio.
-
Widespread marketing distribution network.
-
Annual profits improving for the last two years.
-
Company with low debt.
-
-
Weakness
-
Foreign exchange fluctuation risk.
-
Promoters’ shares are pledged.
-
Trading around a 52-week low.
-
Decline in quarterly net profit.
-
-
Opportunity
-
Capex plans for further diversification.
-
Improvement in the overall global scenario will help to improve revenue from the textile segment.
-
Improvement in construction activities.
-
-
Threat
-
An increase in the prices of raw materials could impact the profit of the company.
-
Increase in competition from unorganized players.
-
Regulatory and environmental issues concerning asbestos.
-
Ratio Analysis
|
|
Mar-19 |
Mar-20 |
Mar-21 |
Mar-22 |
|
Profitability Ratio |
|
|
|
|
|
Gross Profit |
52.46% |
51.77% |
55.03% |
53.32% |
|
EBITDA Margin |
13.70% |
11.00% |
17.62% |
14.82% |
|
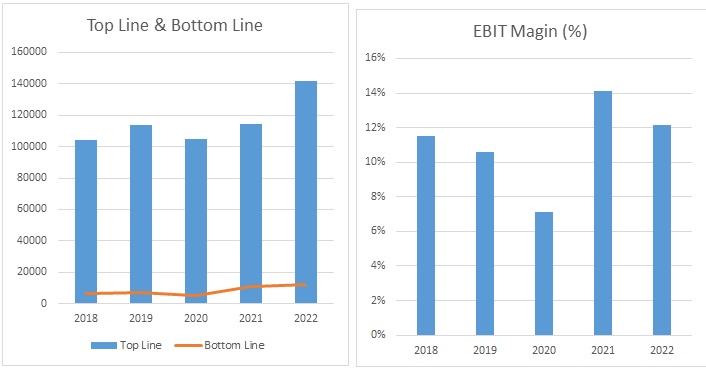
EBIT Margin |
10.59% |
7.10% |
14.14% |
12.16% |
|
Pre-Tax Margin |
8.83% |
5.44% |
13.02% |
11.34% |
|
Net Profit Margin |
5.93% |
4.69% |
9.65% |
8.36% |
|
|
|
|
|
|
|
Return on Investment |
|
|
|
|
|
Return on Asset – ROA |
7% |
5% |
12% |
11% |
|
Return on Capital Employed – ROCE |
21% |
12% |
25% |
23% |
|
Return on Equity – ROE |
14% |
10% |
20% |
17% |
|
|
|
|
|
|
|
Liquidity Ratio (x) |
|
|
|
|
|
Current ratio |
1.50 |
1.52 |
2.16 |
1.75 |
|
Quick Ratio |
0.67 |
0.62 |
1.09 |
0.81 |
|
|
|
|
|
|
|
Turnover Ratio |
|
|
|
|
|
Receivables Turnover |
7.4 |
7.1 |
9.4 |
11.9 |
|
Inventory Turnover |
2.1 |
1.8 |
1.9 |
2.5 |
|
Payables Turnover |
6.2 |
6.2 |
5.9 |
7.6 |
|
Asset Turnover |
1.3 |
1.1 |
1.2 |
1.4 |
|
|
||||
|
Solvency Ratio |
||||
|
Debt to Equity |
0.30 |
0.31 |
0.06 |
0.16 |
|
Interest Coverage Ratio |
6 |
4 |
13 |
15 |
Visaka Industries Limited - Financial Overview
Cash Flow Statement (₹ in lakhs)
|
|
Mar-19 |
Mar-20 |
Mar-21 |
Mar-22 |
|
Net Profit Before Tax |
10,034.50 |
5,711.66 |
14,925.57 |
16,059.03 |
|
Net Cash from Operating Activities |
7,090.59 |
7,403.23 |
29,425.83 |
5,419.32 |
|
Net Cash Used for Investing Activities |
-4,854.00 |
-3,429.20 |
-5,370.75 |
-17,101.65 |
|
Net Cash From (Used For) Financing Activities |
-2,566.19 |
-4,008.98 |
-14,575.88 |
2,999.34 |
|
Net Increase in Cash and Cash Equivalents |
-329.60 |
-34.95 |
9,479.20 |
-8,682.99 |
|
Cash And Cash Equivalents at The Beginning of The Year |
1,992.55 |
1,662.95 |
1,628.00 |
11,107.20 |
|
Cash And Cash Equivalents at The End of the Year |
1,662.95 |
1,628.00 |
11,107.20 |
2,424.21 |
Profit and Loss Statement (₹ in lakhs)
|
|
Mar-19 |
Mar-20 |
Mar-21 |
Mar-22 |
|
Revenue from Operations |
1,13,640.70 |
1,05,038.46 |
1,14,653.91 |
1,41,581.42 |
|
Other Income |
1,204.04 |
662.04 |
858.60 |
986.28 |
|
Total Income |
1,14,844.74 |
1,05,700.50 |
1,15,512.51 |
1,42,567.70 |
|
|
|
|
|
|
|
Cost of Goods sold |
55,232.44 |
51,321.83 |
52,421.88 |
67,073.88 |
|
Gross Profit |
59,612.30 |
54,378.67 |
63,090.63 |
75,493.82 |
|
|
|
|
|
|
|
Excise Duty |
- |
- |
- |
- |
|
Employee Benefits Expense |
10,815.87 |
11,602.21 |
12,012.12 |
13,222.89 |
|
Other Expenses |
33,231.16 |
31,227.45 |
30,872.55 |
41,294.59 |
|
EBITDA |
15,565.27 |
11,549.01 |
20,205.96 |
20,976.34 |
|
|
|
|
|
|
|
Depreciation and Amortisation Expense |
3,535.48 |
4,096.51 |
3,999.00 |
3,761.80 |
|
EBIT |
12,029.79 |
7,452.50 |
16,206.96 |
17,214.54 |
|
|
|
|
|
|
|
Finance Costs |
1,995.29 |
1,740.84 |
1,281.39 |
1,155.51 |
|
EBT |
10,034.50 |
5,711.66 |
14,925.57 |
16,059.03 |
|
|
|
|
|
|
|
Tax Expense |
3,293.79 |
782.16 |
3,861.30 |
4,226.61 |
|
PAT |
6,740.71 |
4,929.50 |
11,064.27 |
11,832.42 |
|
|
|
|
|
|
|
EPS |
|
|
|
|
|
Basic |
42.45 |
31.04 |
68.47 |
71.14 |
|
Diluted |
42.45 |
31.04 |
67.63 |
69.42 |
|
|
|
|
|
|
|
Number of Shares |
|
|
|
|
|
Basic |
158.81 |
158.81 |
161.59 |
166.32 |
|
Diluted |
158.81 |
158.81 |
163.59 |
170.44 |
Balance Sheet (₹ in lakhs)
|
|
Mar-19 |
Mar-20 |
Mar-21 |
Mar-22 |
|
ASSETS: |
|
|
|
|
|
Non-Current Assets: |
|
|
|
|
|
Property, Plant and Equipment |
41,826.91 |
40,600.60 |
39,617.22 |
46,052.14 |
|
Capital Work-in-Progress |
115.59 |
878.09 |
509.33 |
4,954.96 |
|
Intangible Assets |
38.46 |
- |
- |
- |
|
Finance Assets: |
||||
|
Investments |
- |
- |
- |
- |
|
Other Financial Assets |
45.46 |
34.90 |
107.90 |
108.02 |
|
Other Non-Current Assets |
1,364.84 |
1,470.64 |
4,309.45 |
4,785.77 |
|
Total Non-Current Assets |
43,391.26 |
42,984.23 |
44,543.90 |
55,900.89 |
|
|
||||
|
Current Assets: |
||||
|
Inventories |
27,243.94 |
30,392.65 |
24,926.70 |
29,378.46 |
|
Financial Assets: |
||||
|
Trade Receivables |
15,528.60 |
14,000.81 |
10,516.34 |
13,347.94 |
|
Cash and Cash Equivalents |
1,662.95 |
1,628.00 |
11,107.20 |
2,424.39 |
|
Other Bank Balances |
357.27 |
298.48 |
573.57 |
312.23 |
|
Loans |
- |
- |
- |
3,022.03 |
|
Other Financial Assets |
359.94 |
282.23 |
202.57 |
338.26 |
|
Current Tax Assets |
326.26 |
647.25 |
- |
- |
|
Other Current Assets |
3,741.11 |
4,118.05 |
3,019.76 |
6,172.53 |
|
Total Current Assets |
49,220.07 |
51,367.47 |
50,346.14 |
54,995.84 |
|
|
||||
|
Total Assets |
92,611.33 |
94,351.70 |
94,890.04 |
1,10,896.73 |
|
|
||||
|
EQUITY AND LIABILITIES: |
||||
|
Equity: |
||||
|
Equity Share Capital |
1,592.07 |
1,592.07 |
1,652.07 |
1,732.07 |
|
Other Equity |
48,357.94 |
48,909.42 |
61,039.75 |
71,478.41 |
|
Total Equity |
49,950.01 |
50,501.49 |
62,691.82 |
73,210.48 |
|
|
||||
|
Liabilities: |
||||
|
Non-Current Liabilities: |
||||
|
Financial Liabilities: |
||||
|
Borrowings |
7,788.14 |
8,573.42 |
7,650.44 |
4,902.96 |
|
Other Financial Liabilities |
39.52 |
21.70 |
13.66 |
12.28 |
|
Deferred Tax Liabilities |
2,001.70 |
1,417.76 |
1,270.33 |
1,282.90 |
|
Total Non-Current Liabilities |
9,829.36 |
10,012.88 |
8,934.43 |
6,198.14 |
|
|
||||
|
Current Liabilities: |
||||
|
Financial Liabilities: |
||||
|
Borrowings |
14,799.85 |
15,620.77 |
3,898.09 |
11,816.17 |
|
Trade Payables: |
||||
|
Total Outstanding Dues of Micro and Small Enterprises |
- |
19.31 |
36.35 |
204.57 |
|
Other Creditors |
7,924.60 |
8,500.98 |
9,255.10 |
8,406.18 |
|
Other Financial Liabilities |
6,187.15 |
6,265.51 |
4,058.42 |
4,549.54 |
|
Other Current Liabilities |
3,718.22 |
2,906.54 |
5,482.82 |
5,701.20 |
|
Provisions |
202.14 |
524.22 |
275.16 |
538.30 |
|
Current Tax Liabilities |
- |
- |
257.85 |
272.15 |
|
Total Current Liabilities |
32,831.96 |
33,837.33 |
23,263.79 |
31,488.11 |
|
|
||||
|
Total Equity & Liabilities |
92,611.33 |
94,351.70 |
94,890.04 |
1,10,896.73 |
Indian Fibre Products Cement Sector Overview
-
In India, fibre cement sheets have been used for a long time due to their great durability, weather resistance, and fire resistance.
-
'Dry construction' roofs have been widely used in the industrial sector for many years. This has stimulated increased demand for different kinds of sheets in manufacturing facilities throughout the nation, fueling the expansion of the Indian Fibre Cement Boards and Sheets Market.
-
Since corrugated roofing sheets have recurring folds on their surface, they are employed extensively in rural areas and offer enduring utility and strength due to their distinctive design.
-
They are stronger due to their corrugated design with ridges and grooves, and the wavy structure in small surface areas boosts strength.
-
By FY2027, it is anticipated that the market for India's fibre cement boards and sheets would have grown at a CAGR of more than 5%, Because of cement's flexible qualities, low cost, and longer life span compared to its alternatives, cement is now more popular than ever before, which has contributed to the market's growth.
-
Due to the strong GDP growth and rising government investments in infrastructure development, the industry is anticipated to expand at an excellent rate over the next five years.
-
The Indian government is promoting mass-market affordable housing, which is expanding the market for building supplies and, in turn, expanding the demand for boards and sheets made of fibre cement. Government initiatives like the Pradhan Mantri Awas Yojana (PMAY) and the availability of affordable home loans are aimed at promoting infrastructural growth throughout the nation.
Concall Overview (Q2FY2023)
-
Due to the steady demand for the products, the sales of all business segments increased in comparison to the same quarter last year.
-
The geopolitical context of the crisis between Russia and Ukraine has increased input costs across all dimensions and other charges have decreased the company's profitability. The battle has continued longer than anyone anticipated, and factors such as rising interest rates, rupee depreciation, and supply chain disruption throughout the segment have a more negative impact on margins.
-
The company started a new extra line at Rae Bareli in Q1FY2023, and it is currently running at more than 80% of capacity.
-
From ₹294.30 crores to ₹364.7 crores, the company's overall revenue for the September quarter increased by 24% year over year.
-
The company's current quarter EBITDA is ₹ 26.5 crores, and its PAT is 7.4 crores.
-
Building products income increased from ₹241 crores to ₹286 crores by 18%, while volume increased by 17%.
-
The yarn segment had a 50% increase in revenue, from ₹51 crores to ₹77 crores, and a 33% increase in volume for the quarter.
Visaka Industries Limited - Technical Analysis
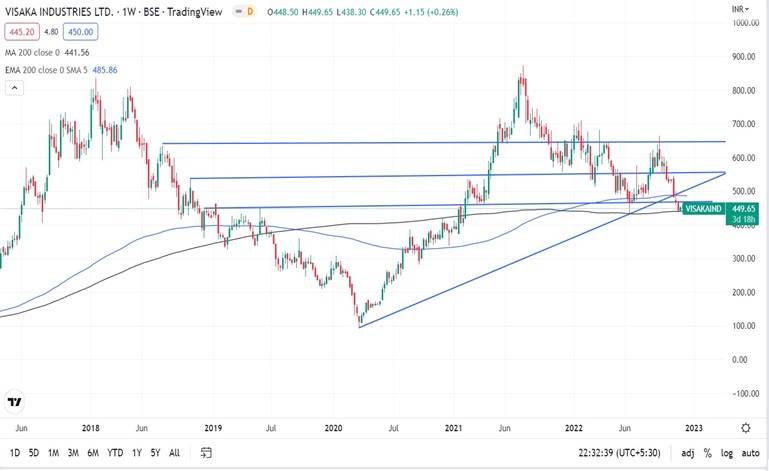
-
Stock is on a bullish trend on a monthly, weekly, and daily charts basis with a support level of ₹458 and a resistance level of ₹656.
-
One can accumulate this stock at current levels.
Recommendation Rationale
-
Asbestos cement sheets (ACS), non-asbestos boards and panels (V-Next products), and "ATUM," an integrated solar roofing product where solar panels are fused with the company's roofing V-boards, are all part of VIL's varied product portfolio. Furthermore, VIL operates in the textile industry, producing synthetic yarns such as mélange yarns, high twist yarn, and specialty yarns with various blend types.
-
The company has improved its operational performance in the last two years. The ACS segment's capacity utilization increased from 89% in FY21 to 96% in FY22. During FY22, the capacity utilization for the other segments also increased. Sales volume in the ACS segment increased by nearly 8%, which led to an increase in segment revenue of around 6%; nevertheless, price realization decreased slightly by 1.88% in FY22. Sales volume for non-asbestos panels and boards increased dramatically by 34%, and realization increased only a little by 2%–3%. Both the volume and profitability of the textile division grew significantly.
-
More than 7,000 dealers in urban, suburban, and rural areas make up VIL's extensive distribution network, and the company has depots in around 41 Indian cities. The company sells its goods all over India. The top players in the market serve various locations around the nation with little overlap because there aren't many organized participants in the segment.
-
All of the directors on the professional board that oversees VIL have a minimum of two decades of accumulated industry expertise.
-
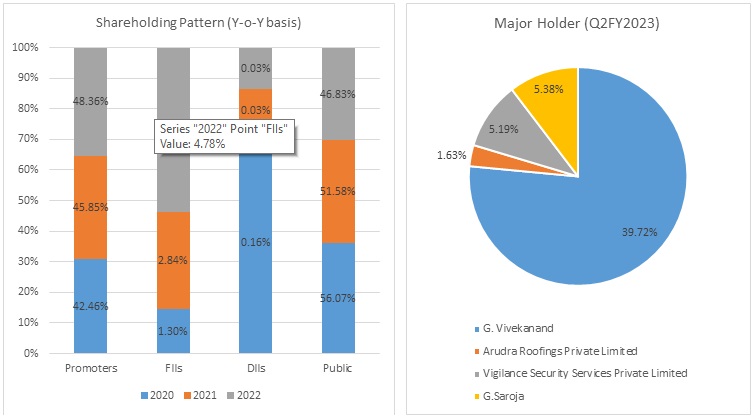
Promoters have increased their shareholding from 45.85% in Q2FY2022 to 48.36% in Q2FY202.
-
FIIs have increased their stake in Q2FY2023 by 0.02% to 4.53%.
-
DIIs increased their stake by 0.93% to 0.96% in Q2FY202
-
The company's liquidity is still solid, as evidenced by high cash accruals and minimal debt repayment obligations.
Valuation
-
Visaka Industries Limited has shown revenue growth of 8% CAGR for FY2018-2022.
-
The company’s net profit has shown a growth of 15% CAGR for FY2018-2022.
-
The company's recent quarters' net profit is impacted due to the ongoing Ukraine-Russia War due to which prices of the raw material are increased.
-
We anticipate the company could generate higher revenue for the following FY 2023, comparable to the prior year, based on the company's present performance in FY 2022.
-
We used data from the last five years (2018-2022) to anticipate revenue for the fiscal years 2023–2027.
Visaka Industries Limited - Estimated Income Statement (₹ in crores)
|
|
Mar-23 |
Mar-24 |
Mar-25 |
Mar-26 |
Mar-27 |
|
|
2023-E |
2024-E |
2025-E |
2026-E |
2027-E |
|
Revenue |
1,53,898.61 |
1,66,130.49 |
1,79,335.01 |
1,93,589.58 |
2,08,977.74 |
|
COGS |
82,519.40 |
89,066.03 |
96,132.03 |
1,03,758.61 |
1,11,990.24 |
|
Gross Profit |
71,379.21 |
77,064.46 |
83,202.99 |
89,830.98 |
96,987.51 |
|
Employee Expenses |
12,225.10 |
13,194.97 |
14,241.78 |
15,371.65 |
16,591.15 |
|
Other Expenses |
42,859.20 |
46,259.41 |
49,929.38 |
53,890.50 |
58,165.87 |
|
EBITDA |
16,294.91 |
17,610.08 |
19,031.83 |
20,568.83 |
22,230.49 |
|
Depreciation |
3,952.12 |
4,178.30 |
4,429.43 |
4,706.92 |
5,012.35 |
|
EBIT |
12,342.79 |
13,431.78 |
14,602.40 |
15,861.92 |
17,218.15 |
|
Financial Cost |
828.50 |
901.60 |
980.17 |
1,064.72 |
1,155.75 |
|
EBT |
11,514.29 |
12,530.18 |
13,622.23 |
14,797.20 |
16,062.39 |
|
Tax expenses |
2,878.57 |
3,132.54 |
3,405.56 |
3,699.30 |
4,015.60 |
|
PAT |
8,635.72 |
9,397.63 |
10,216.67 |
11,097.90 |
12,046.80 |
-
We initiate coverage on Visaka Industries Limited with a “Buy” and a 1-year Target Price of ₹635
Disclaimer: This report is only for the information of our customer’s Recommendations, opinions, or suggestions are given with the understanding that readers acting on this information assume all risks involved. The information provided herein is not to be construed as an offer to buy or sell securities of any kind.
- Share :


Post a Comment
|
DISCLAIMER |
This report is only for the information of our customers. Recommendations, opinions, or suggestions are given with the understanding that readers acting on this information assume all risks involved. The information provided herein is not to be construed as an offer to buy or sell securities of any kind. ATS and/or its group companies do not as assume any responsibility or liability resulting from the use of such information.