Acrysil Limited Research Report
|
Industry |
Market Price |
Recommendation |
Target |
Time Horizon |
|
Supplies & Fixture |
694 |
Buy |
955 |
1 year |
Q1 FY 2023 Review
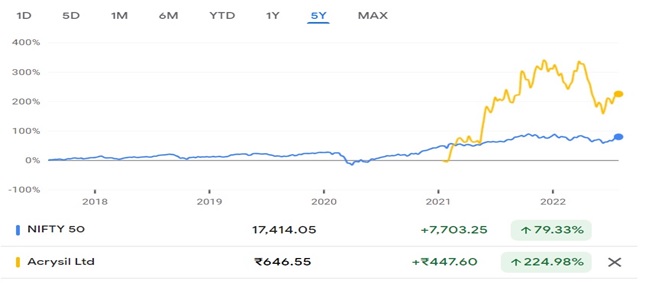
Acrysil Limited reported net revenue of ₹17,131.41 lakhs for the quarter ended June 30, 2022, compared to ₹9,754.96 lakhs for March 31, 2021. EBIT and Profit After Tax were ₹2,788.43 lakhs and ₹1,879.41 lakhs for the quarter ended June 30, 2022, as compared to ₹2,035.99 lakhs and ₹1,350.34 lakhs, during the corresponding quarter of the previous year.
Acrysil Limited - Investment Summary
|
CMP (₹) |
694 |
|
52 Week H/L |
468/927.30 |
|
Market Cap (crores) |
1,859 |
|
Face Value (₹) |
2.00 |
|
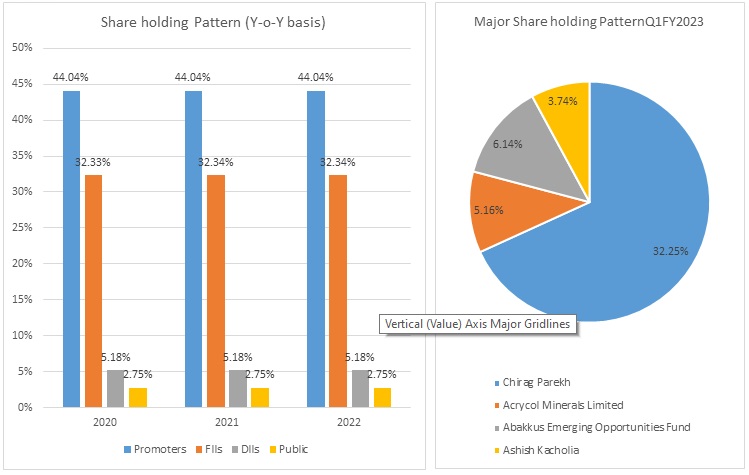
Promoter Holding (%) |
43.91 |
|
Non-Promoter Holding (%) |
56.09 |
|
Total (%) |
100.00 |
|
Book Value |
₹96.25 |
|
EPS TTM |
₹24.26 |
Overview
-
As on 05 July 2022, the company made an announcement regarding increase in dealer network from 1,500 to 1,880 over the last three months, which comprises of 25% expansion in dealer network PAN India. Further, the company plans to increase its dealer to 3,000 by the end of FY2023.
-
The company has increased its manufacturing capacity of Quartz Kitchen Sinks from 8,40,000 units to 10,00,000 units per annum.
-
The company has been assigned an A and A2+ credit rating on a long-term and short-term bank facility.
Beta: 0.64 |
Alpha: 29 |
Risk Reward Ratio: 1.95 |
Margin of Safety: 24% |
Acrysil Limited - Quarterly Summary
|
Quarterly (INR in lakhs) |
Jun-22 |
Mar-22 |
Dec-21 |
Sep-21 |
Jun-21 |
|
Revenue from Operations |
17,131.41 |
13,892.64 |
12,801.69 |
11,940.85 |
9,754.96 |
|
Other income |
13.03 |
219.44 |
222.02 |
290.89 |
274.34 |
|
Total Income |
17,144.44 |
14,112.08 |
13,023.71 |
12,231.74 |
10,029.30 |
|
|
|||||
|
Total Expenditure |
14,356.01 |
11,570.11 |
10,480.72 |
9,786.00 |
7,993.31 |
|
EBIT |
2,788.43 |
2,541.97 |
2,542.99 |
2,445.74 |
2,035.99 |
|
|
|||||
|
Finance cost |
296.33 |
341.31 |
226.36 |
198.89 |
192.08 |
|
EBT before Exceptional Items |
2,492.10 |
2,200.66 |
2,316.63 |
2,246.85 |
1,843.91 |
|
|
|||||
|
Exceptional Items |
0 |
- |
- |
- |
- |
|
EBT |
2,492.10 |
2,200.66 |
2,316.63 |
2,246.85 |
1,843.91 |
|
|
|||||
|
Tax Expenses |
612.69 |
546.74 |
576.88 |
465.21 |
493.77 |
|
PAT |
1,879.41 |
1,653.92 |
1,739.75 |
1,781.64 |
1,350.14 |
Business
-
Acrysil Limited is one of India's leading manufacturers and exporters of composite quartz granite kitchen sink.
-
The company offers granite and stainless-steel kitchen sinks under the brand name ‘Carysil.’
-
The company exports its products to more than 55 countries.
-
The company has 4 manufacturing plants with a combined capacity of 10,00,000 quartz kitchen sinks annually.
-
The company was incorporated in the year 1987.
-
The company formed a 100% export unit in the year 2004.
-
In 2014, the company started its first internal subsidiary in Germany ‘Acrysil GmbH’ and commenced the commercial production of stainless-steel units through its subsidiary ‘Acrysil Steel Private Limited.
-
Some of the company’s notable clients include BASF, Biocon, Reliance, Syngenta, Aarti Drugs, PI Industries, Atul, Lupin, and many more.
-
The company launched the ‘Sternhagen’ brand and state-of-the-art experience cum showroom in Ahmedabad & Mumbai in 2017.
-
Acrysil Limited incorporated the wholly owned subsidiary ‘Acrysil Ceramictech Limited’ on 8 April 2022, with an intention to sell ceramic kitchen sinks and bath products.
-
The company’s product portfolio is broadly divided into two parts:
-
Kitchen Segment:
-
Sinks:
-
The only company in Asia and among the few companies worldwide manufacturing quartz kitchen sink according to global standards.
-
Developed more than 150 models to cater to various segments and markets.
-
The brand is available in more than 1880 outlets.
-
Stainless steel sinks have a production capacity of 90,000 sinks per annum.
-
-
Kitchen Appliances:
-
The product portfolio includes chimneys, dishwashers, cooktops, ovens, wine chillers, hoods, cooking ranges, and microwave ovens.
-
-
-
Bath Segment:
-
The product portfolio includes premium sanitary ware, fittings, and highlights tiles.
-
The products are sold under the brand name ‘Sternhagen.’
-
It has received many international awards, including the prestigious Red Dot award.
-
-
-
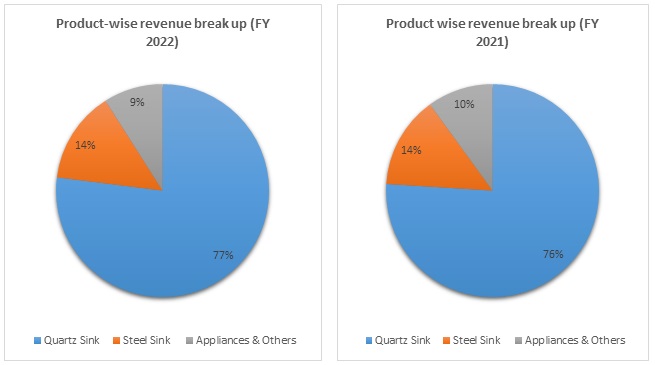
Out of the total revenue, 77% of revenue have generated from Quartz Sink, 14% from Steel Sink, and 9% from Appliances & others in FY 2022, compared to 76%, 14%, and 10% in FY 2021.
-
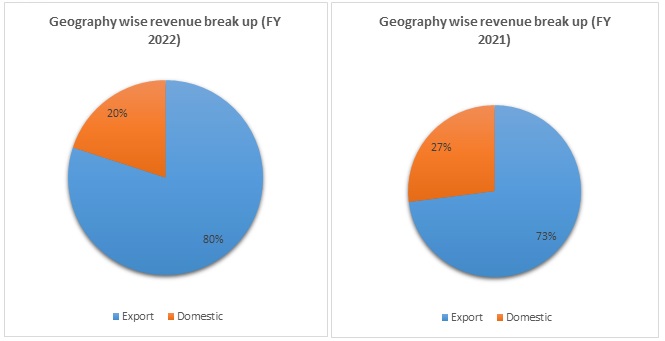
Out of the total revenue, 80% of revenue have generated from exports and 20% from Domestic in FY 2022, compared to 73% and 27% in FY 2021.
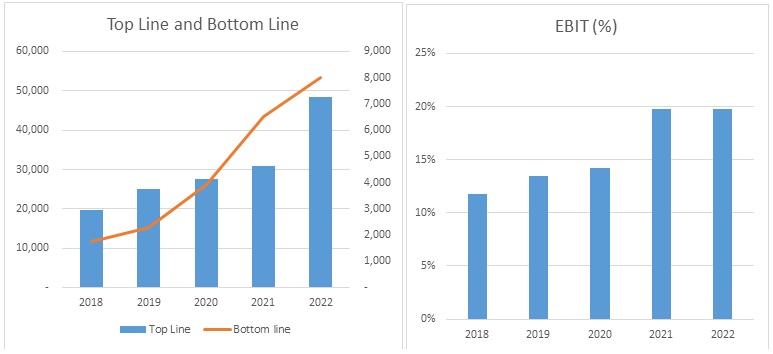
Acrysil Limited - Revenue Trend
Acrysil Limited - Ratio Analysis
|
|
Mar-19 |
Mar-20 |
Mar-21 |
Mar-22 |
|
Profitability Ratio |
|
|
|
|
|
Gross Profit |
49% |
52% |
57% |
59% |
|
EBITDA Margin |
17% |
19% |
24% |
23% |
|
EBIT Margin |
13% |
14% |
20% |
20% |
|
Pre-Tax Margin |
10% |
11% |
17% |
18% |
|
Net Profit Margin |
7% |
8% |
13% |
13% |
|
|
|
|
|
|
|
Return on Investment |
|
|
|
|
|
Return on Asset – ROA |
6.35% |
7.43% |
10.99% |
13.82% |
|
Return on Capital Employed – ROCE |
22.86% |
23.04% |
29.87% |
35.72% |
|
Return on Equity – ROE |
13.92% |
15.73% |
22.52% |
29.32% |
|
|
|
|
|
|
|
Liquidity Ratio |
|
|
|
|
|
Current ratio (x) |
1.31 |
1.54 |
2.62 |
3.06 |
|
Quick Ratio |
0.85 |
1.02 |
1.93 |
2.28 |
|
|
|
|
|
|
|
Turnover Ratio |
|
|
|
|
|
Receivables Turnover |
4.91 |
4.74 |
4.26 |
5.28 |
|
Inventory Turnover |
2.54 |
2.42 |
2.48 |
2.64 |
|
Payables Turnover |
4.51 |
6.07 |
5.30 |
4.42 |
|
Asset Turnover |
0.91 |
0.90 |
0.87 |
1.02 |
|
|
|
|
|
|
|
Solvency Ratio |
|
|
|
|
|
Debt to Equity |
0.12 |
0.13 |
0.11 |
0.15 |
|
Interest Coverage Ratio |
3.49 |
4.49 |
8.37 |
9.98 |
Acrysil Limited - Financial Overview
Acrysil Limited - Profit and Loss Statement (₹ in lakhs)
|
|
Mar-19 |
Mar-20 |
Mar-21 |
Mar-22 |
|
Revenue from Operations |
25,159.87 |
27,623.19 |
30,971.66 |
48,390.14 |
|
Other Income |
213.36 |
472.80 |
800.55 |
1,006.69 |
|
Total Income |
25,373.23 |
28,095.99 |
31,772.21 |
49,396.83 |
|
|
||||
|
Cost of Goods sold |
12,927.59 |
13,737.26 |
14,175.87 |
20,945.77 |
|
Gross Profit |
12,445.64 |
14,358.73 |
17,596.34 |
28,451.06 |
|
|
||||
|
Excise Duty |
- |
- |
- |
- |
|
Employee Benefits Expense |
1,851.65 |
2,219.63 |
2,224.13 |
3,358.86 |
|
Other Expenses |
6,336.54 |
7,026.18 |
7,992.36 |
13,753.19 |
|
EBITDA |
4,257.45 |
5,112.92 |
7,379.85 |
11,339.01 |
|
|
||||
|
Depreciation and Amortisation Expense |
863.91 |
1,192.50 |
1,266.43 |
1,772.32 |
|
EBIT |
3,393.54 |
3,920.42 |
6,113.42 |
9,566.69 |
|
|
||||
|
Finance Costs |
972.85 |
872.23 |
730.21 |
958.64 |
|
EBT before Exceptional Items |
2,420.69 |
3,048.19 |
5,383.21 |
8,608.05 |
|
|
||||
|
Exceptional Items |
- |
- |
- |
- |
|
EBT |
2,420.69 |
3,048.19 |
5,383.21 |
8,608.05 |
|
|
||||
|
Tax Expense |
672.48 |
761.98 |
1,451.45 |
2,082.40 |
|
PAT Before Non-Controlling Interest |
1,748.21 |
2,286.21 |
3,931.76 |
6,525.65 |
|
|
||||
|
Non-Controlling Interest |
23.41 |
78.67 |
19.54 |
49.47 |
|
PAT |
1,724.80 |
2,207.54 |
3,912.22 |
6,476.18 |
|
|
||||
|
EPS |
||||
|
Basic |
6.64 |
8.38 |
14.66 |
24.26 |
|
Diluted |
6.64 |
8.38 |
14.66 |
24.26 |
|
|
||||
|
Number of Shares |
||||
|
Basic |
259.65 |
263.32 |
266.95 |
266.95 |
|
Diluted |
259.65 |
263.32 |
266.95 |
266.95 |
Acrysil Limited - Cash Flow Statement (₹ in lakhs)
|
|
Mar-19 |
Mar-20 |
Mar-21 |
Mar-22 |
|
Net Profit Before Tax |
1,748.21 |
2,286.21 |
3,931.76 |
6,525.65 |
|
Net Cash from Operating Activities |
2,368.08 |
3,011.84 |
4,541.93 |
5,164.00 |
|
Net Cash Used for Investing Activities |
(1,722.23) |
(1,946.83) |
(3,475.91) |
(7,250.62) |
|
Net Cash From (Used For) Financing Activities |
(426.78) |
(987.41) |
(884.54) |
1,840.73 |
|
Net Increase in Cash and Cash Equivalents |
219.07 |
77.60 |
181.48 |
(245.89) |
|
Cash And Cash Equivalents at The Beginning of The Year |
295.41 |
514.48 |
592.08 |
773.56 |
|
Cash And Cash Equivalents at The End of the Year |
514.48 |
592.08 |
773.56 |
527.67 |
Acrysil Limited - Balance Sheet (₹ in lakhs)
|
|
Mar-19 |
Mar-20 |
Mar-21 |
Mar-22 |
|
ASSETS: |
|
|
|
|
|
Non-Current Assets: |
|
|
|
|
|
Property, Plant, and Equipment |
9,415.70 |
9,778.91 |
12,117.99 |
16,833.60 |
|
Right of Use Assets |
- |
142.12 |
495.16 |
1,226.54 |
|
Capital Work-in-Progress |
350.41 |
908.87 |
1,001.32 |
2,074.55 |
|
Goodwill |
2,350.31 |
2,391.77 |
2,391.77 |
2,391.77 |
|
Other Intangible Assets |
181.79 |
171.29 |
185.45 |
179.96 |
|
Finance Assets: |
||||
|
Investments |
- |
- |
- |
- |
|
Loans |
- |
- |
- |
- |
|
Other Non-Current Financial Assets |
167.75 |
148.81 |
122.95 |
157.54 |
|
Other Non-Current Assets |
202.91 |
338.77 |
714.68 |
1,711.35 |
|
Total Non-Current Assets |
12,668.87 |
13,880.54 |
17,029.32 |
24,575.31 |
|
|
||||
|
Current Assets: |
||||
|
Inventories |
5,369.76 |
5,974.40 |
5,455.10 |
10,422.80 |
|
Financial Assets: |
||||
|
Trade Receivables |
5,432.13 |
6,226.85 |
8,302.13 |
10,037.34 |
|
Cash and Cash Equivalents |
514.46 |
592.06 |
773.53 |
527.65 |
|
Other Bank Balances |
884.28 |
1,360.94 |
1,239.55 |
607.10 |
|
Loans |
7.30 |
10.01 |
13.23 |
15.15 |
|
Other Current Financial Assets |
941.17 |
1,055.09 |
1,732.45 |
1,264.46 |
|
Current Tax Assets |
1,520.73 |
2,070.05 |
2,901.77 |
4,593.08 |
|
Other Current Assets |
1,724.29 |
1,283.16 |
1,670.44 |
3,290.34 |
|
Total Current Assets |
16,394.12 |
18,572.56 |
22,088.20 |
30,757.92 |
|
|
||||
|
Total Assets |
29,062.99 |
32,453.10 |
39,117.52 |
55,333.23 |
|
|
||||
|
EQUITY AND LIABILITIES: |
||||
|
Equity: |
||||
|
Equity Share Capital |
518.90 |
533.90 |
533.90 |
533.90 |
|
Other Equity |
12,765.18 |
15,247.26 |
18,607.56 |
24,835.55 |
|
Equity Attributable to Owners of the Company |
13,284.08 |
15,781.16 |
19,141.46 |
25,369.45 |
|
|
||||
|
Non-Controlling Interests |
157.87 |
236.46 |
256.00 |
324.26 |
|
Money Received Against Share Warrants |
206.25 |
- |
- |
- |
|
Total Equity |
13,648.20 |
16,017.62 |
19,397.46 |
25,693.71 |
|
|
||||
|
Liabilities: |
||||
|
Non-Current Liabilities: |
||||
|
Financial Liabilities: |
||||
|
Borrowings |
1,656.50 |
2,121.38 |
2,170.64 |
3,857.80 |
|
Lease Liabilities |
- |
48.43 |
458.33 |
981.76 |
|
Provisions |
41.70 |
57.12 |
68.71 |
75.51 |
|
Deferred Tax Liabilities |
248.79 |
198.81 |
397.67 |
462.27 |
|
Total Non-Current Liabilities |
1,946.99 |
2,425.74 |
3,095.35 |
5,377.34 |
|
|
||||
|
Current Liabilities: |
||||
|
Borrowings |
6,819.71 |
6,836.18 |
7,958.07 |
9,867.97 |
|
Trade Payables: |
||||
|
Total Outstanding Dues of Micro and Small Enterprises |
789.07 |
707.59 |
1,024.29 |
1,616.21 |
|
Other Creditors |
2,334.41 |
2,193.36 |
3,153.26 |
6,324.36 |
|
Other Financial Liabilities |
1,394.34 |
1,406.72 |
324.25 |
322.64 |
|
Lease Liabilities |
- |
- |
97.93 |
295.71 |
|
Other Current Liabilities |
409.89 |
446.13 |
785.62 |
689.34 |
|
Provisions |
34.44 |
75.86 |
102.88 |
162.96 |
|
Current Tax Liabilities |
1,685.94 |
2,343.90 |
3,178.41 |
4,982.99 |
|
Total Current Liabilities |
13,467.80 |
14,009.74 |
16,624.71 |
24,262.18 |
|
|
||||
|
Total Equity & Liabilities |
29,062.99 |
32,453.10 |
39,117.52 |
55,333.23 |
Industry Overview
-
Kitchen Appliances:
-
The Kitchen Appliances market is predicted to grow at a CAGR of 12% during FY 2020-2027.
-
Kitchen Appliances are commonly utilized in households and commercial kitchens for storing, cleaning, and cooking.
-
This includes various types of tools and equipment that are operated using cooking fuel, electricity, and solar energy.
-
The market in India is primarily driven by the growing preference for modern kitchen appliances among individuals. This is supported by increased disposable income levels of the masses and growing awareness regarding the benefits of utilizing various kitchen appliances.
-
Technological advancements and the introduction of smart and energy-efficient kitchen appliances are gaining widespread prominence among the masses.
-
The leading players' growing investments in the creation of aggressive marketing strategies and celebrity endorsements are another factor driving the industry.
-
-
Real Estate:
-
The United Nations forecasts that India will have over 50% of India’s population living in cities by 2046.
-
Real Estate contributed nearly 6% to GDP in 2017. As per the projected growth trends during the pre-covid 19 eras, the sector’s contribution was likely to rise to 13% of India’s GDP by 2025.
-
-
Global Sinks Market:
-
The global market for kitchen sinks was valued at USD 3.2 million in 2022-2023 and is estimated to witness a CAGR of 4.5% over 2022-2030.
-
The rise in the number of households in various countries, the expansion of hotels and restaurants worldwide, and rising consumer income are all contributing to the market’s growth.
-
Concall Overview (Q4FY2022)
-
The quarter of FY 2022 was impacted by an increase in raw material prices, elevated freight costs, and other geopolitical issues. Despite these issues, the company had strong momentum in demand for home product, especially the Quartz Kitchen Sink.
-
The total dividend for FY 2021-22 amounted to ₹2.4 per equity share.
-
Acrysil UK Limited, a wholly owned subsidiary of Acrysil Limited, has acquired 100% share in Tickford Limited.
-
The expansion plan of 1,60,000 quartz sinks is progressing as per the schedule and is expected to be completed by Q1FY2023. This will take quartz manufacturing from 8,40,000 sinks to 10,00,000 sinks per annum. The further expansion of 2,00,000 units in quartz kitchen sinks is expected to be complete by Q3FY2023.
-
The supply of kitchen sinks to IKEA is expected to double by FY 2022.
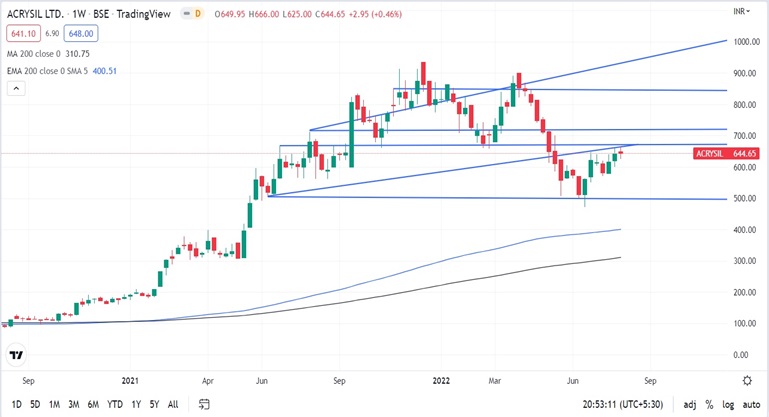
Acrysil Limited - Technical Analysis
-
Stock is trading above EMA 200 and MA 200 indicators, with a strong support level of ₹676 and a resistance level at ₹850.
-
One can accumulate this share at the current price.
Recommendation Rationale:
-
In FY 2022, Acrysil Limited’s revenue increased by 56.24% to ₹48,390.14 lakhs, compared to the previous year at ₹30,391.66 lakhs. Profit After Tax increased by 65.97% to ₹6,525 lakhs compared to the last year at ₹3,931 lakhs.
-
Extensive experience of promoters in the kitchen sink industry, apart from their established relationships with suppliers and customers, is expected to support the business profile.
-
The company has diversified into various products such as granite and stainless-steel kitchen sinks and the bath segment. It also trades in kitchen appliances. Product diversification will help the company to improve its operational efficiency and mitigate risk.
-
Healthy improvement in financials of the company.
-
The company has negligible debt.
-
Aggressive expansion plans to double the capacity of quartz sinks kitchen by FY 2023 by increasing its manufacturing capacity from 5,00,000 units to 12,00,000 units per annum.
-
The liquidity position of Acrysil Limited remains adequate since cash accruals are expected to stay more than adequate to cover the debt repayments.
-
The company will continue to maintain a strong business position in the granite-based kitchen sink industry and will benefit from the rising penetration of granite-based sinks in the domestic as well as continuing demand from export.
Valuation
-
The company’s revenue has increased at a CAGR of 25% from FY 2018-2022.
-
The company can sustain healthy revenue growth and profit margins on a consolidated basis, backed by a diversified product portfolio.
-
The company’s ROE and ROCE are 29.32% and 35.72%.
-
The company could face challenges like volatility in prices of raw materials, fluctuation in foreign exchange, and geopolitical tension.
-
We have taken data for the last five years (2018-2022) and forecasted revenue for FY 2023-2027. Revenue growth is assumed to be 25%.
Acrysil Limited - Estimated Income Statement (₹ in lakhs):
|
|
Mar-23 |
Mar-24 |
Mar-25 |
Mar-26 |
Mar-27 |
|
|
2023-E |
2024-E |
2025-E |
2026-E |
2027-E |
|
Revenue |
61,678.11 |
77,053.36 |
96,304.09 |
1,20,409.34 |
1,50,595.53 |
|
COGS |
26,993.25 |
33,815.98 |
42,363.21 |
53,070.80 |
66,484.82 |
|
Gross Profit |
34,684.86 |
43,237.37 |
53,940.89 |
67,338.53 |
84,110.71 |
|
Employee Expenses |
4,280.57 |
5,362.52 |
6,717.93 |
8,415.93 |
10,543.12 |
|
Other Expenses |
16,436.46 |
20,590.89 |
25,795.38 |
32,315.34 |
40,483.26 |
|
EBITDA |
13,967.83 |
17,283.97 |
21,427.58 |
26,607.26 |
33,084.33 |
|
Depreciation |
2,088.70 |
2,414.20 |
2,841.50 |
3,394.44 |
4,103.09 |
|
EBIT |
11,879.12 |
14,869.77 |
18,586.08 |
23,212.82 |
28,981.24 |
|
Financial Cost |
1,190.36 |
1,490.04 |
1,862.44 |
2,326.06 |
2,904.10 |
|
EBT |
10,688.76 |
13,379.73 |
16,723.65 |
20,886.76 |
26,077.15 |
|
Tax expenses |
2,672.19 |
3,344.93 |
4,180.91 |
5,221.69 |
6,519.29 |
|
PAT |
8,016.57 |
10,034.80 |
12,542.74 |
15,665.07 |
19,557.86 |
-
We initiate coverage on Acrysil Limited with a “BUY” and a 1-year Target Price of ₹955
Disclaimer: This report is only for the information of our customers. Recommendations, opinions, or suggestions are given with the understanding that readers acting on this information assume all risks involved. The information provided herein is not to be construed as an offer to buy or sell securities of any kind.
- Share :


Post a Comment
|
DISCLAIMER |
This report is only for the information of our customers. Recommendations, opinions, or suggestions are given with the understanding that readers acting on this information assume all risks involved. The information provided herein is not to be construed as an offer to buy or sell securities of any kind. ATS and/or its group companies do not as assume any responsibility or liability resulting from the use of such information.