ASIAN PAINTS LIMITED
Asian Paints Limited - Company Profile
Establishes in 1942, Asian Paints Limited manufactures paints in the decorative and industrial segments. APL is India’s largest and Asia’s third largest paint company and operates in the geographies of Asia, Middle East, Caribbean and South Pacific islands through its subsidiaries and joint ventures. It has presence in 17 countries with 25 paint manufacturing facilities. It operates in five regions across the world viz. South Asia, South East Asia, South Pacific, Middle East and Caribbean region through the five corporate brands viz. Asian Paints, Berger International, SCIB Paints, Apco Coatings and Taubmans.
The Indian paint industry is currently estimated at Rs. 16,000 crore and is expected to grow between 12-15% per annum over the next 5 years. Asian Paints dominates the Indian paints industry with about 33% market share.
Asian Paints Limited - STOCK INFORMATION
|
STOCK PRICE |
663.25 |
|
TARGET PRICE |
675-695 |
|
SECTOR |
PAINTS/VARNISHES |
|
SYMBOL (AT NSE) |
ASIANPAINT |
|
ISIN |
INE021A01026 |
|
FACE VALUE (IN RS.) |
1.00 |
|
BSE CODE |
500820 |
Asian Paints Limited - STOCK FUNDAMENTALS
|
MARKET CAP |
63,637.98 |
|
BOOK VALUE |
37.54 |
|
EPS - (TTM) (IN RS. CR.) |
12.45 |
|
P/E |
53.29 |
|
INDUSTRY P/E |
51.96 |
INVESTMENT RATIONALE
Asian Paints Q1FY15 consolidated revenues were bang in line with estimates and beat PAT expectations. Key high- lights are: 1) Revenues at Rs 33.6bn, up 18.3% yoy led by healthy growth in domestic business as well as international subsidiaries, 2) EBITDA at Rs 5.6bn, up 20% yoy, in line with estimates. EBITDA margins improve 20bps yoy to16.6%, despite gross margin decline of 60bps yoy to 42.6%, 3) APAT growth at 32% yoy to Rs 3.6bn, led by higher other income. Growth in Industrial & Automotive JV is back – Industrial operations reported healthy volume performance led by general industrial and refinish segment in Automotive JV and Industrial liquid paints and Road making segment in Industrial Coatings JV. Expanding capacities in domestic operations – Company has earmarked Rs 5bncapex for FY15E, by doubling Rohtak capacity from 200000 tons to 400000 tons and Ankleshwar capacity by 30000 tones, thereby taking its total capacity to 1mn tons.
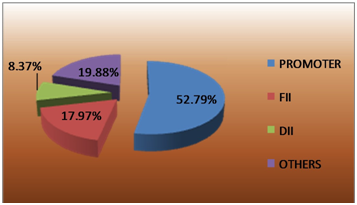
Asian Paints Limited - SHAREHOLDING PATTERN
Asian Paints Limited - OUTLOOK & VALUTION
Decorative business volumes grew in healthy double digit, while industrial and autocoating business also witnessed growth revival. Company is expanding its business horizon beyond coatings by venturing deeper into other home décor categories. We expect growth momentum to sustain and remain positive on strong category dynamics i.e. 1) limited players and 2) market leader’s ability to increase prices. Retain BUY with revised price target of Rs750/Share in six month to one year horizon and 695 in short term (weekly).
RESULTS (Quarterly )(Rs CR.)
|
|
Jun' 14 |
Mar' 13 |
Dec' 13 |
Sep' 13 |
Jun 13 |
|
Sales |
2,740.73 |
2,724.04 |
2,843.01 |
2,532.03 |
2,319.68 |
|
Operating profit |
489.56 |
423.93 |
477.72 |
456.40 |
419.20 |
|
Interest |
4.26 |
8.78 |
6.39 |
6.15 |
4.76 |
|
Gross profit |
534.22 |
454.18 |
506.04 |
498.08 |
466.56 |
|
EPS (Rs) |
3.22 |
2.78 |
3.21 |
3.24 |
2.9 |
TECHNICAL VIEW
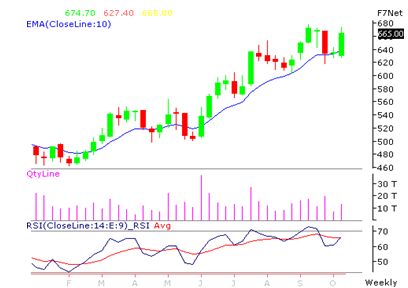
ASIAN PAINTS has closed above previous resistance at 650 and is having good support around 635-640 zones, may not break below this in short term. We advise to buy around 650-660 with stoploss of 630 for the targets of 675- 695 levels. RSI is also showing upside momentum in it on weekly charts.
|
SYMBOL |
VALUE |
ACTION |
|
RSI(14) |
65.618 |
BUY |
|
STOCH(9,6) |
77.615 |
BUY |
|
STOCHRSI(14) |
19.120 |
OVERSOLD |
|
MACD(12,26) |
-5.590 |
SELL |
|
ADX(14) |
33.681 |
BUY |
|
WILLIAMS %R |
-33.621 |
BUY |
|
CCI(14) |
66.1196 |
BUY |
|
ATR(14) |
5.6179 |
HIGH VOLATILITY |
|
HIGH/LOWS(14) |
2.9107 |
BUY |
|
ULTIMATE OSCILLATOR |
64.364 |
BUY |
|
ROC |
2.981 |
BUY |
|
BULL/BEAR POWER()13 |
9.2080 |
BUY |
|
BUY: 9 SELL:1 NEUTRAL: 3 |
SUMMARY : STRONG BUY |
Our Other Recommendation for Next Week
|
SCRIP |
ACTION |
CMP |
ENTRY |
SL |
TGT |
TIME FRAME |
|
RECL |
BUY |
252.10 |
250-252 |
245 |
256-262 |
ONE WEEK |
|
HCL TECH |
BUY |
1740.10 |
1740-1750 |
1710 |
1770-1790 |
ONE WEEK |
|
M&M FINANCE |
BUY |
284.90 |
282-285 |
276 |
292-298 |
ONE WEEK |
|
BAJAJ ELECTRICALS |
BUY |
277.75 |
272-278 |
260 |
288-296 |
ONE WEEK |
|
INFOSYS |
BUY |
3878.30 |
3850-3875 |
3790 |
3920-3960 |
ONE WEEK |
Performance of Previous Week
|
SCRIP |
LOT |
ACTION |
ENTRY |
SL |
TGT |
P&L |
REMARK |
CLOSE/LOW/HIGH |
|
BATA INDIA |
250 |
BUY |
1380-1400 |
1350 |
1440-1480 |
-7500.00 |
SL HIT |
1306.25 / 1411.95 |
|
PTC INDIA |
4000 |
SELL |
82-83 |
85 |
80-78 |
12000.00 |
FIRST TGT HIT |
82.80 / 79.60 |
|
ADANI ENT |
1000 |
SELL |
466- 469 |
475 |
455- 440 |
14000.00 |
FIRST TGT HIT |
460.80 / 448.55 |
|
ONGC |
1000 |
SELL |
405-410 |
418 |
395-385 |
10000.00 |
FIRST TGT HIT |
404.20 / 393.30 |
|
HCL TECH |
250 |
BUY |
1730-1750 |
1700 |
1775-1795 |
10000.00 |
FIRST TGT HIT |
1737.50 / 1784.00 |
|
HIND UNILEVER |
500 |
SELL |
735-745 |
755 |
725-715 |
10000.00 |
FIRST TGT HIT |
721.55 / 720.35 |
|
NET PROFIT |
|
|
|
|
|
48500.00 |
|
|
- Share :


Post a Comment
|
DISCLAIMER |
This report is only for the information of our customers. Recommendations, opinions, or suggestions are given with the understanding that readers acting on this information assume all risks involved. The information provided herein is not to be construed as an offer to buy or sell securities of any kind. ATS and/or its group companies do not as assume any responsibility or liability resulting from the use of such information.