ATS Monthly Newsletter
Dear Reader,
November was an eventful month on both the global and domestic front. On the global front, the most awaited one was the U.S Presidential elections, where Mr.Donald Trump got elected as the 45th President of the United States of America. It was one of the most dramatic elections in the recent past. Global markets were seen oscillating either ways due to uncertainty of the outcome. So, now the big event is out of the way investors across the world are now waiting for the US Fed rate decision in December.
Back in India, as a positive step and at an unexpected time, the Government of India has made Rs.500 and Rs.1000 notes illegal from midnight of November 8, 2016.This surprise move came as a shock to our domestic markets, BSE Sensex lost more than 1000 points at one point on Nov 09,2016, but later recovered to close down by under 340 points. November also saw some consensus being reached on the GST front, where the council has reached a consensus and recommended four tax slabs.
We saw Rupee tumbling to record lows and stock markets also witnessed selling pressure as foreign investor’s dumped Indian assets amid rising fear about a U.S. interest-rate hike and a fall in local bond yields damped the appeal of the nation’s debt.
The volatility in the global and domestic markets may stay in the short term, however, the healthy correction that we saw in our markets and any correction going forward should be used as an entry opportunity for the long term.
Earnings season so far
As the second quarter earnings season draws to a close, the earnings were in sync with the market expectations on the topline front. Technology and healthcare showed dismal performance. From a volume growth perspective, auto sector showed robust volume growth but cement and consumption sector showed subdued growth in volumes. On the margins front, barring technology and healthcare the growth was decent.
Outlook
We are expecting temporary disruptions to economic activity due to the recent currency demonetization step from the government of India. Q3FY17, economic activity will be hit because of cash crisis. We have seen long queues infront of ATM’s and Banks and public are spending too much time to either withdraw cash or deposit cash. This wastage of time is also likely to have a negative impact on productivity and the impact on GDP will increase as long as the cash crisis and long queues at ATM’s and Banks lasts. This surprise currency demonetization is coming at a time when most of the foreign and domestic fund managers and institutions were expecting a rise in GDP on the back of 7th pay commission and GST. Majority of their bets were on the consumption sector latest downgrade of India’s GDP is coming at a time when most of the fund managers were
Parliament logjam over demonetization issue continues to have a negative impact. December series expiry started of with a bang allowing the benchmark indices to snap 4-week losing streak. However, going forward, we believe that any development on the demonetization issue including parliamentary proceedings, Fed rate hike and domestic macro- economic data including Q2 GDP & manufacturing PMI will drive the markets. GDP and PMI data from other major economies like the US, China and Japan will also weigh on markets.
INDIAN MACRO-ECONOMY
GDP
At a time when developed economies struggled with lacklustre activity, India, which is Asia's third-largest economy continued to maintain a resilient pace of expansion in recent years, eclipsing China. It has performed remarkably well across all major parameters, whether its in economics or geo-politics. The economy has benefited from lower commodity prices, and inflation has declined more than expected.
As per the data released by the Central Statistics Office, India’s economy grew 7.3 percent in July to September, marginally quicker than the previous quarter’s 7.1 percent. Even though it is 30bps higher than Q1FY17,the growth is 30 basis points lower than the growth recorded in the same quarter a year-ago. Private final consumption expenditure (PFCE), which is the largest component of India’s GDP, grew by 7.6 per cent during the quarter ended September 2016. It accounted for 54.9 per cent of the GDP. Government expenditure too grew by a smart 15.2 per cent.
But, investment demand continued to be week. Gross fixed capital expenditure (GFCF) declined by 5.6 per cent during July-September 2016, this being the second consecutive quarter of a decline. Valuables too registered a steep fall of 47 per cent.
Owing to a fall in international crude oil prices, India’s import bill shrunk by nine per cent during the September 2016 quarter. This reduced the trade deficit dramatically. Trade deficit amounted to only 0.9 per cent of GDP as compared to 5.2 per cent in the year-ago quarter.
Government reports fiscal surplus for first time in FY 17
The Central Government reported a fiscal surplus of Rs.24.5 billion for October 2016. This is the first month in the current year in which the government accounts have not been in deficit.Owing to a fall in international crude oil prices, India’s import bill shrunk by nine per cent during the September 2016 quarter. This reduced the trade deficit dramatically. Trade deficit amounted to only 0.9 per cent of GDP as compared to 5.2 per cent in the year-ago quarter.
Indian government's finances - Oct 2016-17(in billion rupees)
|
|
*Oct-2016 |
Sep-2016 |
Oct-2015 |
*ChgMoM(%) |
*ChgYoY(%) |
|
Total Receipts |
1475.96 |
1858.99 |
783.92 |
-20.6 |
88.28 |
|
Revenue Receipts |
1310.65 |
1816 |
773.69 |
-27.83 |
69.4 |
|
Net Tax Revenue |
818.6 |
1679 |
590.67 |
-51.24 |
38.59 |
|
--Corporation Tax |
205.45 |
1063.25 |
157.03 |
-80.68 |
30.83 |
|
--Income Tax |
256.58 |
343.15 |
199.96 |
-25.23 |
28.32 |
|
--Customs |
188.84 |
183.13 |
183.19 |
3.12 |
3.08 |
|
--Union Excise Duties |
283.16 |
314.12 |
203.55 |
-9.86 |
39.11 |
|
--Service Tax |
282.39 |
176.34 |
215.98 |
60.14 |
30.75 |
|
--Other Taxes^ |
7.4 |
5.43 |
9.87 |
36.28 |
-25.03 |
|
Less: |
|
|
|
|
|
|
--Surcharge for Financing NCCF |
5.92 |
6.98 |
4.65 |
-15.19 |
27.31 |
|
--Assignment to States |
407.39 |
407.39 |
374.26 |
|
8.85 |
|
Non-Tax Revenue |
492.05 |
137 |
183.02 |
259.16 |
168.85 |
|
Recovery of Loans |
113.6 |
14.67 |
10.23 |
674.37 |
1010.46 |
|
Other Receipts |
153.95 |
28.32 |
|
443.61 |
|
|
Total Expenditure |
1231.15 |
2260.67 |
1110.75 |
-45.54 |
10.84 |
|
Non-Plan Expenditure |
1045.29 |
1401.14 |
942.01 |
-25.4 |
10.96 |
|
Plan Expenditure |
185.86 |
859.53 |
168.74 |
-78.38 |
10.15 |
|
Fiscal Deficit |
-244.81 |
401.68 |
326.83 |
-160.95 |
-174.9 |
|
Revenue deficit |
20.16 |
8.74 |
185.45 |
130.66 |
-89.13 |
|
Primary Deficit |
-380.59 |
14.11 |
150.04 |
-2797.31 |
-353.66 |
Net tax collections rose by 38.6 per cent in October 2016, service tax and custom duty being the main growth drivers. Non- tax receipts more-than-doubled to Rs.1.7 trillion in October 2016 from Rs.0.76 trillion in October 2015. The government disinvestment receipts increased by Rs.154 billion in October 2016 which augmented the total revenue collections.
Non-plan expenditure increased by 10.7 per cent to Rs.1 trillion in October 2016 compared to the previous year. Plan expenditure rose by just 10.1 per cent to Rs.185.9 billion in October 2016 from the previous year.
Indian government's finances cumulative in Apr-Oct (in billion rupees)
|
|
Apr-Oct(2016- 17) |
Apr- Oct(2015- 16) |
*ChgYoY( %) |
BudgetEsti mate(2016- 17) |
%BudgetEst imate(2016- 17) |
%BudgetEsti mate(2015- 16)# |
|
Total Receipts |
7273.36 |
6103.74 |
19.16 |
14449.56 |
50.34 |
48.82 |
|
Revenue Receipts |
6979.88 |
5907.38 |
18.16 |
13770.22 |
50.69 |
48.98 |
|
Net Tax Revenue |
5300.15 |
4288.03 |
23.6 |
10541.01 |
50.28 |
45.26 |
|
--Corporation Tax |
2073.34 |
1983.38 |
4.54 |
4939.24 |
41.98 |
43.79 |
|
--Income Tax |
1698.91 |
1424.2 |
19.29 |
3531.74 |
48.1 |
47.62 |
|
--Customs |
1279.71 |
1219.44 |
4.94 |
2300 |
55.64 |
58.21 |
|
--Union Excise Duties |
1806.63 |
1233.63 |
46.45 |
3186.7 |
56.69 |
43.42 |
|
--Service Tax |
1249.12 |
1003.33 |
24.5 |
2310 |
54.07 |
47.78 |
|
--Other Taxes^ |
65.09 |
74.44 |
-12.56 |
41.21 |
157.95 |
188.55 |
|
Less: |
|
|
|
|
|
|
|
--Surcharge for Financing NCCF |
37.03 |
30.62 |
20.93 |
64.5 |
57.41 |
51.81 |
|
--Assignment to States |
2851.66 |
2619.77 |
8.85 |
5703.37 |
50 |
51.75 |
|
Non-Tax Revenue |
1679.73 |
1619.35 |
3.73 |
3229.21 |
52.02 |
62.63 |
|
Recovery of Loans |
181.62 |
68.33 |
165.8 |
106.34 |
170.79 |
36.14 |
|
Other Receipts |
214.1 |
128.03 |
67.23 |
565 |
37.89 |
50.58 |
|
Total Expenditure |
11508.43 |
10216.2 |
12.65 |
19780.6 |
58.18 |
57.22 |
|
Non-Plan Expenditure |
8096.24 |
7509.3 |
7.82 |
14280.5 |
56.69 |
57.4 |
|
Plan Expenditure |
3412.19 |
2706.9 |
26.06 |
5500.1 |
62.04 |
56.73 |
|
Fiscal Deficit |
4235.07 |
4112.46 |
2.98 |
5339.04 |
79.32 |
76.86 |
|
Revenue deficit |
3278.96 |
2875.53 |
14.03 |
3540.15 |
92.62 |
84.18 |
|
Primary Deficit |
1967 |
1957.34 |
0.49 |
412.34 |
477.03 |
211.68 |
Core sector index rises by 6.6% in October 2016
The index of eight core industries rose by 6.6 per cent, a six month high, in October 2016 on a y-o-y basis. In the previous month, the index had risen by five per cent.Five of the eight sectors recorded an increase in production in October 2016. Steel and refinery production continued to post healthy growth, pulling up the index.Steel sector production spiked by 16.9 per cent in October 2016, recording double-digit growth for three months straight. Refinery sector posted a healthy growth of 15.1 per cent in October 2016, higher than the 9.3 per cent rise in September 2016.
Cement production and electricity generation rose on a y-o-y basis in October 2016. Cement production rose by 6.2 per cent during the month, higher than the 5.5 per cent rise in September 2016. Electricity generation was up by 2.8 per cent in October. Fertiliser production slowed down in October 2016. Fertiliser production rose by just 0.8 per cent, lower than the two per cent rise in September 2016. Coal production declined by 1.6 per cent in October 2016, declining for the third month straight. Both crude oil and natural gas production has been on the downhill. Crude oil production declined by 3.2 per cent during the month, falling for the eight month straight. Natural gas production declined by 1.4 per cent in October 2016.
IIP Core Industry Output >> Monthly >> Oct 2016-17
|
Index |
Weight* |
Oct-2016 |
MoAgo |
YrAgo |
ChgMoM(%) |
ChgYoY(%) |
|
Overall |
37.9 |
188.13 |
176.1 |
176.47 |
6.83 |
6.61 |
Eight 'Core' Industries production (in million tonnes)
|
Industry |
Weight* |
Oct-2016 |
MoAgo |
YrAgo |
ChgMoM(%) |
ChgYoY(%) |
|
Crude Petroleum |
5.22 |
3.05 |
2.92 |
3.15 |
4.45 |
-3.17 |
|
Petroleum refinery Products |
5.94 |
19.56 |
18.34 |
16.99 |
6.65 |
15.13 |
|
Coal |
4.38 |
52.19 |
42.43 |
53.02 |
23 |
-1.57 |
|
Electricity# |
10.32 |
105.91 |
97.8 |
102.99 |
8.29 |
2.84 |
|
Cement |
2.41 |
24.26 |
22.63 |
22.84 |
7.2 |
6.22 |
|
Steel |
6.68 |
8.49 |
8.46 |
7.26 |
0.35 |
16.94 |
|
Fertilizers |
1.25 |
3.64 |
3.67 |
3.64 |
-0.82 |
0 |
|
Natural Gas(bln cubic meter) |
1.71 |
2.76 |
2.6 |
2.8 |
6.15 |
-1.43 |
We continue to be optimistic on India’s economic outlook going forward and expect it to remain as one of the brightest spots in the slowing global world. This is clear, if we just look at India’s foreign direct investment figures.
Foreign Direct Investment - Monthly (in U.S $ million) Reported on: 17-Nov-2016
|
Month |
2016 |
ChgMoM(%) |
ChgYoY(%) |
2015 |
ChgMoM(%) |
ChgYoY(%) |
2014 |
ChgMoM(%) |
ChgYoY(%) |
|
Jan |
4975 |
7.34 |
11.02 |
4481 |
107.36 |
104.71 |
2189 |
98.82 |
1.48 |
|
Feb |
3117 |
-37.35 |
-5.2 |
3288 |
-26.62 |
63.01 |
2017 |
-7.86 |
12.37 |
|
Mar |
2466 |
-20.89 |
16.49 |
2117 |
-35.61 |
-40.08 |
3533 |
75.16 |
131.67 |
|
Apr |
3362 |
36.33 |
-6.74 |
3605 |
70.29 |
111.44 |
1705 |
-51.74 |
-26.54 |
|
May |
1983 |
-41.02 |
-48.49 |
3850 |
6.8 |
6.83 |
3604 |
111.38 |
120.97 |
|
Jun |
2245 |
13.21 |
9.3 |
2054 |
-46.65 |
6.59 |
1927 |
-46.53 |
33.45 |
|
Jul |
4081 |
81.78 |
103.34 |
2007 |
-2.29 |
-42.66 |
3500 |
81.63 |
111.23 |
|
Aug |
4803 |
17.69 |
116.35 |
2220 |
10.61 |
73.71 |
1278 |
-63.49 |
-9.23 |
|
Sep |
5149 |
7.2 |
77.74 |
2897 |
30.5 |
8.18 |
2678 |
109.55 |
-35.19 |
|
Oct |
|
|
|
5242 |
80.95 |
97.44 |
2655 |
-0.86 |
116.56 |
|
Nov |
|
|
|
2934 |
-44.03 |
90.89 |
1537 |
-42.11 |
-6.17 |
|
Dec |
|
|
|
4635 |
57.98 |
114.48 |
2161 |
40.6 |
96.28 |
|
Total |
32181 |
|
|
39330 |
|
|
28784 |
|
|
(Source : Department of Industrial Policy & Promotion & Ministry of Commerce & Industry)
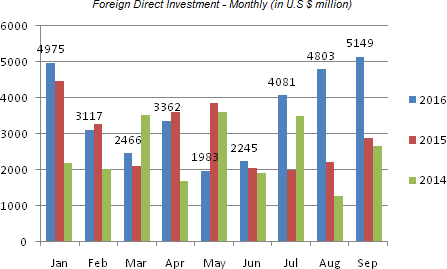
According to Department of Industrial Policy and Promotion (DIPP), the total FDI investments India received in FY 2015-16 (April 2015-March 2016) was US$ 40 billion, indicating that government's effort to improve ease of doing business and relaxation in FDI norms is yielding results.
Consumer confidence in India is also strong. If we look at the data compiled by Nielsen Global for the second quarter of 2016, we can find that, India’s consumer confidence stood at 128. A value above 100 suggests that consumers are optimistic, and any value below 100 suggests that consumers are pessimistic.
Cooling of inflation in the recent months has given the Reserve Bank of India enough room to cut the benchmark repo rate by 25 basis points last month to 6.25 per cent, a six-year low. Considering lower inflation data,lower cost of funds for banks due to excess liquidity will force RBI to take one more rate cut during Q4FY17. This will help the government in its efforts to boost economic growth to above 8 per cent. However the currency demonetization process which was announced on Nov 8th 2016 by the government inorder to fight tax evasion, corruption and forgery by withdrawing old Rs.500 and Rs.1000 notes have caused chaos across the economy, particularly those companies or sectors which are cash reliant(trucking). It could have a negative impact on the consumption space in the short term and thus Q3 FY17 GDP could likely decline between 25-50bps.
Currency demonetization to cost over Rs.143bn to RBI and Government
As part of the demonetization process, the government and the RBI will have to take care of at least four kinds of costs and they are 1.Cost of printing new currency notes, 2.Transportation cost, 3.NHAI(National Highway Authority of India) will have to compensate the companies operating toll plazas across the nation who have been asked to make the highways toll-free. 4. Cost in terms of human resource.
As per the latest publications, it's estimated that the cost of demonetizing old currency notes and printing new currency notes could be around Rs.109 billion. Transportation of these new currency notes and taking back the old ones to RBI is a mammoth task. The estimated cost of transporting this cash to the various bank branches, post offices, and ATMs is around Rs.16 billion over the 50-day period. It includes the cost of airlifting the cash to 123 airports in the country in six sorties and then transporting them by road to the bank branches, post offices, and ATMs. Toll plazas could be losing around Rs.800mn a day. Since toll collection is expected to commence from 02, Dec, we are just taking 23 days, it could come anywhere above Rs.18bn.No reliable estimate is available regarding the direct monetary cost of this mammoth task of the government. So, even after ignoring the cost of human resources, the cost to be borne by the government and RBI could come above Rs.143bn.
Banking and interest rates
Post demonetization, there could be a reduction in the money supply. However, once the currency notes go into the banking system, bank deposits will see a surge. Banks are expected to attract a huge amount of money from CASA and be the cheapest source of funds that will have a positive impact. As deposit with them increases, banks will have to increase their credit offtake. In order to increase demand for credit, banks both public and private will therefore pass on this benefit to customers in the form of reduced lending rates for home loans and other key segments. We are expecting similar rate cut decisions from the RBI’s table in December or in the near future. Inflation has also cooled down in the month of October, which could provide the RBI’s newly formed monetary policy committee some space to cut rates further.
Wholesale Price Index (WPI) - Monthly - Oct 2016-17
111
(Source : Ministry of Commerce & Industry)
Inflation
Cash crisis due to demonetization, could lead to deflationary trend across items in the short term. In addition to this, the so called shadow economy, which used to generate inflation, will also be affected by the governments move. In the short term, demand for real estate which was already muted could take a hit. However over the longer term, as banks are expected to cut their lending rates demand for affordable homes is likely to increase.
Media reports suggest that the government might be looking to use part of the proceeds from the currency demonetisation drive to boost an already crippled housing market. Senior cabinet ministers are believed to be in favour of using the money to announce a housing scheme that would offer significant discounts to prevailing home loan rates. Sources add the government is keen to launch the scheme with cheaper home loan rates of 6-7% versus today's average of more than 9%. These lower interest rate home loans are focused towards first time home buyers and for a loan of up to Rs 50 lakh. It is still believed to be in the initial stages and the final details are expected only once the government has assessed the full fiscal impact of demonetisation. However,we at ATS have not confirmed the news from our side and hence don’t take any responsibility about its authenticity.
Nikkei India Manufacturing PMI eases to 52.3 in November 2016
Withdrawal of high-value currency notes impacted manufacturing growth in November with companies signaling softer increases in order books, buying levels and output. Nikkei India manufacturing PMI came at 52.3 in November and it was an eleventh consecutive monthly improvement in manufacturing conditions across India. However, this was down from October's 22-month high of 54.4, the latest reading pointed to a modest upturn overall.
One factor contributing to the downward movement in the PMI was a softer expansion in new business inflows. Order books rose at a moderate pace that was the slowest since July. The upturn in new export orders also lost some momentum in November.
Manufacturing production growth slowed amid reports of cash shortages. Softer increases in output were noted in each of the three monitored sectors, with consumer goods producers recording a sharp slowdown in growth. Although firms continued to step up their quantities of purchases, the rate of expansion eased from October's 14-month high. Money issues was the main reason listed by respondents for the softer growth in input buying. By sector, the weakest performer on this front was consumer goods.
India Foreign exchange reserves in Q2FY17 (data updated till 18-Nov-2016)
222
Commodities
333
-
Copper prices rose to a 17-month high boosted by an improving demand outlook and a weaker U.S. dollar. Prices have benefited from upbeat economic data and infrastructure plans in China and the U.S., which could help reignite demand for copper.
-
Zinc Prices rallied and touched a nine-year high after China’s top economic commission approved a $36 billion plan on new rail links around Beijing, boosting demand for industrial raw materials.
-
Lead remained up as traders engaged in enlarging their positions, tracking a firm trend at the spot market. Widening of positions by participants on the back of rising demand from battery-makers mainly kept lead prices higher.
-
Oil prices surged more than 5% at their highest in about 16 months, extending gains after OPEC and Russia agreed to restrict output to reduce the global supply glut more quickly.
-
Gold sank pressured by a stronger U.S. dollar and investor concerns that the Federal Reserve will raise interest rates in December.
Currencies
The U.S. dollar rose against a basket of major currencies powered by rising U.S. bond yields following Republican candidate Donald Trump's victory in the presidential election. Given below is a table that shows the depreciation (-)/appreciation (+) of the dollar against various currencies for the month of November 2016:
0000
-
The rupee sank to a record low against the US dollar, amid nearly $5 billion outflows from foreign institutional investors (FIIs) in local equity and bond markets since the government announced the demonetization scheme.
-
U.S. dollar was broadly firm, hitting 9 1/2-month highs against the yen as oil prices surged after OPEC agreed to output cuts – lifting inflation expectations and U.S. bond yields.
-
The euro skidded to a nearly one-year low against the dollar as investors expect the European Central Bank to maintain its loose monetary policy stance to stoke euro zone inflation while the U.S. Federal Reserve is poised to raise rates by year-end.
Stock market and technical outlook
Global Markets
World markets ended the month of November 2016 largely on a negative note. Indonesia - Jakarta Composite was the top loser falling 5.0%. India - Nifty, Brazil - Bovespa, India - Sensex, UK - FTSE Hong Kong – Hang Seng, and Germany – DAX fell 4.7%, 4.6%, 4.6%,2.5%,0.6% and 0.2% respectively, while US - Dow Jones, Japan - Nikkei, Chinese - Shanghai composite, Singapore - Strait Times & US – Nasdaq rose 5.4%, 5.1%, 4.8%, 3.2% & 2.6% respectively.
Indian Markets
The S&P BSE Sensex and CNX Nifty fell 4.6% and 4.77% respectively in the month of November 2016. Even though Indian stock markets managed to stage a recovery in the last few trading sessions of the month, it was among the worst performers in emerging Asian equities, both in terms of absolute fall and foreign outflows. While the primary reason for this underperformance was concerns about an economic slowdown after currency demonetization. Worries about the US President-elect Donald Trump's proposed policies and their likely impact on inflation in the U.S resulting in a faster-than-expected rate hike by the Federal Reserve also impacted sentiments. The fall was the second-highest among emerging Asian countries after the Philippines, which lost 8.4%.
After the recent correction, from a valuation point of view markets are trading at valuations close to the long-term average, we could see some near-term volatility. Globally, US Fed’s stance on interest rates is the most awaited event. On the domestic front, earnings recovery, implementation of the Goods and Services Tax (GST), Reserve Bank of India’s (RBI) take on interest rates and upcoming State elections would be closely tracked by market participants. We believe that they are likely to have a short-term impact and not de-rail long-term growth prospects as the structural drivers of the Indian economy continue to remain intact.
In our report dated 14, Nov 2016 we had mentioned that 8002 or 7890 could act the bottom for the market. After the release of that report on 14th Nov, Nifty fell to 7916.40, on 21st Nov, this was close to our suggested support level around 7890. We had mentioned that from that low Nifty could move towards 8200 or towards 8300, where it will face resistance. We expect that Nifty will stay around this zone for a while, but once it crosses that 8300 level, the next resistance will come in around 8500. We expect traders could take fresh short positions in and around 8500, and as a result it will come to 8300 and this level could act as the base for the next expected rally which could take market to new highs by Feb 2017. We at ATS are bullish on the markets and think that the dips should be used by long term investors to add for riding the subsequent upmove. However investors need to be careful about the quality of stocks they invest in as the broader market and stocks may still keep underperforming (due to over investment, high leverage, high cost acquisitions, poor governance practices etc in a host of companies) while the top 150 odd stocks may outperform.
- Share :


Post a Comment
|
DISCLAIMER |
This report is only for the information of our customers. Recommendations, opinions, or suggestions are given with the understanding that readers acting on this information assume all risks involved. The information provided herein is not to be construed as an offer to buy or sell securities of any kind. ATS and/or its group companies do not as assume any responsibility or liability resulting from the use of such information.