Aurobindo Pharma Ltd
Aurobindo Pharma manufactures generic pharmaceuticals and active pharmaceutical ingredients. The company's robust product portfolio is spread over 7 major therapeutic/product areas encompassing Antibiotics, antiretrovirals, CVS, CNS, gastroenterological, anti-allergies, and anti-diabetics. The company is marketing these products globally, in over 150 countries.
|
BSE |
524804 |
|
|
NSE |
AUROPHARMA |
|
|
REUTERS |
ARBN.BO |
|
|
INCEPTION |
1986 |
|
|
IPO |
1995 |
|
|
INDUSTRY |
Pharmaceuticals |
|
|
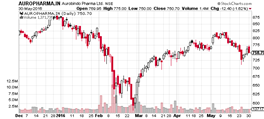
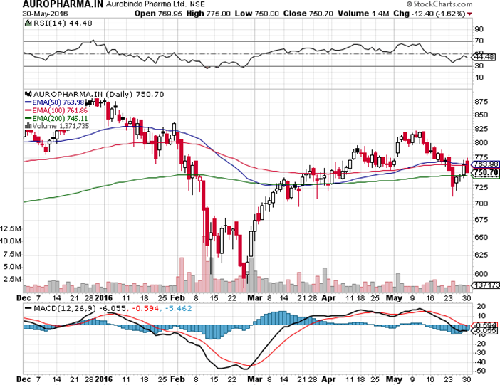
CMP (as on 30/05/2016) |
750.00 |
|
|
Stock Beta |
1.1585 |
|
|
52 Week H/L |
582.00 / 891.00 |
|
|
Market Cap (Cr) |
43917 |
|
|
Equity Capital (cr) |
58.52 |
|
|
Face Value (Rs) |
1 |
|
|
Average Volume |
|
|
|
Shareholding Pattern (%) |
||
|
Promoters |
53.79 |
|
|
Non Institutions |
46.21 |
|
|
Grand Total |
100.00 |
|
Aurobindo Pharma - Potential Catalysts
-
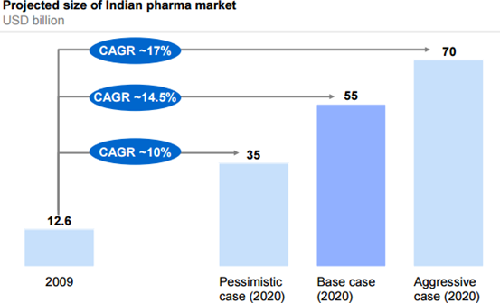
Domestic pharma market to clock $55bn by 2020 primarily driven by rising urbanization with revenue CAGR 16% for FY16-FY18
-
New launches have picked up with approvals and expect faster approvals to continue
-
Sales in US to drive growth. Expect revenue CAGR of 16% for FY16-FY18 better than industry average and margins to improve over 200bps
-
Lower long term debt and improving Interest coverage ratio may improve credit rating which can boost stock prices.
Aurobindo Pharma - Recommendation
Improvement in execution, stabilization of margins, and cash flow improvement to remain key drivers for the stock. Faster approvals of new drugs from USFDA, sales in US and improvement in margins will drive revenue with CAGR 16% for FY16-FY18. We recommend BUY on the stock at CMP of Rs. 750 to target of Rs. 990 (Forward PE of 18.86x FY17).
Aurobindo Pharma - Financial Summary
|
Yearly Income Statement |
2013 |
2014 |
2015 |
2016 E |
2017 E |
|
Total Income |
5883.85 |
8121.35 |
12201.28 |
13820.67 |
15917.89 |
|
EBIDTA |
754.18 |
1983.64 |
2644.38 |
3185.63 |
3690.85 |
|
EBIT |
505.44 |
1671.11 |
2311.77 |
2802.82 |
3266.10 |
|
Profit After Tax |
291.40 |
1169.07 |
1571.25 |
1938.58 |
2327.55 |
|
EPS (Unit Curr.) |
13.32 |
20.04 |
26.93 |
33.17 |
39.78 |
|
PE |
- |
- |
24.05 |
22.61 |
18.86 |
|
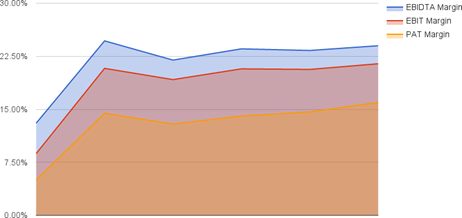
EBIDTA Margin |
13.04% |
24.68% |
21.96% |
23.55% |
23.32% |
|
EBIT Margin |
8.74% |
20.79% |
19.20% |
20.72% |
20.64% |
|
PAT Margin |
5.00% |
14.44% |
12.91% |
14.04% |
14.62% |
BUSINESS DISCRIPTION
Aurobindo Pharma Limited (Aurobindo) is an India-based pharmaceutical company. The Company is engaged in producing oral and injectable generic formulations and active pharmaceutical. Aurobindo also manufactures and commercializes active pharmaceutical ingredients (APIs) and generic finished dosages for various markets. The Company's product portfolio is spread over six therapeutic/product areas, including antibiotics, anti-retrovirals, chorionic villus sampling (CVS), central nervous system (CNS), gastroenterologicals and anti-allergics. It has presence in various therapeutic segments, such as semi-synthetic penicillin's, antibiotics, neurosciences, cardio vasculars, anti-retrovirals, diabetics and gastroenterology, among others. The Company operates across various divisions, including API manufacturing, formulation manufacturing, chemical research and development, formulation research and development, and overseas operations.
Aurobindo Pharma Ltd has set a vision to build businesses that impact their respective addressable markets, are respected for customer centric products and services, meet industry benchmarks in productivity of resources, are recognized for quality and compliance standards and in the ultimate analysis, create societal wealth for all stakeholders.
In financial terms, the objective is to lower volatility, strive for higher predictable and calibrated growth, and improve EBITDA margin and Return on Investment higher than the industry average. The target is to stay cash-flow positive, improve the quality of the balance sheet, lower the leverage, reduce interest outgo and expand earnings year on year.
MANAGEMENT & GOVERNANCE
|
K. Nityananda Reddy |
WholeTime Vice Chairman of the Board |
|
Santhanam Subramanian |
Chief Financial Officer |
|
A. Mohan Rami Reddy |
Associate Vice President (Legal), Company Secretary, Compliance Officer |
|
N. Govindarajan |
Managing Director, Executive Director |
|
M. Madan Mohan Reddy |
Whole-Time Director |
|
M. Sivakumaran |
Whole-Time Director |
|
K. Ragunathan |
Non-Executive Independent Chairman of the Board |
|
P. Sarath Chandra Reddy |
Non-Independent Non-Executive Director |
|
P.V. Ramaprasad Reddy |
Non-Executive Director |
|
M. Sitarama Murthy |
Independent Non-Executive Director |
Shareholding pattern as on March 2016
|
Description as on |
31/03/2016 |
31/03/2016 |
|
Foreign (Promoter & Group) |
18000000 |
3.08 |
|
Indian (Promoter & Group) |
296751572 |
50.71 |
|
Total of Promoter |
314751572 |
53.79 |
|
Non Promoter (Institution) |
202861711 |
34.67 |
|
Non Promoter (Non-Institution) |
67556303 |
11.54 |
|
Total Non Promoter |
270418014 |
46.21 |
|
Total Promoter & Non Promoter |
585169586 |
100 |
|
Custodians(Against Depository Receipts) |
0 |
0 |
|
Grand Total |
585169586 |
100 |
INVESTMENT RATIONALE
Domestic pharma market to clock $55bn by 2020 primarily driven by rising urbanization with revenue CAGR 16% for FY16-FY18
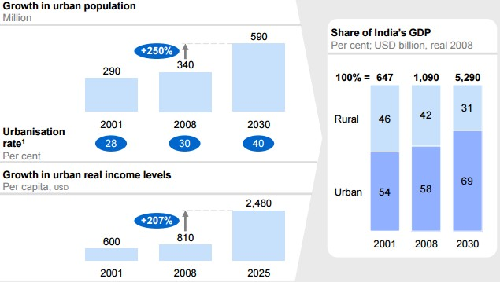
The Indian pharmaceuticals market has characteristics that make it unique. First branded generics dominate, making up for 70 to 80% of the retail market. Second, local players have enjoyed a dominant position driven by formulation development capabilities and early investments. Third, price levels are low, driven by intense competition. While India ranks tenth globally in terms of value, it is ranked third in volumes. These characteristics present their own opportunities and challenges.
The lifestyle segments such as cardiovascular, anti-diabetes, anti-depressants, and anti-cancers will continue to be lucrative and fast-growing owing to increased urbanization and change in lifestyle patterns. Going forward, better growth in domestic sales will depend on the ability of companies to align their product portfolio towards these chronic therapies as these diseases are on the rise.
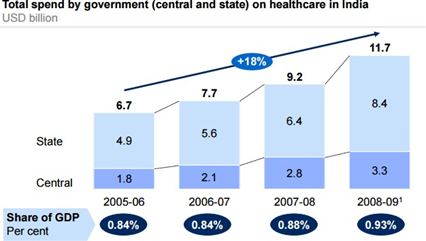
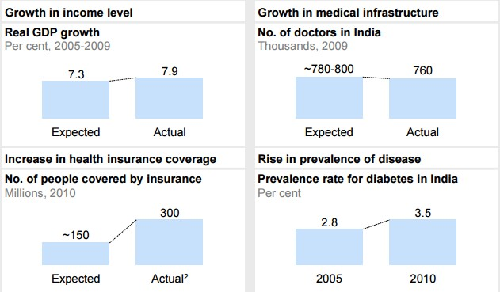
The affordability of drugs will rise due to sustained growth in incomes and an increase in insurance coverage. With GDP growth at 7% over the next decade, income levels will rise steadily. Rising incomes will drive household spending. Research expects 650 million people will enjoy health insurance coverage by 2020. Along with this, accessibility to drugs will expand due to growth in medical infrastructure with a new business model for tier 2 and tier 2 cities and towns. Government spending (central and state) on healthcare in India is on a steady upward trajectory with an 18% CAGR from 2005 to 2010.
Healthcare spending by the government in India is on a steady upward trajectory
For the US market, Indian companies are developing niche portfolios in various segments. High-margin injectables, dermatology, respiratory, biosimilars, complex generics, etc. have become an area of interest. Most of the Indian pharma companies have been working on these niche drugs to optimize growth and margins. Thus, post-patent cliff, the companies which have developed their product basket in the niche category will be ahead in the curve. Moreover, generic penetration in the US is expected to increase to 86-87% over the next couple of years from 83% currently.
Driven by growing urbanization, metro and Tier-1 towns will continue to be significant drivers for growth
The government of India plans to set up a US$ 640 million venture capital fund to boost drug discovery and strengthen pharmaceutical infrastructure. Speedy introduction of generic drugs into the market has remained in focus and is expected to benefit the Indian pharmaceutical companies.
These initiatives will drive the future growth of the pharma industry.
New launches have picked up with approvals and expect faster approvals to continue
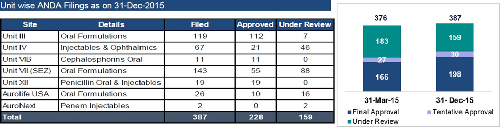
Aurobindo Pharma is a beneficiary of faster approvals for its drugs in the US. The US market contributes 80% to Aurobindo’s profits. It received final approval from USFDA to launch Amlodipine and Valsartan Tablets USP, 5 mg/160 mg, 10 mg/160 mg, 5 mg/320 mg and 10 mg/320 mg. It has an estimated market size of $123 million in US, according to IMS. Aurobindo now has a total of 254 ANDA approvals (218 final approvals including 10 from Aurolife Pharma LLC and 36 tentative approvals) from USFDA as of May 2016.
Future launches
-
Naproxen Sodium Tablets USP, 220 mg (OTC) is expected to be launched in Q1 June 2016. Naproxen Sodium Tablets is used in the treatment and prevention of osteoporosis in postmenopausal women. According to IMS data, the approved product has an estimated market size of $96 million in the United States.
-
Bupivacaine Hydrochloride Injection USP, 0.25% (2.5 mg/mL) and 0.5% (5 mg/mL) multiple-dose vials is expected to be launched in Q2 September 2016. This product has an estimated market size of $5.6 million in the US, according to IMS.
-
Polymyxin B is also expected to be launched in Q2 September 2016. Polymyxin B for Injection is an anti-infective used in the treatment of infections of the urinary tract, meninges, bloodstream, and eye caused by susceptible strains of Pseudomonas aeruginosa. The approved product has an estimated market size of $7.6 million in the United States according to IMS.
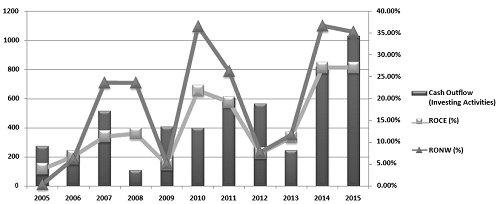
These launches will boost future growth improving revenues. Spending on Capex and R&D is producing excellent results and we expect faster approvals to continue with fast pace. Historically capex has grown CAGR 12.83% since 2005 which has produced return on this investment at 19.26% CAGR over same period and total return of 49.29% CAGR to net worth.
Historical return on Capex and R&D spending
|
|
2005 |
2006 |
2007 |
2008 |
2009 |
2010 |
2011 |
2012 |
2013 |
2014 |
2015 |
|
Cash Outflow (Investing Activities) |
272.39 |
244.19 |
513.31 |
106.92 |
406.28 |
398.26 |
603.1 |
563.17 |
245.87 |
818.63 |
1027.48 |
|
ROCE (%) |
3.91% |
6.83% |
11.36% |
12.03% |
4.94% |
21.88% |
19.25% |
7.54% |
11.13% |
27.12% |
27.13% |
|
RONW (%) |
0.43% |
6.25% |
23.68% |
23.62% |
5.10% |
36.59% |
26.27% |
7.74% |
11.73% |
36.72% |
35.29% |
Sales in US to drive growth. Expect revenue CAGR of 16% for FY16-FY18 better than industry average and margins to improve over 200bps
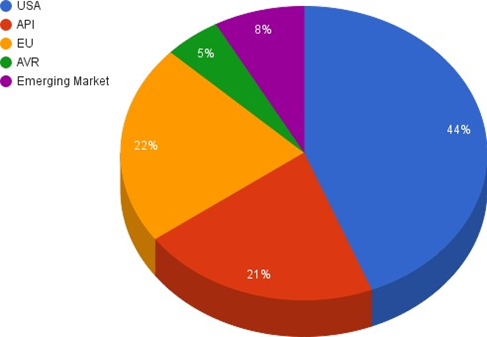
United States revenue contributes 44% to sales. Appreciation of dollar in the resent quarter has also helped increase dollar revenue. More than that dollar contributes 80% to Aurobindo’s profit. It now has a total of 254 ANDA approvals (218 final approvals including 10 from Aurolife Pharma LLC and 36 tentative approvals) from USFDA. Sale of these drugs will accrete revenue over F16-FY18.
Management revised maintainable operating margins to 22-24% in FY16E-18E. Also core EU formulation sales of US$520m are from six key markets – UK, Netherlands, Italy, Spain, Germany and Portugal. Expect improvement in execution, stabilization of margins, peaking of working capital cycle, and cash flow improvement to remain key drivers for the stock. We expect margins to improve on the account of lower cost of production to its output and lower debt.
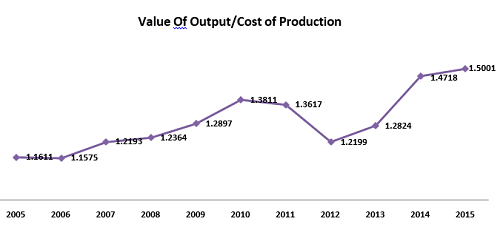
|
Effective utilization of resources. |
2005 |
2006 |
2007 |
2008 |
2009 |
2010 |
2011 |
2012 |
2013 |
2014 |
2015 |
|
Value Of Output |
1313.78 |
1610.39 |
2191.55 |
2493.82 |
3029.06 |
3708.79 |
4587.9 |
4633.46 |
6125.57 |
8201.79 |
12450 |
|
Cost of Production |
1131.54 |
1391.22 |
1797.39 |
2017.02 |
2348.72 |
2685.35 |
3369.33 |
3798.24 |
4776.63 |
5572.68 |
8299.34 |
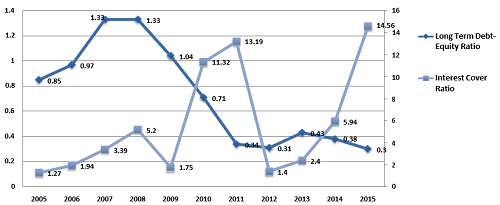
Aurobindo management has been effective in reducing debt and increasing interest coverage ratio. Long term debt to equity ratio is 2015 stood at 0.30 against 1.33 in 2008. At the same time, the interest coverage ratio stands all-time high of 14.56 for FY15. This improvement along with an increase in cash flow makes the company an eligible candidate for credit rating and we expect the stock to perform on this regard.
Improvement in growth and cash flow can be contributed to the upturn in economic growth, a gradual pass-through of interest rate cuts, weakness in international commodity prices, and the government's pro-growth policy agenda.
Margin and Growth Figures
|
|
2013 |
2014 |
2015 |
2016 E |
2017 E |
2018 E |
|
EBIDTA Margin |
13.04% |
24.68% |
21.96% |
23.55% |
23.32% |
23.99% |
|
EBIT Margin |
8.74% |
20.79% |
19.20% |
20.72% |
20.64% |
21.44% |
|
PAT Margin |
5.00% |
14.44% |
12.91% |
14.04% |
14.62% |
15.97% |
|
|
||||||
|
Revenue Growth |
|
39.00% |
49.82% |
12.33% |
17.00% |
15.50% |
|
EBIDTA Growth |
19.65% |
55.71% |
11.28% |
14.97% |
14.38% |
|
|
EBIT Growth |
230.62% |
38.34% |
21.24% |
16.53% |
19.99% |
|
|
PAT Growth |
299.00% |
34.35% |
23.18% |
19.91% |
26.06% |
|
VALUATION
Aurobindo Pharma Ltd is currently trading at 750 per share with a market capitalization of 43,917 Crores. It has total debt of 4854 Cr and total cash and bank balance of 819 Cr. Its effective tax rate stood at 26%.
|
|
2005 |
2006 |
2007 |
2008 |
2009 |
2010 |
2011 |
2012 |
2013 |
2014 |
2015 |
|
Market Capitalisation |
1458.15 |
3637.69 |
3622.59 |
1566.3 |
1020.9 |
5342.43 |
5702.65 |
3461.18 |
4248.61 |
14891.28 |
35627.68 |
|
Net Sales |
1315.13 |
1561.21 |
2104.45 |
2426.12 |
3037.98 |
3523.87 |
4381.48 |
4627.4 |
5855.32 |
8099.79 |
12120.52 |
|
PBIDT |
131.3 |
239.73 |
392.59 |
461.54 |
342.39 |
976.87 |
1024.33 |
264.82 |
889.49 |
2155.21 |
2660.33 |
|
Adjusted PAT |
2.54 |
45.73 |
191.97 |
238.76 |
60.55 |
554.85 |
570.68 |
186.53 |
299.32 |
1175.09 |
1587.14 |

We value Aurobindo using DCF at price of 790 and we recommend you to accumulate stock for the target of 990 for FY17 with expected growth rate at 17% for FY17 and 15.5% for FY18. For valuation we assume that over the period company will keep capital structure unaltered and tax rate unchanged.
Aurobindo Pharma Ltd is currently trading at an EV/EBITDA multiple of 13.86x based on our FY16 EBITDA estimate. We have also analyzed valuation multiples of other Indian players. Based on our fair value of Rs 982 per share, an implied one-year forward EV/EBITDA multiple for Aurobindo is 14.21x FY14 EBITDA. This is at a premium compared to overall average of 19.5x for Indian companies. We believe that the premium over other companies is justified given Aurobindo’s strong brand equity, healthy growth prospects, improving profitability margins, better return ratios, strong balance sheet and prudent management.
|
Co_Name |
Market Price |
Market Capitalisation |
EPS(cons.) |
Bookvalue (cons.) |
P/E Ratio |
P/E Ratio - cons |
P/BV |
P/BV - cons |
Dividend Yield % - cons |
|
Sun Pharma.Inds. |
812.1 |
195452.48 |
18.29 |
106.45 |
48.61 |
44.4 |
8.96 |
7.63 |
0.37 |
|
Lupin |
1467.85 |
66155.53 |
44.61 |
196.9 |
22.93 |
32.9 |
5.71 |
7.45 |
0.51 |
|
Dr Reddy's Labs |
3170.25 |
54086.89 |
143.34 |
577.54 |
32.59 |
22.12 |
4.66 |
5.49 |
0.63 |
|
Aurobindo Pharma |
750 |
44148.12 |
31.15 |
88.11 |
28.5 |
24.05 |
7.32 |
8.56 |
0.3 |
|
Cipla |
473.55 |
38047.69 |
20.07 |
134.17 |
27.22 |
23.59 |
3.09 |
3.53 |
0.42 |
|
Cadila Health. |
334.1 |
34203.24 |
14.51 |
41.53 |
17.3 |
23.03 |
5.57 |
8.03 |
0.96 |
|
Divi's Lab. |
1110.15 |
29470.99 |
30.25 |
131.67 |
29.05 |
36.7 |
8.27 |
8.43 |
0.9 |
|
Glenmark Pharma. |
876 |
24717.76 |
26.45 |
139.83 |
16.83 |
33.12 |
3.39 |
6.27 |
0.23 |
|
Piramal Enterp. |
1383.85 |
23878.33 |
51.43 |
680.15 |
24.05 |
26.91 |
1.96 |
2.04 |
1.26 |
|
Torrent Pharma. |
1370.4 |
23189.91 |
93.89 |
147.18 |
12.42 |
14.6 |
6.29 |
9.29 |
2.57 |
|
Wockhardt |
931.7 |
10296.11 |
28.67 |
309.21 |
31.37 |
32.5 |
9.44 |
3.02 |
0 |
|
Natco Pharma |
484.6 |
8440.48 |
8.58 |
68.15 |
47.6 |
56.48 |
6.58 |
7.11 |
1.03 |
|
|
|||||||||
|
Average |
|
|
42.60 |
218.41 |
28.21 |
30.88 |
5.94 |
6.40 |
0.77 |
Aurobindo Pharma Ltd is trading at discount to its peers when we evaluate on P/E (cons) at 24.05 against 30.88 its peers. At 30.88 P/E Aurobindo should be trading at its fair market value of 963 per share. Though this value is on the higher side, we believe with the quality of Aurobindo’s management, its lower debt and higher growth it should be trading near to its fair value.
|
|
Net Sales Growth |
|
EBITDA Growth |
|
PAT Growth |
|||
|
Net Sales['15] |
Net Sales['14] |
EBITDA ['15] |
EBITDA '14] |
PAT ['15] |
PAT ['14] |
|||
|
Sun Pharma.Inds. |
70.60% |
42.31% |
62.41% |
7.25% |
-7.97% |
47.85% |
||
|
Lupin |
13.14% |
17.06% |
23.73% |
35.75% |
30.49% |
39.22% |
||
|
Dr Reddy's Labs |
11.99% |
13.38% |
10.15% |
21.50% |
17.73% |
28.47% |
||
|
Aurobindo Pharma |
49.64% |
38.33% |
|
23.44% |
142.30% |
|
35.07% |
292.59% |
|
Cipla |
11.52% |
22.88% |
|
-2.97% |
-2.49% |
|
-17.86% |
-8.63% |
|
Cadila Health. |
19.76% |
13.63% |
45.97% |
6.15% |
41.15% |
24.79% |
||
|
Divi's Lab. |
23.02% |
18.06% |
11.51% |
26.16% |
10.56% |
28.77% |
||
|
Glenmark Pharma. |
10.40% |
19.81% |
-5.25% |
7.43% |
-12.35% |
-12.54% |
||
|
Torrent Pharma. |
11.20% |
30.32% |
31.94% |
41.76% |
12.24% |
44.35% |
||
|
Wockhardt |
-7.22% |
-13.89% |
-30.34% |
-49.14% |
-51.12% |
-48.11% |
||
|
Piramal Enterp. |
13.77% |
27.91% |
345.14% |
45.60% |
-189.22% |
126.04% |
||
|
Natco Pharma |
11.69% |
11.86% |
8.74% |
30.04% |
40.77% |
29.85% |
||
|
|
||||||||
|
Average |
11.77% |
16.32% |
|
50.59% |
13.19% |
|
-20.73% |
23.07% |
FINANCIALS
|
Balance Sheet |
201306 |
201403 |
201503 |
|
SOURCES OF FUNDS : |
|
|
|
|
Share Capital |
29.2 |
29.15 |
29.12 |
|
Reserves Total |
5126.7 |
3721 |
2576.6 |
|
Total Shareholders Funds |
5155.9 |
3750.2 |
2605.8 |
|
Minority Interest |
25.82 |
25.67 |
11 |
|
Secured Loans |
2081.9 |
2606.4 |
2437.7 |
|
Unsecured Loans |
2369.1 |
1162.7 |
997.74 |
|
Total Debt |
4451.1 |
3769.1 |
3435.5 |
|
Policy Holders Fund |
0 |
0 |
0 |
|
Other Liabilities |
24.35 |
9.18 |
9 |
|
|
|
|
|
|
Total Liabilities |
9657.2 |
7554.1 |
6061.2 |
|
APPLICATION OF FUNDS : |
|
|
|
|
Gross Block |
5446.1 |
4183 |
3763.5 |
|
Less: Accumulated Depreciation |
1740.5 |
1461.3 |
1124.6 |
|
Net Block |
3705.6 |
2721.7 |
2638.9 |
|
Capital Work in Progress |
419.63 |
309.72 |
218.51 |
|
Producing Properties |
0 |
0 |
0 |
|
Investments |
19.79 |
19.79 |
22.28 |
|
Current Assets, Loans & Advances |
|
|
|
|
Inventories |
3611.3 |
2367.5 |
1923.6 |
|
Sundry Debtors |
3539.2 |
2636.6 |
1597 |
|
Cash and Bank |
469.11 |
178.58 |
208.45 |
|
Loans and Advances |
659.57 |
448.46 |
407.69 |
|
Total Current Assets |
8279.2 |
5631.2 |
4136.7 |
|
Less : Current Liabilities and Provisions |
|
|
|
|
Current Liabilities |
2828.6 |
1603.7 |
1063.5 |
|
Provisions |
218.24 |
126.6 |
80.09 |
|
Total Current Liabilities |
3046.8 |
1730.3 |
1143.6 |
|
Net Current Assets |
5232.4 |
3900.9 |
2993.1 |
|
Deferred Tax Assets |
33.3 |
18.61 |
142.88 |
|
Deferred Tax Liability |
239.08 |
223.98 |
210.88 |
|
Net Deferred Tax |
-205.8 |
-205.4 |
-68 |
|
Other Assets |
485.52 |
807.44 |
256.48 |
|
|
|
|
|
|
Total Assets |
9657.2 |
7554.1 |
6061.2 |
|
|
|
|
|
|
Contingent Liabilities |
195.38 |
151.36 |
180.06 |
|
Quarterly Income Statement |
201406 |
201409 |
201412 |
201503 |
201506 |
201509 |
201512 |
201603 E |
|
Net Sales |
2894.61 |
2862.19 |
3142.46 |
3143.97 |
3263.72 |
3280.11 |
3432.08 |
3552.20 |
|
Other Income |
10.81 |
27.29 |
35.92 |
6.74 |
29.11 |
11.66 |
6.87 |
13.5 |
|
Other Operating Income |
16.46 |
19.03 |
23.7 |
18.1 |
56.64 |
53.36 |
63.42 |
58.00 |
|
Total Income |
2921.88 |
2908.51 |
3202.08 |
3168.81 |
3349.47 |
3345.13 |
3502.37 |
3623.70 |
|
Total Expenditure |
2252.92 |
2244.01 |
2553.99 |
2505.98 |
2595.71 |
2557.88 |
2672.49 |
2808.96 |
|
EBIDTA |
668.96 |
664.50 |
648.09 |
662.83 |
753.76 |
787.25 |
829.88 |
814.74 |
|
Depreciation |
90.83 |
89.85 |
67.26 |
84.67 |
89.11 |
92.77 |
99.47 |
101.46 |
|
EBIT |
578.13 |
574.65 |
580.83 |
578.16 |
664.65 |
694.48 |
730.41 |
713.28 |
|
Interest |
17.43 |
62.99 |
42.09 |
21.41 |
46.43 |
81.97 |
9.77 |
9.77 |
|
PBT |
560.70 |
511.66 |
538.74 |
556.75 |
618.22 |
612.51 |
720.64 |
703.51 |
|
Tax |
146.43 |
140.43 |
156.34 |
153.4 |
186.53 |
162.2 |
185.99 |
181.57 |
|
Deferred Tax |
0 |
0 |
0 |
0 |
0 |
0 |
0 |
0 |
|
Adjusted Profit After Extra-ordinary item |
415.43 |
372.18 |
384.35 |
403.80 |
432.44 |
451.76 |
534.95 |
521.93 |
|
|
||||||||
|
Equity |
29.15 |
29.15 |
29.15 |
29.2 |
29.2 |
58.4 |
58.4 |
58.4 |
|
Face Value |
1 |
1 |
1 |
1 |
1 |
1 |
1 |
1 |
|
Outstanding Shares |
5.85E+08 |
5.85E+08 |
5.85E+08 |
5.85E+08 |
5.85E+08 |
5.85E+08 |
5.85E+08 |
5.85E+08 |
|
EPS |
7.10 |
6.36 |
6.57 |
6.90 |
7.39 |
7.72 |
9.14 |
8.92 |
|
EPS TTM |
26.82 |
29.17 |
28.60 |
26.93 |
27.22 |
28.58 |
31.15 |
33.17 |
|
|
||||||||
|
EBIDTA Margin |
22.98% |
23.06% |
20.47% |
20.96% |
22.70% |
23.62% |
23.74% |
22.57% |
|
EBIT Margin |
19.86% |
19.94% |
18.34% |
18.28% |
20.02% |
20.83% |
20.90% |
19.76% |
|
PAT Margin |
14.22% |
12.80% |
12.00% |
12.74% |
12.91% |
13.51% |
15.27% |
14.40% |
|
Yearly Income Statement |
2013 |
2014 |
2015 |
2016 E |
2017 E |
2018 E |
|
Net Sales |
5783.12 |
8038.48 |
12043.23 |
13528.11 |
15827.89 |
18281.22 |
|
Other Income |
28.54 |
21.56 |
80.76 |
61.14 |
90.00 |
90.00 |
|
Other Operating Income |
72.19 |
61.31 |
77.29 |
231.42 |
250.00 |
275.00 |
|
Total Income |
5883.85 |
8121.35 |
12201.28 |
13820.67 |
15917.89 |
18371.22 |
|
Total Expenditure |
5129.67 |
6137.71 |
9556.90 |
10635.04 |
12227.05 |
13985.13 |
|
EBIDTA |
754.18 |
1983.64 |
2644.38 |
3185.63 |
3690.85 |
4386.09 |
|
Depreciation |
248.74 |
312.53 |
332.61 |
382.81 |
424.75 |
466.98 |
|
EBIT |
505.44 |
1671.11 |
2311.77 |
2802.82 |
3266.10 |
3919.11 |
|
Interest |
131.33 |
138.59 |
143.92 |
147.94 |
125.00 |
125.00 |
|
PBT |
374.11 |
1532.52 |
2167.85 |
2654.88 |
3141.10 |
3794.11 |
|
Tax |
82.71 |
363.45 |
596.60 |
716.29 |
813.54 |
859.94 |
|
Deferred Tax |
0.00 |
0.00 |
0.00 |
0.00 |
0.00 |
0.00 |
|
Profit After Tax |
291.40 |
1169.07 |
1571.25 |
1938.58 |
2327.55 |
2934.16 |
|
|
|
|||||
|
Equity |
29.12 |
29.15 |
29.2 |
58.4 |
58.4 |
58.4 |
|
Face Value |
1 |
1 |
1 |
1 |
1 |
1 |
|
Outstanding Shares |
585169586 |
585169586 |
585169586 |
585169586 |
585169586 |
585169586 |
|
EPS (Unit Curr.) |
13.32 |
20.04 |
26.93 |
33.17 |
39.78 |
50.14 |
|
PE |
- |
- |
24.05 |
22.61 |
18.86 |
14.96 |
|
|
|
|||||
|
EBIDTA Margin |
13.04% |
24.68% |
21.96% |
23.55% |
23.32% |
23.99% |
|
EBIT Margin |
8.74% |
20.79% |
19.20% |
20.72% |
20.64% |
21.44% |
|
PAT Margin |
5.00% |
14.44% |
12.91% |
14.04% |
14.62% |
15.97% |
INDUSTRY OUTLOOK
Global pharmaceutical market is in the midst of major discontinuities. While growth in developed markets will slow down, emerging markets will become increasingly important in the coming decade. The Indian pharmaceuticals market, along with the markets of China, Brazil and Russia, will spearhead growth within these markets.
Growth in input drivers in line with expectations in most cases
The Indian Pharmaceutical market (IPM) accounts for approx. 1.4% of the global pharmaceutical industry in value terms and 10% in the volume terms. The IPM is valued at Rs 860 bn for the year ending March 2015. The growth in 2015 stood at 12.9%. Owing to robust historical growth and future prospects, many MNC companies have active presence in the Indian pharma space.
The IPM is highly fragmented with about 24,000 players (330 in the organized sector). The top ten companies including domestic and MNC companies make up for more than a third of the market. The market is dominated majorly by branded generics, which constitutes nearly 70% to 80% of market.
Besides the domestic market, Indian pharma companies also have a large chunk of their revenues coming from exports. Major companies are focusing on the generics market in the US, Europe and semi-regulated markets; others are focusing on custom manufacturing for innovator companies. Biopharmaceuticals is also increasingly becoming an area of interest given the complexity in manufacture and limited competition.
The past few years have been glorious ones for the Indian companies, as major blockbusters lost their patent protection, paving way for generics. However, every passing year is leaving lower patented drug opportunities for the Indian companies for the launch of generics. Thus, Indian pharma companies have increased their R&D expenses. The companies are spending more to establish niche product portfolios for the future.
Indian pharma market expected to grow to $55 billion by 2020
CONCUSSION AND RECOMMENDATION
Improvement in execution, stabilization of margins, and cash flow improvement to remain key drivers for the stock. Faster approvals of new drugs from USFDA, sales in the US, and improvement in margins will drive revenue with CAGR 16% for FY16-FY18. We recommend BUY on the stock at a CMP of Rs. 750 to the target of Rs. 990 (Forward PE of 18.86x FY17).
RISKS AND CONCERNS
-
In various global markets, the government has been taking several cost-effective measures in order to bring down healthcare expenses. Thus, governments are focusing on the speedy introduction of generic drugs into the market. This too will benefit Indian pharma companies. However, despite a promising outlook, intense competition and consequent price erosion would continue to remain a cause for concern.
-
High and fragmented owing to many small players in the industry.
-
Distributors are increasingly pushing branded products in a bid to earn higher margins.
- Share :


Post a Comment
|
DISCLAIMER |
This report is only for the information of our customers. Recommendations, opinions, or suggestions are given with the understanding that readers acting on this information assume all risks involved. The information provided herein is not to be construed as an offer to buy or sell securities of any kind. ATS and/or its group companies do not as assume any responsibility or liability resulting from the use of such information.