Avenue Supermart Limited
KEY INFORMATION FOR AVENUE SUPERMART LIMITED
|
Date |
11-Dec-20 |
|
Market Price (INR) |
2622 |
|
52Week H/L |
2755/1700 |
|
Market Cap (INR Mn) |
16,98,465 |
|
Shares Outstanding (Mn) |
647.8 |
|
Industry |
Retail |
|
Recommendation |
Sell |
|
Target Price |
2,337 |
|
Upside/Downside |
-10.87% |
|
Key Financial |
FY20 |
FY21E |
FY22E |
FY23E |
|
Sales |
2,48,702 |
2,60,737 |
3,35,726 |
4,17,235 |
|
Growth (%) |
24.32% |
4.84% |
28.76% |
24.28% |
|
EBITDA |
21,283 |
20,116 |
28,329 |
37,410 |
|
Margin (%) |
8.56% |
7.71% |
8.44% |
8.97% |
|
PAT |
13,011 |
12,693 |
18,430 |
24,813 |
|
EPS |
20.55 |
19.92 |
28.93 |
38.95 |
|
Growth (%) |
44.17% |
-3.08% |
45.21% |
34.63% |
|
ROE (%) |
11.74% |
10.32% |
13.15% |
15.29% |
|
ROCE (%) |
15.35% |
9.88% |
12.74% |
14.88% |
|
EV/EBITDA(x) |
78.7x |
83.3x |
59.1x |
44.8x |
|
P/E(x) |
125.7x |
129.7x |
89.3x |
66.3x |
|
Share Holding Pattern (%) |
|
|
Promoter |
75.0% |
|
FIIs |
10.3% |
|
DIIs |
6.1% |
|
Others |
8.6% |
Not yet out of COVID impacts but recovering fast
D Mart’s sales declined by 12.3% YoY in Q2-F21 and 34% YoY in Q1-F21 mainly due to pandemic. Post lockdown, improvement in footfalls have witnessed significant improvement in Non-FMCG sales from last quarter, which is aiding faster recovery in margins.
Still King in Retail Segment?
D Mart is among few players to have mastered the Retail game via its strong execution strategy, store locations, and EDLC/EDLP focus. D Mart is King in offline retail segment through their execution strategy backed by strong management. E-commerce division, D Mart Ready, has to replicate offline Retail’s success into online Retail.
Available at a richly valued price
We estimate Revenue CAGR of 14%, EBITDA CAGR of 18%, and EPS CAGR of 22% over the FY19-23E. The stock currently trades at 66X of FY23E EPS, which we find to be a very rich valuation.
Avenue Supermart Limited - Company Profile
D-Mart was conceived by value investor Mr. Radhakishan Damani in 2000, operating a single store in Maharashtra. With a mission to be the lowest priced retailer in their operation area, D-Mart has grown steadily over the years and operates 220 stores. It follows a cluster-based expansion approach focusing on deepening penetration in the areas already present before expanding to newer regions.
Avenue Supermart Limited - MANAGEMENT PROFILE
|
Name |
Designation |
|
Ignatius Navil Noronha |
CEO, Director & MD |
|
Narayana Bhaskaran |
Chief Operating Officer |
|
Nildari Deb |
Chief Financial Officer |
|
Udaya Bhaskar Yarlagadda |
Chief Operating Officer |
|
Ashu Gupta |
Secretary & Compliance Officer |
|
Dheeraj Kampani |
Vice President |
|
Hitesh Shah |
Vice President |
AVENUE SUPERMART BOARD MEMBERS
|
Name |
Designation |
|
Ramesh Damani |
Chairman |
|
Chandrashekhar Bhave |
Independent Director |
|
Kalpana Unadkat |
Independent Director |
|
Manjri Chandak |
Non-Executive Director |
|
Elvin Machado |
Whole Time Director |
|
Ramakant Baheti |
Whole Time Director & Group CFO |
Not yet out of the COVID impacts but recovering fast
D Mart’s sales declined by 12.3% on YoY in Q2FY21, mainly due to the slow recovery in footfalls, partial local lockdowns, and subdued sales in general merchandise and apparel category. SSSG came in at -12.5% for stores that have been operating for more than two years. However, with relaxation in restrictions norms, the company has seen MoM improvement as the revenue dropped by 34% YoY in Q1FY21.
Company continued expanding its presence, added 8 new stores, and shut the 2 two stores in the first of FY21. We expect that store addition is likely to accelerate in the second half of FY21 on the back of a recent QIP of ~41 bn.
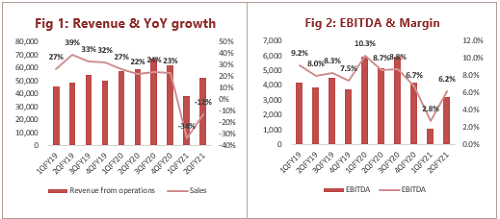
Faster Recovery in Margins
Gross Profit/EBITDA declined by 102/90 bps YoY and stood at 14.05% /6.2%. The impact was mainly due to lower sales and lower non-FMCG Mix due to pandemic led disruption. With more relaxation in restrictions and the resultant improvement in footfall; non-FMCG sales have witnessed significant improvement since last quarter, which is aiding faster recovery in margins.
Improvement seen in PAT Margins
PAT de-grew by ~37% YoY in Q2FY21 v/s de-growth of 85% YoY in Q1FY21 due to lower sales and margins. We expect that improvement in margin and lower- tax rates will support the growth. The company has repaid all their long term debt from recent QIP.
Still King in the Retail Segment?
The company is the dominant player in the offline retail segment via its execution strategy. Food and Grocery remain the value migration play in Retail, which provides a vast opportunity as a low single-digit share from organized retail players. Despite this enormous opportunity, most of the players have failed on execution like Future Retail. They are among few players who have mastered the game through their presence in key locations.
E-Commerce is a small part of their overall operations but aggression is visible with the launch of fulfillment centers and the extension of existing e-commerce. D Mart is getting ready to battle with E-commerce players like Big Basket, Jio Mart, Groffers, and Amazon Pantry. We believe the company would maintain their position in offline retailing. But heavy competition from players like Reliance and Spencer’s and willingness to take entry into Indian Retail industry like Wal-Mart may hurt the business witnessed in last 10 quarters.
Reliance Retail has also cracked the formula to serve both the retail segment offline and online. D Mart Ready has to ramp up their business if it has to replicate their offline success in E-commerce. We believe that the ecommerce platform and offline presence would drive the growth but not as compared to last 5 year’s growth which could be a crucial trigger for the PE re-rating.
|
SalesGrowth |
1QFY19 |
2QFY19 |
3QFY19 |
4QFY19 |
1QFY20 |
2QFY20 |
3QFY20 |
4QFY20 |
1QFY21 |
2QFY21 |
|
Spencer’sRetail |
3.6% |
14.7% |
8.1% |
5.9% |
5.9% |
-27.0% |
-13.3% |
|||
|
Reliance Retail |
123.75% |
121.47% |
89.26% |
51.61% |
47.53% |
27.33% |
27.41% |
4.22% |
-17.23% |
-0.25% |
|
Dmart |
26.7% |
38.9% |
33.1% |
32.1% |
26.8% |
22.1% |
23.9% |
23.0% |
-33.7% |
-12.3% |
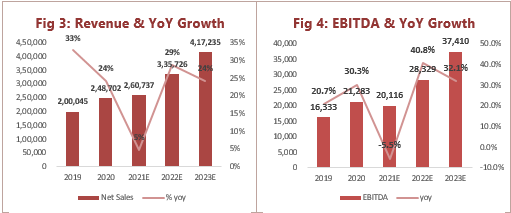
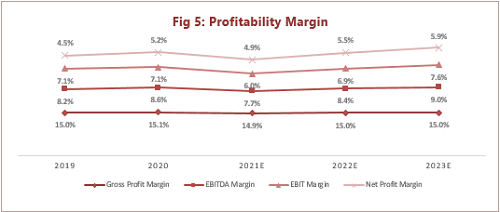
We build a sales projection with a CAGR of ~16% for F19-F23E and expect improvement in EBITDA margin to 9% in F23E from 8.2% in F19 on account of ramp up of D Mart Ready, Higher sales in offline retailing, and dominance presence in key location.
Improvement in Sales to lead Improved Return Ratio
We expect EBITDA to grow at an 18% CAGR due to higher revenue growth and a faster recovery in the second half. The EBITDA margin expands 80 bps to 9% in FY23E on the back of improvements in operating margins over FY20-23E.
We expect that gross margin would remain in the range of 14.8-15.1%. EBIT margin to increase by ~50 bps to 7.6% in F23E. Cash conversion cycle remains steady, which indicates a strong execution by the management.
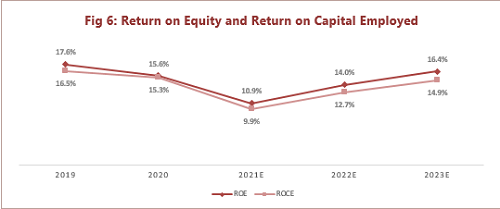
The Return on equity (RoE) declined to 15.6% in F20 from an average of 18% in F17-F19. We expect RoE to improve to 16.4% in F23E on account of faster recovery in margin and progress in MoM sales.
Outlook and Valuation
We expect that the faster recovery, improvement in sales, and strong execution drive business growth and project the sales with a CAGR of 16% for F19-F23E, which is lower than the growth CAGR of 24% F16-F20. We project that earnings remain healthy with a growth of 22% for F19-F23E which is lower than the growth of 29% on account of lower sales growth compared to previous years mainly due to heavy competition in offline and online Retail. Currently, the stock is trading at PE 66.3x EPS of F23E of INR 38.95, which we believe a rich valuation sees a healthy competitive landscape in the retail segment. We valued at PE of 60x F23E EPS arrived on the recommendation of SELL, with a price target of 2337, a downside of 10%.
Key Financials
|
Income Statement |
2019 |
2020 |
2021E |
2022E |
2023E |
|
Net Sales |
2,00,045 |
2,48,702 |
2,60,737 |
3,35,726 |
4,17,235 |
|
Purchase of stock in trade |
1,74,455 |
2,14,417 |
2,27,754 |
2,92,921 |
3,63,829 |
|
Change in inventory of stock in trade |
(4,447) |
(3,388) |
(5,736) |
(7,386) |
(9,179) |
|
Cost of materials |
1,70,008 |
2,11,029 |
2,22,018 |
2,85,535 |
3,54,650 |
|
Gross profit |
30,037 |
37,673 |
38,719 |
50,191 |
62,585 |
|
Employee costs |
3,554 |
4,561 |
5,197 |
5,860 |
6,625 |
|
Other expenses |
10,150 |
11,829 |
13,407 |
16,002 |
18,551 |
|
EBITDA |
16,333 |
21,283 |
20,116 |
28,329 |
37,410 |
|
Depreciation & amortisation |
2,125 |
3,744 |
4,404 |
5,044 |
5,696 |
|
EBIT |
14,208 |
17,539 |
15,711 |
23,285 |
31,714 |
|
Other income |
484 |
600 |
2,050 |
2,214 |
2,391 |
|
Finance charges |
472 |
691 |
726 |
762 |
800 |
|
Net Profit before tax |
14,219 |
17,448 |
17,036 |
24,737 |
33,305 |
|
Less: Current tax, FBT |
5,195 |
4,438 |
4,344 |
6,308 |
8,493 |
|
Tax Rate |
0 |
0 |
0 |
0 |
0 |
|
Minority and associates |
1 |
1 |
1 |
1 |
1 |
|
PAT |
9,025 |
13,011 |
12,693 |
18,430 |
24,813 |
|
EPS (period end) |
14.5 |
20.7 |
20.2 |
29.3 |
39.3 |
|
Balance Sheet |
2019 |
2020 |
2021E |
2022E |
2023E |
|
Freehold Land |
16,212 |
22,629 |
25,602 |
30,043 |
34,610 |
|
Leasehold Land |
4,070 |
- |
- |
- |
- |
|
Building |
21,160 |
27,123 |
29,770 |
33,568 |
37,401 |
|
Others |
7,134 |
9,551 |
10,784 |
12,595 |
14,423 |
|
Gross tangible assets |
48,576 |
59,303 |
66,156 |
76,207 |
86,434 |
|
Less: Accumulated depreciation |
(5,835) |
(8,229) |
(12,419) |
(17,261) |
(22,770) |
|
Net Tangible assets |
42,740 |
51,074 |
53,737 |
58,946 |
63,664 |
|
Right Use of Assets |
- |
7,173 |
7,173 |
7,173 |
7,173 |
|
Gross intangible assets |
1,304 |
1,397 |
1,445 |
1,515 |
1,585 |
|
Less: Accumulated amortization |
(222) |
(329) |
(544) |
(745) |
(933) |
|
Net Intangible assets |
1,082 |
1,068 |
901 |
769 |
652 |
|
Capital WIP (Tangible) |
3,768 |
3,644 |
3,644 |
3,644 |
3,644 |
|
Non-Current Investments |
181 |
165 |
165 |
165 |
165 |
|
Long term loans and advances |
324 |
31,309 |
31,309 |
31,309 |
31,309 |
|
Other non-current assets |
1,136 |
2,854 |
2,854 |
2,854 |
2,854 |
|
Cash |
2,191 |
1,079 |
14,668 |
25,521 |
41,523 |
|
Trade Receivables |
644 |
196 |
440 |
566 |
704 |
|
Inventory |
16,087 |
19,474 |
18,700 |
24,042 |
29,852 |
|
ST loans and advances |
756 |
1,237 |
1,361 |
1,497 |
1,647 |
|
Other current assets |
1,149 |
1,491 |
1,640 |
1,804 |
1,985 |
|
Total current assets |
20,826 |
23,477 |
36,809 |
53,431 |
75,710 |
|
Total assets |
70,057 |
1,20,765 |
1,36,593 |
1,58,292 |
1,85,172 |
|
Short term borrowings |
3,042 |
37 |
37 |
37 |
37 |
|
ST Lease Liabilities |
- |
744 |
744 |
744 |
744 |
|
Trade Payables |
4,633 |
4,335 |
4,723 |
6,082 |
7,564 |
|
Other current liabilities |
4,467 |
1,991 |
2,190 |
2,409 |
2,650 |
|
Short term provisions |
128 |
152 |
152 |
152 |
152 |
|
Current liabilities |
12,269 |
7,258 |
7,846 |
9,424 |
11,147 |
|
Long term borrowings |
1,257 |
- |
3,000 |
6,000 |
9,000 |
|
LT Lease Liabilities |
- |
2,211 |
2,211 |
2,211 |
2,211 |
|
Deferred tax liabilities |
633 |
474 |
474 |
474 |
474 |
|
Other long term liabilities |
18 |
20 |
20 |
20 |
20 |
|
Total liabilities |
14,177 |
9,963 |
13,550 |
18,128 |
22,851 |
|
Share Capital |
6,241 |
6,478 |
6,478 |
6,478 |
6,478 |
|
Reserves and surplus |
49,634 |
1,04,320 |
1,16,561 |
1,33,682 |
1,55,839 |
|
Minority Interest |
6 |
5 |
5 |
5 |
5 |
|
Total capital and liabilities |
70,057 |
1,20,765 |
1,36,593 |
1,58,292 |
1,85,172 |
|
Cash Flow statement |
2019 |
2020 |
2021E |
2022E |
2023E |
|
Net Profit before tax |
14,219 |
17,448 |
17,036 |
24,737 |
33,305 |
|
Depreciation & Amortisation |
2,125 |
3,744 |
4,404 |
5,044 |
5,696 |
|
Finance Costs |
472 |
691 |
726 |
762 |
800 |
|
Others |
(224) |
(395) |
- |
- |
- |
|
CFO before WC changes |
16,593 |
21,488 |
22,166 |
30,543 |
39,801 |
|
Increase/(Decrease) in payables |
1,460 |
(298) |
389 |
1,359 |
1,482 |
|
Increase/(Decrease) in other liabilities |
(198) |
191 |
199 |
219 |
241 |
|
(Increase)/ Decrease in debtors |
(309) |
448 |
(244) |
(127) |
(138) |
|
(Increase)/ Decrease in inventory |
(4,452) |
(3,388) |
774 |
(5,342) |
(5,810) |
|
(Increase)/ Decrease in other assets |
(7) |
(716) |
(273) |
(300) |
(330) |
|
WC changes |
(3,507) |
(3,762) |
844 |
(4,191) |
(4,555) |
|
Taxes Paid |
(5,018) |
(4,924) |
(4,344) |
(6,308) |
(8,493) |
|
Cash Flow from operations |
8,068 |
12,801 |
18,666 |
20,044 |
26,754 |
|
Investments sold/(purchased) |
3,991 |
2,216 |
- |
- |
- |
|
Divestments |
- |
- |
- |
- |
- |
|
Capex |
(14,168) |
(17,122) |
(6,900) |
(10,121) |
(10,297) |
|
Others |
(3,393) |
(31,660) |
- |
- |
- |
|
Cash flow from investment |
(13,569) |
(46,566) |
(6,900) |
(10,121) |
(10,297) |
|
Equity issued |
- |
41,869 |
- |
- |
- |
|
Dividend Paid |
- |
- |
(450) |
(1,308) |
(2,655) |
|
Debt raised/(paid) |
2,600 |
(7,613) |
3,000 |
3,000 |
3,000 |
|
Interest income |
- |
- |
- |
- |
- |
|
Finance Costs |
(510) |
(682) |
(726) |
(762) |
(800) |
|
Cash flow from finance |
2,090 |
33,574 |
1,824 |
930 |
(455) |
|
Net increase/(decrease) in cash |
(3,411) |
(190) |
13,589 |
10,853 |
16,001 |
|
Cash at the beginning of the year |
5,602 |
2,191 |
1,079 |
14,668 |
25,521 |
|
Cash at the end of the year |
2,191 |
2,001 |
14,668 |
25,521 |
41,523 |
|
Key Ratio |
2019 |
2020 |
2021E |
2022E |
2023E |
|
EPS |
14.5 |
20.7 |
20.2 |
29.3 |
39.3 |
|
Gross Profit Margin |
15.0% |
15.1% |
14.9% |
15.0% |
15.0% |
|
EBITDA Margin |
8.2% |
8.6% |
7.7% |
8.4% |
9.0% |
|
EBIT Margin |
7.1% |
7.1% |
6.0% |
6.9% |
7.6% |
|
Net Profit Margin |
4.5% |
5.2% |
4.9% |
5.5% |
5.9% |
|
ROE |
17.6% |
15.6% |
10.9% |
14.0% |
16.4% |
|
ROCE |
16.5% |
15.3% |
9.9% |
12.7% |
14.9% |
|
Inventory days |
30 |
31 |
31 |
31 |
31 |
|
Receivable days |
1 |
1 |
1 |
1 |
1 |
|
Payable days |
8 |
8 |
8 |
8 |
8 |
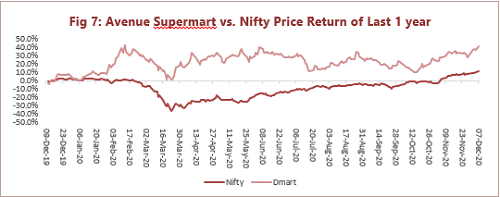
Avenue Supermart Limited - Stock Performance
- Share :


Post a Comment
|
DISCLAIMER |
This report is only for the information of our customers. Recommendations, opinions, or suggestions are given with the understanding that readers acting on this information assume all risks involved. The information provided herein is not to be construed as an offer to buy or sell securities of any kind. ATS and/or its group companies do not as assume any responsibility or liability resulting from the use of such information.