BHARAT HEAVY ELECTRICALS LIMITED
Bharat Heavy Electricals Limited - COMPANY PROFILE
Bharat Heavy Electricals Limited (BHEL) is an integrated power plant equipment manufacturer and one of the largest engineering and manufacturing companies in India in terms of turnover.
Bharat Heavy Electricals Limited (BHEL) manufactures a wide range of products and services for the core sectors of the Indian economy, including power, transmission, industry, transportation, renewable energy, oil & gas and defence. Bharat Heavy Electricals Limited (BHEL) has been earning profits continuously since 1971-72 and paying dividends since 1976-77. BHEL undertakes all jobs related to the construction, designing, engineering and testing of its products all the way to commissioning and servicing. The Company currently operates at more than 150 project sites across In- dia and abroad and has a wide presence with 16 manufacturing divisions, 2 repair units, eight service centres, eight overseas offices, 7 joint ventures and 15 regional centres.
Bharat Heavy Electricals Limited (BHEL) accounts for 59% of the total installed capacity of around 1,80,000 MW in the utility sector across India as of 31 March 2012 and it accounted for approximately 69% of the total electricity generated during the year 2011-12. BHEL’s global references are spread across 75 countries. The cumulative overseas installed capacity of Bharat Heavy Electricals Limited (BHEL) manufactured power plants exceeds 9,000 MW across 21 countries
Bharat Heavy Electricals Limited - STOCK INFORMATION
|
STOCK PRICE |
276 |
|
TARGET PRICE |
285-295 |
|
SECTOR |
INFRASTRUCTURE |
|
SYMBOL (AT NSE) |
BHEL |
|
ISIN |
INE257A01026 |
|
FACE VALUE (IN RS.) |
2.00 |
|
BSE CODE |
500103 |
Bharat Heavy Electricals Limited - STOCK FUNDAMENTALS
|
MARKET CAP |
67,357.95 |
|
BOOK VALUE |
135.02 |
|
EPS - (TTM) (IN RS. CR.) |
9.71 |
|
P/E |
28.34 |
|
INDUSTRY P/ESHAREHOLDING PATTERN |
20.54 |
Bharat Heavy Electricals Limited - INVESTMENT RATIONALE
Bharat Heavy Electricals Limited (BHEL) is strongly exposed to cyclical factors: i) Contribution margins at ~42% vs EBIDTA margin of 12% (adjusted) in FY14, leading to a meaningful operating leverage ii) Core NWC stable at 200 days; cyclical factors of Retention money (at 181 days in FY14 vs 55-60 days in FY07-09) and customer advances (deteriorated from 63% of revenues in FY09 to 38% in FY14) that impacted reported NWC are expected to normalize, as we expect BTB to increase from 2.6x currently to 3x in FY15. We expect Operating Cash Flows to improve from average of ~INR20b in FY10-13 to INR77b in FY15/16E.
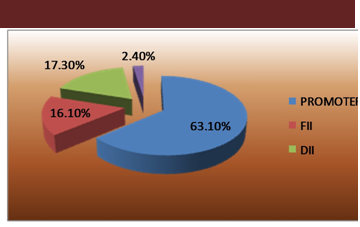
Bharat Heavy Electricals Limited - SHAREHOLDING PATTERN
OUTLOOK AND VALUATION
Net cash is likely to increase from INR92b in FY14 to INR252b in FY17E (~46% of current market cap). Even in FY14, operating cash flow had improved to INR54.2b vs INR24.4b in FY13. We expect BHEL to report EPS of INR10.2 in FY15E/ INR14.6 in FY16E / INR19.5 in FY17E. At the CMP, the stock quotes at PER of 21.6x FY15E / 15.1x FY16 / 11.3x FY17E. We maintain Buy with a price target of INR 295/sh (PER of 20x FY16E.
RESULTS (Quarterly )(Rs CR.)
|
|
DEC' 14 |
SEP' 14 |
JUN' 14 |
MAR 14 |
DEC' 13 |
|
Sales |
6,197.96 |
6,144.02 |
5,154.97 |
15,031.5 |
8,634.85 |
|
Operat- ing profit |
293.80 |
291.55 |
217.92 |
2,733.38 |
985.94 |
|
Interest |
5.23 |
12.62 |
47.27 |
47.93 |
32.28 |
|
Gross profit |
562.67 |
475.05 |
518.44 |
2,974.32 |
1,244.44 |
|
EPS (Rs) |
0.87 |
0.51 |
0.79 |
7.54 |
2.84 |
TECHNICAL VIEW
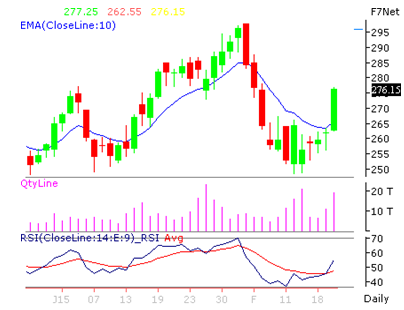
Bharat Heavy Electricals Limited (BHEL) is looking strong on charts. We advise to buy around 265-275 with stoploss of 248 for the targets of 285-295 levels. RSI is also showing upside momentum in it on daily charts.
|
SYMBOL |
VALUE |
ACTION |
|
RSI(14) |
73.736 |
BUY |
|
STOCH(9,6) |
82.686 |
OVERBOUGHT |
|
STOCHRSI(14) |
90.756 |
OVERBOUGHT |
|
MACD(12,26) |
4.080 |
BUY |
|
ADX(14) |
45.578 |
BUY |
|
WILLIAMS %R |
-4.381 |
OVERBOUGHT |
|
CCI(14) |
123.0701 |
BUY |
|
ATR(14) |
3.2393 |
HIGH VOLATILITY |
|
HIGH/LOWS(14) |
7.3893 |
BUY |
|
ULTIMATE OSCILLATOR |
69.794 |
BUY |
|
ROC |
5.947 |
BUY |
|
BULL/BEAR POWER()13 |
12.5260 |
BUY |
|
BUY: 8 SELL:0 NEUTRAL: 3 |
SUMMARY : STRONG BUY |
Our Other Recommendation for Next Week
|
SCRIP |
ACTION |
CMP |
ENTRY |
SL |
TGT |
TIME FRAME |
|
APOLLO HOSP |
BUY |
1341.05 |
1320-1345 |
1295 |
1375-1420 |
ONE WEEK |
|
DIVIS LAB |
BUY |
1694.55 |
1680-1700 |
1650 |
1740-1790 |
ONE WEEK |
|
HCL TECH |
SELL |
2005.90 |
2000-2025 |
2060 |
1960-1920 |
ONE WEEK |
|
CROMPTON GREAVES |
BUY |
180.45 |
175-180 |
170 |
185-190 |
ONE WEEK |
|
APOLLO TYRE |
SELL |
183.60 |
185-188 |
192 |
182-178 |
ONE WEEK |
Performance of Previous Week
|
SCRIP |
LOT |
ACTION |
ENTRY |
SL |
TGT |
P&L |
REMARK |
CLOSE/LOW/HIGH |
|
ITC |
1000 |
BUY |
370-375 |
360 |
380-395 |
25000.00 |
BOTH TGT HIT |
396.50 / 402.50 |
|
BANK OF INDIA |
1000 |
SELL |
250-255 |
265 |
240-225 |
25000.00 |
BOTH TGT HIT |
239.45 / 225.45 |
|
UNION BANK |
1000 |
SELL |
190-195 |
200 |
185-180 |
10000.00 |
BOTH TGT HIT |
180.45 / 173.15 |
|
PFC |
1000 |
BUY |
278-282 |
274 |
286-290 |
-4000.00 |
SL TRG |
278.95 / 270.25 |
|
GLENMARK |
500 |
BUY |
740-750 |
720 |
770-790 |
25000.00 |
BOTH TGT HIT |
787.90 / 799.90 |
|
MOTHERSON SUMI |
500 |
SELL |
430-440 |
450 |
420-405 |
-5000.00 |
SL TRG |
478.05/ 432.95 |
|
NET PROFIT |
|
|
|
|
|
76000.00 |
|
|
- Share :


Post a Comment
|
DISCLAIMER |
This report is only for the information of our customers. Recommendations, opinions, or suggestions are given with the understanding that readers acting on this information assume all risks involved. The information provided herein is not to be construed as an offer to buy or sell securities of any kind. ATS and/or its group companies do not as assume any responsibility or liability resulting from the use of such information.