Biocon Ltd.
|
Current price |
488.80 |
|
Sector |
Pharma |
|
No of shares |
200000000 |
|
52 week high |
553.70 |
|
52 week low |
402.45 |
|
BSE Sensex |
29044.44 |
|
Nifty |
8834.00 |
|
Average Volume |
694466 |
|
BSE Code |
532523 |
|
NSE Symbol |
BIOCON |
Biocon Ltd - Company Overview
Biocon Limited was set up in the year 1978 as a joint venture between Biocon Biochemicals Limited of Ireland and an Indian entrepreneur, Kiran Mazumdar-Shaw. Biocon is a fully integrated biopharmaceutical company focused on biopharmaceuticals, customized research and clinical research. The Company has developed a robust drug pipeline and offers active pharmaceutical ingredients (APIs), including cardiovascular agents, anti- obesity agents, oral anti-diabetic agents, anti-inflammatory agents and digestive-aid enzymes.
Biocon's presence in the chronic disease segment in India is represented by over 80 brands spread across seven therapeutic segments Diabetology, Oncotherapeutic, Nephrology, Cardiology, Immunotherapy, Comprehensive Care and Bioproducts. Unlike most pharma companies that are chemical based, Biocon Limited has carved out its niche in the more complex biotechnology field. Over the decades, Biocon Ltd has successfully evolved into aned emerging global biopharma enterprise, serving its partners and customers in over 75 countries. The Company has strategic alliances with well known pharmaceutical companies including Mylan Inc, Amylin Pharmaceuticals, Inc, DuPont, Bristol-Myers Squibb, Endo Pharmaceuticals, IATRICa Inc, Neopharma, and Vaccinex, Inc. The Company also has commercial and marketing agreements with Pfizer and Ferozsons Laboratories Limited, and licensing agreement with Abraxis BioScience, Inc, as well as strategic collaboration for insulin products with Mylan, Inc.
Biocon Limited operates through five broad business verticals small molecules, research services, branded formulations, biosimilars and novel molecules. However, for reporting purpose, Biocon Ltd classifies its operations into two segments i.e. biopharma and research services. While biopharma comprises ~75% of overall sales, services account for the rest of the pie. Except for research services, all other business verticals have been grouped under the biopharma category. The Company’s brands include Herceptin, Enbrel, MabThera, Remicade, Lantus, Humalog and NovoLog. The current market capitalisation stands at Rs 9,450.00 crore.
Biocon Ltd - Share Holding Pattern
|
Category |
No. of Shares |
Percentage |
|
Promoters |
80,847,694 |
40.42 |
|
Foreign Promoters |
41,200,752 |
20.60 |
|
General Public |
24,905,938 |
12.45 |
|
Foreign Institutions |
21,460,044 |
10.73 |
|
Financial Institutions |
9,815,657 |
4.91 |
|
Others |
8,378,333 |
4.19 |
|
NBFC and Mutual Funds |
6,930,213 |
3.47 |
|
Other Companies |
5,291,631 |
2.65 |
|
Foreign - NRI |
1,169,738 |
0.58 |
Biocon Ltd - Financial Details
-
Market Cap (Rs Cr) – 6569.00
-
Company P/E (x) – 23.91
-
Industry P/E (x) – 30.10
-
Book Value (Rs) – 120.84
-
Price / BV (x) – 3.96
-
Dividend (%) – 100 %
-
EPS (TTM) – 20.01
-
Dividend Yield (%) – 1.05%
-
Face Value (Rs) – 5
Industry Overview
The Indian pharmaceuticals market is third largest in terms of volume and thirteen largest in terms of value, as per a pharmaceuticals sector analysis report by equity master. The Indian pharmaceutical industry is estimated to grow at 20 per cent compound annual growth rate (CAGR) over the next five years, as per India Ratings, a Fitch Group company. The domestic pharma market is expected to grow at 10-12 per cent in FY15 as compared to 9 per cent in FY14, as per a recent report from Centrum Broking. The domestic pharma growth rate was 11.9 per cent in October 2014, highlighted the report.
Biopharma is the largest sector contributing about 62 per cent of the total revenue, with revenue generation to the tune of over Rs 12,600 crore (US$ 2.03 billion). The bio-pharma sector comprises vaccines, therapeutics and diagnostics. Biopharma is the largest sector contributing about 62 per cent of the total revenue, with revenue generation to the tune of over Rs 12,600 crore (US$ 2.03 billion). The bio-pharma sector comprises vaccines, therapeutics and diagnostics.
Also, growing at an average rate of about 20 per cent, India's biotechnology industry comprising bio- pharmaceuticals, bio-services, bio-agriculture, bio-industry and bioinformatics may reach the US$ 7 billion mark by the end of FY15, according to an industry body. Biopharma is the largest sector contributing about 62 per cent of the total revenue, with revenue generation to the tune of over Rs 12,600 crore (US$ 2.03 billion). The bio-pharma sector comprises vaccines, therapeutics and diagnostics.
The Indian pharma market size is expected to grow to US$ 85 billion by 2020. The growth in Indian domestic market will be on back of increasing consumer spending, rapid urbanisation, raising healthcare insurance and so on. Going forward, better growth in domestic sales will depend on the ability of companies to align their product portfolio towards chronic therapies for diseases such as such as cardiovascular, anti-diabetes, anti- depressants and anti-cancers are on the rise.
Balance Sheet
|
|
Mar '14 |
Mar '13 |
Mar '12 |
Mar '11 |
Mar '10 |
|
Sources Of Funds |
|
|
|
|
|
|
Total Share Capital |
100.00 |
100.00 |
100.00 |
100.00 |
100.00 |
|
Equity Share Capital |
100.00 |
100.00 |
100.00 |
100.00 |
100.00 |
|
Reserves |
2,317.70 |
2,106.80 |
1,995.50 |
1,845.86 |
1,465.34 |
|
Networth |
2,417.70 |
2,206.80 |
2,095.50 |
1,945.86 |
1,565.34 |
|
Secured Loans |
81.50 |
28.20 |
5.60 |
74.06 |
89.68 |
|
Unsecured Loans |
25.90 |
89.10 |
141.70 |
94.57 |
102.12 |
|
Total Debt |
107.40 |
117.30 |
147.30 |
168.63 |
191.80 |
|
Total Liabilities |
2,525.10 |
2,324.10 |
2,242.80 |
2,114.49 |
1,757.14 |
|
Application Of Funds |
|
|
|
|
|
|
Gross Block |
1,707.00 |
1,438.80 |
1,197.10 |
1,105.91 |
1,020.21 |
|
Less: Revaluation Reserves |
0.00 |
0.00 |
0.90 |
0.95 |
0.95 |
|
Less: Accum. Depreciation |
757.70 |
587.40 |
512.10 |
426.22 |
341.81 |
|
Net Block |
949.30 |
851.40 |
684.10 |
678.74 |
677.45 |
|
Capital Work in Progress |
101.80 |
51.20 |
113.80 |
103.29 |
58.33 |
|
Investments |
493.20 |
619.00 |
657.00 |
485.82 |
418.64 |
|
Inventories |
357.60 |
358.90 |
340.40 |
274.74 |
244.80 |
|
Sundry Debtors |
494.60 |
427.00 |
445.00 |
418.10 |
383.64 |
|
Cash and Bank Balance |
204.20 |
179.20 |
37.80 |
185.20 |
77.11 |
|
Total Current Assets |
1,056.40 |
965.10 |
823.20 |
878.04 |
705.55 |
|
Loans and Advances |
617.80 |
526.50 |
543.10 |
412.41 |
407.33 |
|
Fixed Deposits |
0.00 |
0.00 |
2.20 |
25.03 |
0.01 |
|
Total CA, Loans & Advances |
1,674.20 |
1,491.60 |
1,368.50 |
1,315.48 |
1,112.89 |
|
Current Liabilities |
529.50 |
471.40 |
431.80 |
358.64 |
426.92 |
|
Provisions |
163.90 |
217.70 |
148.80 |
110.19 |
83.25 |
|
Total CL & Provisions |
693.40 |
689.10 |
580.60 |
468.83 |
510.17 |
|
Net Current Assets |
980.80 |
802.50 |
787.90 |
846.65 |
602.72 |
|
Miscellaneous Expenses |
0.00 |
0.00 |
0.00 |
0.00 |
0.00 |
|
Total Assets |
2,525.10 |
2,324.10 |
2,242.80 |
2,114.50 |
1,757.14 |
|
Contingent Liabilities |
781.50 |
447.10 |
204.40 |
154.90 |
261.74 |
|
Book Value (Rs) |
120.89 |
110.34 |
104.78 |
97.29 |
78.27 |
Profit and Loss Account
|
|
Mar '14 |
Mar '13 |
Mar '12 |
Mar '11 |
Mar '10 |
|
Income |
|
|
|
|
|
|
Sales Turnover |
2,202.50 |
1,938.00 |
1,605.30 |
1,365.29 |
1,158.35 |
|
Excise Duty |
0.00 |
0.00 |
50.00 |
38.96 |
29.90 |
|
Net Sales |
2,202.50 |
1,938.00 |
1,555.30 |
1,326.33 |
1,128.45 |
|
Other Income |
60.60 |
37.60 |
66.60 |
293.00 |
94.70 |
|
Stock Adjustments |
-1.30 |
17.90 |
41.40 |
27.84 |
38.95 |
|
Total Income |
2,261.80 |
1,993.50 |
1,663.30 |
1,647.17 |
1,262.10 |
|
Expenditure |
|
|
|
|
|
|
Raw Materials |
991.50 |
915.70 |
818.90 |
694.62 |
608.77 |
|
Power & Fuel Cost |
161.50 |
142.40 |
97.70 |
81.63 |
67.25 |
|
Employee Cost |
266.40 |
227.60 |
191.50 |
145.43 |
99.84 |
|
Other Manufacturing Expenses |
0.00 |
0.00 |
19.00 |
16.29 |
12.32 |
|
Selling and Admin Expenses |
0.00 |
0.00 |
120.40 |
86.62 |
105.37 |
|
Miscellaneous Expenses |
308.50 |
264.50 |
15.70 |
12.38 |
10.60 |
|
Total Expenses |
1,727.90 |
1,550.20 |
1,263.20 |
1,036.97 |
904.15 |
|
Operating Profit |
473.30 |
405.70 |
333.50 |
317.20 |
263.25 |
|
PBDIT |
533.90 |
443.30 |
400.10 |
610.20 |
357.95 |
|
Interest |
0.90 |
1.20 |
1.70 |
2.38 |
1.99 |
|
PBDT |
533.00 |
442.10 |
398.40 |
607.82 |
355.96 |
|
Depreciation |
124.40 |
95.10 |
94.00 |
90.70 |
79.73 |
|
Profit Before Tax |
408.60 |
347.00 |
304.40 |
517.12 |
276.23 |
|
Extra-ordinary items |
5.50 |
0.00 |
0.00 |
0.00 |
0.00 |
|
PBT (Post Extra-ord Items) |
414.10 |
347.00 |
304.40 |
517.12 |
276.23 |
|
Tax |
84.20 |
71.30 |
48.90 |
57.87 |
27.87 |
|
Reported Net Profit |
329.90 |
275.70 |
255.50 |
459.25 |
248.36 |
|
Total Value Addition |
736.40 |
634.50 |
444.30 |
342.35 |
295.38 |
|
Equity Dividend |
100.00 |
150.00 |
100.00 |
90.00 |
70.00 |
|
Corporate Dividend Tax |
17.00 |
25.50 |
16.20 |
9.08 |
7.41 |
|
Per share data (annualised) |
|
|
|
|
|
|
Shares in issue (lakhs) |
2,000.00 |
2,000.00 |
2,000.00 |
2,000.00 |
2,000.00 |
|
Earning Per Share (Rs) |
16.50 |
13.79 |
12.78 |
22.96 |
12.42 |
|
Equity Dividend (%) |
100.00 |
150.00 |
100.00 |
90.00 |
70.00 |
Dividend and Bonus History
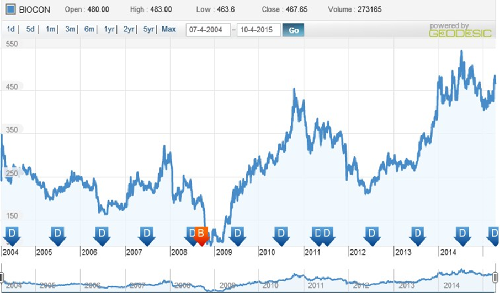
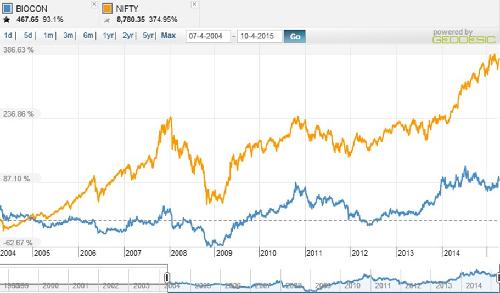
Index and Company Price Movement Comparison
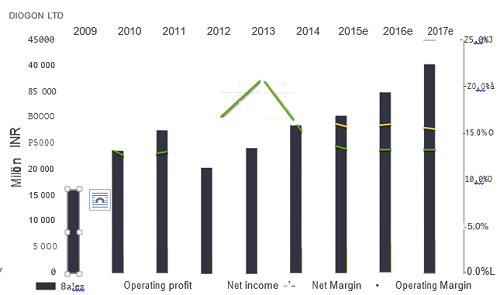
Company Forecast
Technical Indicators
|
Name |
Value |
Action |
|
RSI(14) |
63.786 |
Buy |
|
STOCH(9,6) |
79.697 |
Buy |
|
STOCHRSI(14) |
71.830 |
Buy |
|
MACD(12,26) |
12.200 |
Buy |
|
ADX(14) |
36.438 |
Buy |
|
Williams %R |
-16.138 |
Overbought |
|
CCI(14) |
78.8891 |
Buy |
|
ATR(14) |
16.6250 |
High Volatility |
|
Highs/Lows(14) |
14.4714 |
Buy |
|
Ultimate Oscillator |
46.518 |
Sell |
|
ROC |
10.135 |
Buy |
|
Bull/Bear Power(13) |
27.7960 |
Buy |
Important Ratios (YoY)
-
PBIT – 15.41 v/s 15.61
-
RoCE – 16.21 v/s 15.58
-
RoE – 14.40 v/s 18.90
-
Net Profit Margin – 14.57 v/s 13.85
-
Return on net worth – 13.64 v/s 12.49
-
D/E Ratio – 0.04 v/s 0.05
-
Interest Cover – 455.00 v/s 301.75
-
Current Ratio – 1.95 v/s 1.88
-
Reserves – 2317.70 cr v/s 2206.80 cr
-
PAT – 329.90 cr v/s 275.70 cr
-
Total assets – 2525.10 cr v/s 1938.00 cr
-
Net sales – 2202.50 cr v/s 1938.00 cr
-
Book Value – 120.89 cr v/s 110.34 cr
Simple Moving Average
|
Days |
BSE |
NSE |
|
30 |
441.98 |
442.06 |
|
50 |
435.60 |
435.70 |
|
150 |
450.38 |
450.46 |
Investment Rationalize
-
Biocon is the India largest biological company with over 80 brands spread across seven therapeutic segments with 528 Patents and 329 Trade Marks for its products.
-
Company is the proven player in its most of the product in biotechnology segment which add on to the advantage of early entrance to the market along with good research and development back up for the pharma products.
-
It has products for Diabetology, Oncotherapeutic, Nephrology, Cardiology, Immunotherapy, Comprehensive Care and Bioproducts which will help the company to tap the demand and capitalize on the demand for these products segment too.
-
The debt of the company is being reduced by the management substantially along with its effective business model ensures quick and positive cash flow.
-
Revenue of the company is growing at CAGR of 14.3% in the past five years along with sustaining a Net Profit Margin of 14.7% and Reserves of the company stands at Rs.2317.70 crore.
-
Income from Biosimilars and CRAMS will help the company to increase the profits in a substantial manner along with the acquisitions of the company and launching of new products.
-
Getting of patents and incenses from Europe and America for its products along with future forecast of the health and diseases of people in India and abroad will add to the growth prospects of the company.
-
Collaborations with worlds leading pharma players from more than 75 nations will help the company to add the companies advantage over its competitors along with its India centric approach will help the company to reduce external interventions.
- Share :


Post a Comment
|
DISCLAIMER |
This report is only for the information of our customers. Recommendations, opinions, or suggestions are given with the understanding that readers acting on this information assume all risks involved. The information provided herein is not to be construed as an offer to buy or sell securities of any kind. ATS and/or its group companies do not as assume any responsibility or liability resulting from the use of such information.