Chalet Hotels Ltd
|
Industry |
Price Band (Rs) |
Recommendation |
|
Hotels |
Rs.275-280 |
Avoid |
Chalet Hotels Ltd - Outlook and Valuation
We believe Chalet Hotel’s steep valuation is not justified. With losses in three of the last five years, Chalet looks to be a risky proposition as a turn around story. With high leverage, the hotel has seen considerable debt-related stressed asset sales, including pre completed projects owing to high costs of funding in the industry. The company’s debt level stood at 2,499 crore and the company intends to use 950 crore from the primary capital to repay debt, bringing it down to 1,549.8 crore. We recommend investors to AVOID Chalet Hotels Ltd IPO due to a expensive valuation and structural challenges.
|
Subscription Dates |
Jan 29-31, 2019 |
|
Price Band |
Rs 275 to Rs 280 per share. |
|
Issue Type |
Book built issue IPO |
|
Issue Size |
1690 Crores |
|
IPO open/close |
29th-31st January |
|
Lot Size |
53 shares |
|
Minimum bid |
53 shares |
|
Face Value |
Rs.10 per share |
|
Listing On |
BSE, NSE |
|
Listing Date |
11th February |
|
Allocation |
|
|
Retail Allocation |
35% |
|
QIB |
50% |
|
Non-Institutional |
15% |
Chalet Hotels Ltd - Company Background
Chalet Hotels Ltd are the owners, developer and asset manager of high-end hotels in key metro cities in India. Their hotel platform comprises five operating hotels, including a hotel with a co-located serviced residence, located in the Mumbai Metropolitan Region, Hyderabad and Bengaluru, representing 2,328 keys, as of September 30, 2018. Their hotels are branded with globally recognized hospitality brands and are in the luxury-upper upscale and upscale hotel segments.
Their hotel platform emphasizes strategic locations, efficient design and development, appropriate positioning in hotel segments together with branding and operational tie-ups with leading hospitality companies. They use their experience to actively manage the hotel assets to drive performance. In addition, they have developed commercial and retail spaces, in close proximity to certain of their hotels.
The Company follows an active asset management model for the hotels operated by third parties, pursuant to which it closely monitors, and exercise regular oversight over, the performance of the hotel properties.
About the Issue
The company plans to raise about Rs 950 crore by fresh equity issuance and the promoter group plans to offload shares worth another Rs 700 crore in the IPO, between the price range Rs. 183 - 185 per share.
Purpose of the Issue
The purpose of this IPO is to repayment/prepayment of certain indebtedness and for general corporate purposes.
Company Promoters
The Promoters of the company are Mr. Ravi C Raheja, Mr. Neel C Raheja and K Raheja Corp Pvt Ltd. The Promoters hold Equity Shares, which constitute to 100% of the Company’s pre-Offer paid-up Equity Share capital.
Risks and Concerns
-
A slowdown in economic growth in India could have an adverse effect on their business, results of operations and financial condition.
-
They utilize the brands of third party licensors, and rely on third parties for the quality of services at their hotels. Any adverse impact on the reputation of their hotels or a failure of quality control systems at their hotels could adversely affect their business, results of operations and financial condition.
-
They have entered into hotel operation and related agreements with Marriott to receive operational and marketing services in relation to their hotels. If their hotel operators decide to terminate or not renew any agreement with them, their business, financial condition and results of operations may be adversely affected.
-
A significant portion of their revenues is derived from a few hotels and from hotels concentrated in a few geographical regions and any adverse developments affecting such hotels or regions could have an adverse effect on their business, results of operations and financial condition.
-
Their business is subject to seasonal and cyclical variations that could result in fluctuations in their results of operations.
-
Some of their Group Companies have incurred losses in the last preceding financial year and have negative net worth, based on the last audited financial statements available.
-
They are exposed to risks associated with the development of their hotel properties and commercial and retail projects. Delays in the constructions of new buildings or improvements on their properties may have an adverse effect on their business, results of operations and financial condition.
-
Some of their corporate records are not traceable.
Financial Performance
|
Particulars (Rs. Mns) |
FY 18 |
FY 17 |
FY 16 |
FY 15 |
FY 14 |
|
Total Assets |
37,159.97 |
36,226.90 |
34,376.45 |
33,248.52 |
30,313.43 |
|
Total Revenue |
8,938.16 |
7,373.54 |
5,824.57 |
4,414.53 |
5,011.31 |
|
Total Expense |
5,781.08 |
4,937.06 |
4,416.67 |
3,772.61 |
4,019.12 |
|
Profit After Tax |
284.26 |
1,274.38 |
(1,124.89) |
(1,263.91) |
(1,088.05) |
Peer Review
|
Particulars (Rs. Mns) |
Market Cap (Rs. cr.) |
Sales turnover |
Net Profit |
Total Assets |
|
Indian Hotels |
15,739.84 |
2,583.95 |
147.77 |
6,127.84 |
|
EIH |
10,153.93 |
1,349.90 |
112.27 |
3,209.54 |
|
Lemon Tree Hote |
5,260.52 |
231.08 |
22.14 |
1,259.57 |
|
Mahindra Holida |
2,706.47 |
1,064.19 |
134.36 |
764.44 |
|
India Tourism D |
2,411.84 |
343.87 |
23.62 |
336.42 |
|
Taj GVK Hotels |
1,087.87 |
288.25 |
21.00 |
577.40 |
|
EIH Assoc Hotel |
1,021.29 |
263.53 |
37.79 |
303.43 |
|
Hotel Leela |
892.23 |
718.54 |
-23.22 |
3,576.96 |
Industry Overview
India GDP and Hotel room demand
Economic growth has a material benefit in creating demand for hotels. With an increase in GDP (at current prices) from USD 1,224 billion in 2008 to USD 2,611 billion for 2017, the demand for hotel rooms has increased from 26,300 rooms per day in 2008 to 84,100 rooms per day for 2017. With India’s GDP is expected to grow at 7.4% to 8.1% (at constant prices) over the next five years, growth in the demand for hotel rooms can reasonably be expected. The chart below compares the demand for hotel rooms (RPD growth) with the GDP levels for India.
Classification of Hotel rooms supply
Luxury and upper-upscale segment: these classifications typically refer to top-tier hotels. In India, these would generally be classified as five-star, deluxe and luxury hotels.
Upscale segment: these are hotels, which are more moderately positioned and priced, with smaller room sizes, than the top tier hotels. In India, these would generally be classified as four or even five-star hotels.
Upper midscale segment: these hotels are more moderately positioned and priced compared to upscale hotels. These may be full-service or even select service hotels, typically with fewer public areas and facilities and possibly smaller room sizes, than upscale hotels. In India, these would generally be classified as four-star and sometimes three-star hotels.
Midscale segment: these are typically three-star hotels with distinctly moderate room sizes, quality and pricing, and a lower quality of services, while domestic brand midscale hotels are often more full service in nature, services tend to be more selectively available among international branded midscale hotels.
Economy segment: these are typically two-star hotels providing functional accommodations and limited services while being focused on price consciousness.
Chain-affiliated hotels are hotels that are either (i) owned and operated by hotel chains, (ii) operated by hotel chains on behalf of other owners, or (iii) operated by owners themselves or third parties under a franchise arrangement from the hotel chains. These include all recognized international global chains operating in India, irrespective of the number of hotels or rooms operated by them in the country, and domestic hotel chains that are generally considered as operating under common branding.
Chain-affiliated hotels do not include other domestic chains which have less than five hotels operating regionally in India, groups that have multiple hotels only within one state (unless they are generally regarded as chain affiliated hotels by the market), companies that are primarily operating timeshare facilities and one-star hotels. There is a significant amount of room inventory outside the chain-affiliated hotels in India, with a mix of product types, positioning, service and operating standards, and varying degrees of competitiveness. Independent hotels have not been included due to the following main reason.
Foreign and domestic chain-affiliated Supply
The primacy of domestic chains as of the financial year 2001, slowly started ceding ground to international chains which expanded on the basis of aggressive pursuit of management contracts. They also gained from supporting the development of large format hotels with a larger scale that added function and meetings spaces of substance in key cities. Domestic chains had earlier based their expansion on a combination of asset ownership and management contracts, often weighted more substantially towards asset ownership.
An interesting feature of hotel supply in India is the lack of scale – hotels tend to have a lesser number of rooms than in several other international markets. Larger inventories help create economies of scale and enable hotels to widen their demand reach across varied demand segments, such as MICE and groups.
This also creates the benefit of larger revenue capture from F&B elements, besides benefitting costs due to economies of scale. While the varied demand sources and need for larger core occupancies may impact the ADR levels at larger hotels – relative to say a hotel of comparable standards but with lesser inventory and more business segment focused demand in the same market, the overall revenue and profit gain is often beneficial.
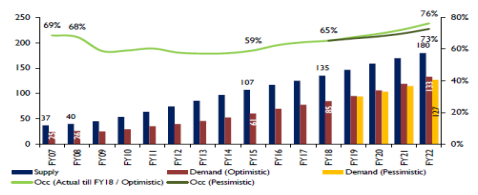
Supply and Demand
The following chart reflects all India – Rooms supply to demand graph – for the period indicated below:
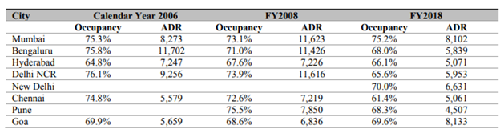
Performance of Hotels in India in Recent Years
The following table sets forth the citywide performance across all segments for key markets:
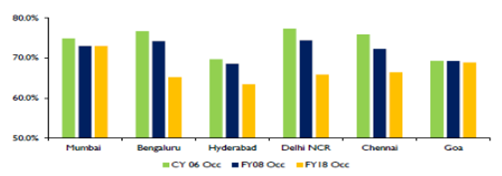
The chart below reflects the performance of key cities in the luxury-upper upscale segment based on city-wise occupancy:
The chart below reflects the performance of key cities in the luxury-upper upscale segment based on city-wise ADR:
Revenue per available room (RevPAR) trends have been positive across all India levels and across most of the select markets. Although positive, the absolute amounts remain modest across the country. Luxury–upper-upscale and upscale-upper midscale year-on-year RevPAR growth were higher than the all India average for both years (the financial year 2017 and 2018). Growth in the financial year 2018 was lower than in the financial year 2017 because of relatively higher supply growth in the financial year 2018.
Bengaluru: Bengaluru, which has a good supply balance between segments, has seen good growth in the upscale and mid–tier segment. RevPAR growth in the luxury–upper upscale segment has been slow. The growth was a moderate 2.7% in the financial year 2017 while in the financial year 2018 the RevPAR declined by 0.6%. This was due to the addition of about 1,200 new rooms since the financial year 2015 of which 500 rooms have been added in the financial year 2018.
Mumbai: RevPAR growth for Mumbai at the luxury–upper upscale level between the financial year 2016 and 2018 has been driven mainly from ADR increase. The increase has however been modest in absolute terms (between INR 300 to 400) in these years, despite no supply growth during this period. City occupancy crossed 75% in the financial year 2018, however growth is impacted by limited business on weekends for hotels.
Hyderabad: Hyderabad has gained from return of demand and growth in the general market, after resolution of the Telangana statehood issue. City occupancy crossed 65% in the financial year 2018 - first time since the financial year 2009.
- Share :


Post a Comment
|
DISCLAIMER |
This report is only for the information of our customers. Recommendations, opinions, or suggestions are given with the understanding that readers acting on this information assume all risks involved. The information provided herein is not to be construed as an offer to buy or sell securities of any kind. ATS and/or its group companies do not as assume any responsibility or liability resulting from the use of such information.