CIPLA Ltd.
Cipla Ltd is a pharmaceutical company. It is engaged in developing and manufacturing pharmaceutical and personal care products. The Company's business units include Active Pharmaceutical Ingredients (APIs), Respiratory and Cipla Global Access. Its product line includes active pharmaceutical ingredients, formulations and veterinary products.
|
BSE |
500087 |
|
NSE |
CIPLA |
|
REUTERS |
CIPL.BO |
|
INCEPTION |
1935 |
|
INDUSTRY |
PHARMA – BULK DRUG |
|
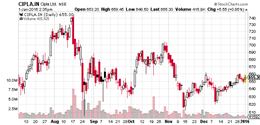
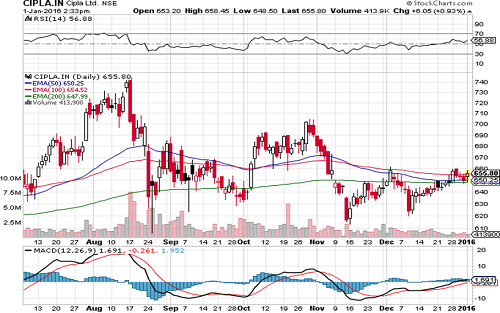
CMP (as on 1/1/2016) |
650 |
|
Stock Beta |
0.7177 |
|
52 Week H/L |
571.25 / 752.85 |
|
Market Cap (Cr) |
52592 Cr |
|
Equity Capital (cr) |
160.65 |
|
Face Value (Rs) |
2.00 |
|
Average Volume |
~6,25,000 |
|
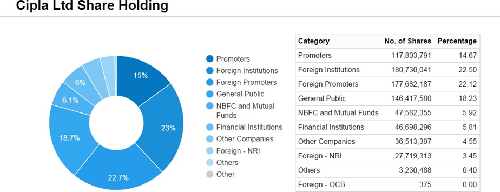
Shareholding Pattern (%) |
|
|
Promoters |
36.96 |
|
Non Institutions |
63.04 |
|
Grand Total |
100 |
.
Cipla Ltd - Potential Catalysts
-
An export segment to be the growth driver
-
Cipla intends to triple its respiratory portfolio from $350mn currently to $ 1.1bn
-
Growth driven business strategies
-
Increasing penetration in the domestic market
-
Underwhelming FY16 guidance, though 5-year vision on respiratory franchise positive
-
Acquisition to strengthen US franchisee
Cipla Ltd - Recommendation
Driven by incremental product launches in Europe and other geographies, superior project management skills, focus on measuring and monitoring quality, and its planned expansion Cipla will be able to grow over the next few years. We recommend BUY on the stock at a CMP of Rs. 650 to the target of Rs. 738.5 (Forward EPS 23.53x FY16).
Cipla Ltd - Financial Summary
|
Yearly Income Statement |
2014 |
2015 |
2016 E |
2017 E |
|
Revenue |
10438.76 |
11510.99 |
13883.39 |
15705.30 |
|
EBITDA |
2398.42 |
2327.25 |
3529.45 |
3604.16 |
|
EBIT |
2025.78 |
1822.54 |
3107.39 |
3054.47 |
|
PBT |
1880.04 |
1654.25 |
2957.39 |
2904.47 |
|
Adjusted PAT |
1388.41 |
1180.77 |
1889.88 |
1861.47 |
|
EPS (Unit Curr.) |
17.29 |
14.71 |
23.53 |
23.18 |
|
EBIDTA Margin |
24.41% |
21.39% |
26.93% |
23.30% |
|
EBIT Margin |
20.62% |
16.75% |
23.71% |
19.75% |
|
PAT Margin |
13.30% |
10.26% |
13.61% |
11.85% |
Cipla Ltd - BUSINESS DESCRIPTION
Formed by Dr. KA Hamied way back in 1935, Cipla is one of the oldest ventures set up by an Indian in the pre-independence era. With 34 manufacturing facilities spread over seven different locations, Cipla has a gamut of therapeutic offerings ranging from simple anti-infectives to complex oncology products. The product basket includes ~2000+ products encompassing almost all therapies and over 40 dosage forms. The facilities have been approved by various agencies such as the USFDA, WHO-Geneva, MHRA-UK, TGA-Australia, SUKL-Slovak Republic, APVMA- Australia, MCC-South Africa, PIC-Germany, Danish Medical Agency, ANVISA-Brazil, INVIMA Colombia, NDA-Uganda, Department of Health-Canada and MOH-Saudi Arabia, among others.
Cipla’s business model focuses on having marketing partnerships with local companies across the globe. Most partners are large generic players in developed countries. The company has partnership deals with ~22 partners in the US and ~65 in Europe. Cipla has also formed strategic alliances for product development, registration, and distribution of its products. For the non-regulated markets, the company has maintained long-standing relationships with non-government organizations and institutions globally. However, going ahead, we may witness launches via the front-end model rather than the partnership model, especially in the US. Exports constitute around ~53% of total sales. The company exports both APIs and formulations to more than 170 countries including advanced regions such as the US and Europe. Cipla derives 34% of its export revenues from North and Latin America followed by 33% from Africa, 14% from Europe, 13% from Australasia, and 6% from the Middle East. On the product filing front, Cipla has filed ~200 drug master filings (DMFs) and 149 abbreviated new drug applications (ANDAs) with the USFDA cumulatively. It has 79 approved products so far in the US market.
As far as other geographies are concerned, the count is ~1000 DMFs for 100 odd APIs. Similarly, ~30 of Cipla’s products are pre-qualified for WHO tenders. The company spends ~6% of revenues on R&D. The company recently entered into an agreement to acquire two USbased companies, InvaGen Pharmaceuticals Inc. InvaGen Pharma has 40 approved ANDAs, 32 marketed products, and 30 pipeline products, for which it expects to get approval over the next four years. The above pipeline also includes five FTFs that represent a market size of ~$8 billion in revenue by 2018. The transaction is valued at US$550 million and is an all-cash deal. Cipla remains among the top five players, thanks to a gamut of product offerings, which covers almost all therapies built on a network of ~7500 medical representatives (Mrs) covering a doctor base of ~5,00,000. As per the latest AIOCD ranking (MAT September 2015), Cipla is second with a market share of ~5%. Breaking it down further, it's ranking in acute therapies was at 1 with a market share of 4.3%. Similarly, its chronic ranking is 2 with a market share of 6.8%.
Respiratory therapy accounts for ~20% of Cipla’s turnover. The company introduced Salbutamol tablets in 1976 and Salbutamol inhaler in 1978 for the first time in India. Since then, Cipla has consistently introduced new products for asthma, chronic obstructive pulmonary disease (COPD), and allergic rhinitis (AR). More recently, the company did the same in other diseases such as pulmonary arterial hypertension (PAH), lung cancer, and idiopathic pulmonary fibrosis (IPF).
MANAGEMENT & GOVERNANCE
Shareholding pattern as of Sept 30th, 2015
The company’s management includes Dr.Y K Hamied, Mr.Adil Zainulbhai, Mr.Ashok Sinha, Mr.M K Hamied, Mr.Mital Sanghvi, Mr.S Radhakrishnan, Mr.Subhanu Saxena, Mrs.Samina Vaziralli, Ms.Naina Lal Kidwai, Ms.Punita Lal, Dr.Peter Mugyenyi.
The company has V Sankar Aiyar & Co. as its auditors. As of 30-Sep-2015, the company has a total of 803,104,806 shares outstanding.
Cipla Ltd - INVESTMENT RATIONALE
An export segment to be the growth driver
Cipla exports to more than 180 countries, with growth coming through marketing alliances and distribution tie-ups in various markets. Exports contributed 53% to the total turnover in FY2015, with Africa, the US, and Latin America constituting more than ~60% of total exports. In the US, Cipla has a strong product pipeline of 147 ANDAs, out of which, 79 are approved. Another long-term growth driver for the company is the launch of CFC-free inhalers in the regulated markets. CFC-free inhalers in Europe and the US address a potential market size of more than US$3bn.
CFCs are used as propellants in asthma inhalers which create the fine spray that is inhaled. Most countries in Europe have recommended that inhalers be CFC-free in order to address rising environmental concerns. CFCs are seen to contribute to the depletion of the ozone layer, leading to higher ultraviolet radiation. Many companies are replacing the propellant containing CFCs with another. Inhalers deliver a variety of asthma drugs such as salbutamol, fluticasone, budesonide, beclomethasone, and ipratropium.
Cipla is the market leader in inhalation therapy in India with a ~70-75% market share, has been selling CFC-free salbutamol and budesonide inhalers for about three years now. Investors have set great store by Cipla's plans to market CFC-free inhalers in Europe.
During the quarter, the company strengthened its foothold in the US through the acquisition of InvaGen Pharma and Exelon Pharma. The companies added a pipeline of ~70 ANDAs, of which 40 are approved (32 marketed) and 30 awaiting approval. The company is likely to add over USD250mn in FY2017. The deal is expected to conclude by December 2015. It will also provide manufacturing capabilities in the US. Overall, we expect the company’s exports to grow at a CAGR of 23.5% during FY2015-17E.
Cipla intends to triple its respiratory portfolio from $350mn currently to $ 1.1bn over the next five years with a 50% incremental delta from the existing business in India, South Africa, and Emerging Markets and the rest from expansion in North America and Europe. Cipla currently is in 50% of the addressable market for combination inhalers in Europe. Cipla launched inhalers in Romania in Q1FY16 and gained incremental market share in Hungary, Belgium whilst encountering slow growth in expanding inhaler sales in Germany.
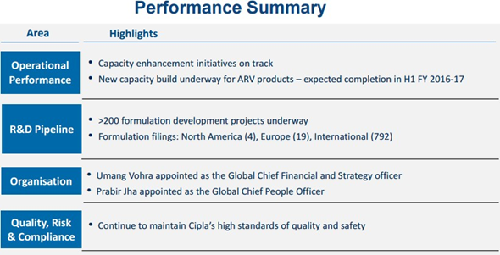
Growth driven business strategies
India
-
Domestic Rx business growth in line with industry growth (as per IMS)
-
Growth in Gx business has declined due to portfolio rationalization and a seasonal impact
South Africa
-
Private market growth in line with market growth
-
Strong tender business growth
-
Teva in-licensing sales continue to be strong
-
Cipla Medpro entered into an exclusive agreement with the Serum Institute of India (SII).
-
SII will develop and manufacture Measles, DT, TT, MMR, Hep B, and BCG vaccines and
-
Cipla Medpro will market it in the tender and private markets in South Africa
North America
-
Strong performance on our B2B sales with our key partners
-
Entered into a definitive agreement to acquire a 100% stake in two US-based companies, InvaGen Pharmaceutical Inc. and Exelan Pharmaceuticals Inc; the transaction is expected to be completed by end of December 2015
-
The combined revenue of these companies was over $200 million for the year ended December 2014 and over $225 million in LTM in June 2015. Ivan has an EBITDA margin of over 25% and recorded a sales growth of 20% CAGR over the last 3 years.
-
The transaction is valued at an enterprise value of US $550 mn; EV/EBITDA multiple of 8.4x of LTM June 2015 40 approved ANDAs, 32 marketed products, and 30 pipeline products are expected to be approved over the next 4 years InvaGen has filed 5 first-to-file products which represent a market size of ~$8 billion in revenue by 2018.
International
-
Strong momentum in front end markets; stable growth in partner markets
- Joint venture company established in Algeria with Biopharm SPA; Cipla will hold 40% stake in the company
-
Slower than expected offtake in Cipla Global Access business
-
The closely monitoring situation in Yemen
Europe
-
Strong top-line growth across B2B markets
-
Closely monitoring our respiratory performance
Increasing penetration in the domestic market
Cipla is one of the largest players in the domestic formulation market, with a market share of around 5.3%. Domestic formulations contributed 43% to the company’s total turnover in FY2015.
It is the market leader in key therapeutic areas such as respiratory care, anti-viral and urological. Cipla&rsquo's distribution network in India consists of a field force of around 7,000-8,000 employees. The company plans to increase its focus on domestic markets with new therapies such as oncology and neuropsychiatry in the offing. The company plans to focus on growing its market share and sales by increasing penetration in the Indian market, especially in rural areas and plans to expand its product portfolio by launching biosimilars, particularly relating to the oncology, anti-asthmatic, and anti-arthritis categories. Overall we expect the company’s domestic formulation business to post a CAGR of 12.5% over FY2015-17E, on the back of muted 1HFY2016 performance.
Underwhelming FY16 guidance, though 5 year vision on respiratory franchise positive
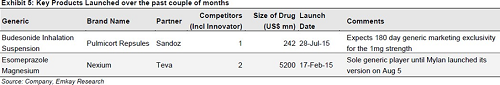
Cipla&rsquo's guidance of 20% revenue growth in FY16E appears conservative as it includes Nexium-driven revenues as well. More important was management commentary on the planned evolution of the respiratory franchise which is a key asset. The company expects respiratory revenue CAGR of c25% over FY15-FY20E to USD1.1bn from FY15 sales of USD350mn.
Regulated markets (US/EU) to account for nearly 50% of the franchise from under 10% currently. This is the first time the company has clearly articulated the trajectory and would be a key measurable in coming years.
Acquisition to strengthen US franchisee
H1 results were exemplary due to Nexium windfall. The management has maintained its revenue guidance of 20-22% with an improvement in EBITDA margins by 100-150 bps. The proposed acquisition of Invagen enlarging the US franchisee augurs well for the company. However, the recent Form 483 issued on Cipla&rsquo's Indore and InvaGen&rsquo's plants would be a short to medium-term concern to be wary about. On the domestic front, the push for OTC products augurs well for the company to complement the growth in Branded generics. However, the success of the front-end transformation process and European respiratory launches will have more bearing on the earning multiple than Nexium like windfalls
VALUATION
Cipla is currently trading at 650 per share with a market capitalization of 52,592 Crores. It has total debt of 1703.33Cr with long term Debt to Equity of 0. It is very convincing for investors as they are the only claimers of cash flow. It has total cash and bank balance of 564.26 Cr. Payout for FY15 is at 14.4% increased from 10.54% last year (FY14).
|
Key Ratios |
2012 |
2013 |
2014 |
2015 |
|
|
||||
|
Debt-Equity Ratio |
0.04 |
0.06 |
0.12 |
0.14 |
|
Long Term Debt-Equity Ratio |
0 |
0 |
0.02 |
0.03 |
|
Current Ratio |
2.34 |
2.09 |
1.83 |
1.75 |
|
|
||||
|
Turnover Ratios |
||||
|
Fixed Assets |
1.61 |
1.69 |
1.47 |
1.26 |
|
Inventory |
3.8 |
3.96 |
3.9 |
3.43 |
|
Debtors |
4.68 |
5.21 |
6.22 |
6.29 |
|
Total Asset Turnover Ratio |
0.95 |
0.94 |
0.96 |
0.94 |
|
Interest Cover Ratio |
38.76 |
62.79 |
13.9 |
10.83 |
|
ROCE (%) |
19.88 |
23.95 |
18.88 |
15.13 |
|
RONW (%) |
15.98 |
18.64 |
14.87 |
12.04 |
|
Payout (%) |
14.4 |
10.54 |
11.56 |
13.15 |
We value Cipla using DCF at price target of 738.5 with expected growth rate at 20.42% for FY16 and 18.04% for FY17. For valuation we assume that over the period company will keep capital structure unaltered and tax rate unchanged.
CONCUSSION AND RECOMMENDATION
|
NIFTY |
7950 |
|
SENSEX |
26150 |
|
NIFTY PHARMA |
12000 |
Driven by incremental product launches in Europe and other geographies, superior project management skills, focus on measuring and monitoring quality and its planned expansion Cipla will be able to grow over the next few years. We recommend BUY on the stock at CMP of Rs. 650 to target of Rs. 738.5 (Forward EPS 23.53x FY16).
RISKS AND CONCERNS
-
Slowest domestic formulations growth within the past 2 years: Domestic sales grew 8.4% to Rs13.9 bn due to dampening of the generic business which constitutes around 25% of the domestic business coupled with sporadic rains and rationalized portfolio. This is a major concern those investors who are keen about growth.
-
The revision of the National List of Essential Medicines will have an impact Cipla (~84 Crs)
-
FDA and other regulatory authorities have cautioned pharma companies concerns over health and cleanliness of the drug manufacturing plants.
Cipla recalled 1.41 lakh vials of Levalbuterol Inhalation solution used for relieving shortness of breath and coughing caused by asthma and chronic obstructive pulmonary disease for failed impurities and degradation specifications. These examples pose threat to company’s brand and directly mow down revenue.
FINANCIALS
Cipla Ltd. key Products/Revenue Segments include
-
Tablets & Capsules which contributed Rs 5756.47 Cr to Sales Value (56.29% of Total Sales)
-
Injections/Sterile Solution which contributed Rs 1119.92 Cr to Sales Value (10.95% of Total Sales)
-
Aerosols which contributed Rs 1097.13 Cr to Sales Value (10.73% of Total Sales)
-
Bulk Drugs which contributed Rs 941.28 Cr to Sales Value (9.20% of Total Sales)
-
Liquids which contributed Rs 507.07 Cr to Sales Value (4.95% of Total Sales)
-
Creams which contributed Rs 236.15 Cr to Sales Value (2.30% of Total Sales)
-
Other Operating Revenue which contributed Rs 186.46 Cr to Sales Value (1.82% of Total Sales)
-
Export Incentives which contributed Rs 159.48 Cr to Sales Value (1.55% of Total Sales)
-
Others which contributed Rs 118.21 Cr to Sales Value (1.15% of Total Sales)
-
Other Services which contributed Rs 55.65 Cr to Sales Value (0.54% of Total Sales)
-
Scrap which contributed Rs 46.90 Cr to Sales Value (0.45% of Total Sales)
for the year ending 31-Mar-2015.
For the quarter ended 30-Sep-2015, the company has reported a Standalone sales of Rs. 2982.09 Cr., down -13.98% from last quarter Sales of Rs. 3466.91 Cr. and up 26.94% from last year same quarter Sales of Rs. 2349.28 Cr. Company has reported net profit after tax of Rs. 407.38 Cr. in latest quarter.
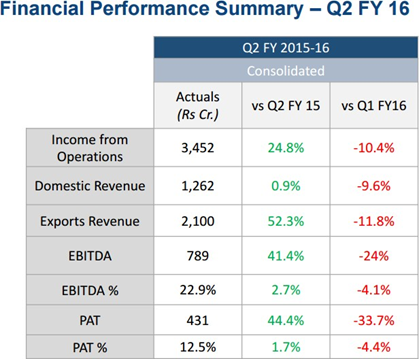
Highlights of H1 FY15
-
Consolidated H1 FY 2015-16 Revenue: Rs. 7,305 Cr, 33.1% above H1 FY 2014-15
-
Consolidated H1 FY 2015-16 EBITDA: Rs. 1,828 Cr, 66.2% above H1 FY 2014-15
-
Consolidated H1 FY 2015-16 EBITDA margin: 25%, as compared to 20.1% in H1 FY 2014-15
-
Consolidated H1 FY 2015-16 PAT: Rs. 1,082 Cr, 82.4 % above H1 FY 2014-15
-
Increase in working capital cycle from 120 days sales in March 2015 to 134 days sales in Sep 2015
-
Higher tax expenses due to increased profit and higher effective tax rate
|
EQUITY - BONUS HISTORY (Curr: Rs in Cr.) |
|||
|
|
|||
|
Year |
Ratio |
Book Value -Unit Curr |
EPS -Unit Curr |
|
2006 |
3:02 |
51.48 |
13.16 |
|
1999 |
2:01 |
225.8 |
56.68 |
|
1994 |
5:01 |
1393.2 |
347.3 |
|
1992 |
1:01 |
2128.39 |
563.87 |
|
1988 |
1:01 |
1826.7 |
201.59 |
|
1986 |
1:01 |
2616.59 |
229.96 |
|
1980 |
1:01 |
474.05 |
107.92 |
|
Dividend History |
|||
|
Year-End |
Dividend-Amount |
Dividend-% |
Div. Yield-% |
|
2015 |
160.59 |
100 |
0.28 |
|
2014 |
160.58 |
100 |
0.52 |
|
2013 |
160.58 |
100 |
0.53 |
|
2012 |
160.58 |
100 |
0.66 |
|
2011 |
224.81 |
140 |
0.87 |
|
2010 |
160.58 |
100 |
0.59 |
|
2009 |
155.46 |
100 |
0.91 |
|
2008 |
155.46 |
100 |
0.91 |
|
Yearly Income Statement |
2013 |
2014 |
2015 |
2016 E |
2017 E |
2018 E |
|
Net Sales |
8086.82 |
9825.8 |
10882.41 |
13104.60 |
15468.67 |
18259.22 |
|
Other Income |
261.91 |
265.37 |
165.55 |
228.475 |
236.63 |
244.785 |
|
Other Operating Income |
192.51 |
347.59 |
463.03 |
550.32 |
637.61 |
724.9 |
|
Total Income |
8541.24 |
10438.76 |
11510.99 |
13883.39 |
15705.30 |
18504.00 |
|
Total Expenditure |
6081.48 |
8040.34 |
9183.74 |
10353.94 |
12101.14 |
14421.13 |
|
EBIDTA |
2459.76 |
2398.42 |
2327.25 |
3529.45 |
3604.16 |
4082.87 |
|
Depreciation |
330.48 |
372.64 |
504.71 |
422.06 |
549.69 |
462.60 |
|
EBIT |
2129.28 |
2025.78 |
1822.54 |
3107.395 |
3054.474 |
3620.272 |
|
Interest |
33.91 |
145.74 |
168.29 |
150.00 |
150.00 |
150.00 |
|
PBT |
2095.37 |
1880.04 |
1654.25 |
2957.39 |
2904.47 |
3470.27 |
|
Tax |
544.31 |
463.38 |
400.03 |
1005.51 |
973.00 |
1145.19 |
|
Deferred Tax |
0 |
0 |
0 |
0 |
0 |
0 |
|
Adjusted Profit After Tax |
1551.06 |
1416.66 |
1254.22 |
1951.88 |
1931.47 |
2325.08 |
|
Minority Interest After NP |
0 |
15.93 |
48.15 |
37 |
50 |
50 |
|
Profit/Loss of Associate Company |
-6.21 |
-12.32 |
-25.3 |
-25 |
-20 |
-20 |
|
Extra-ordinary Items |
29.44 |
0 |
0 |
0 |
0 |
0 |
|
Adjusted Profit After Extra-ordinary item |
1515.41 |
1388.41 |
1180.77 |
1889.88 |
1861.47 |
2255.08 |
|
|
|
|||||
|
Equity |
160.58 |
160.58 |
160.59 |
160.59 |
160.59 |
160.59 |
|
EPS (Unit Curr.) |
19.24 |
17.29 |
14.71 |
23.53 |
23.18 |
28.08 |
|
Face Value |
2 |
2 |
2 |
2.00 |
2.00 |
2.00 |
|
Outstanding Shares |
|
|
803104806 |
803104806 |
803104806 |
803104806 |
|
|
|
|||||
|
EBIDTA Margin |
30.42% |
24.41% |
21.39% |
26.93% |
23.30% |
22.36% |
|
EBIT Margin |
26.33% |
20.62% |
16.75% |
23.71% |
19.75% |
19.83% |
|
PAT Margin |
17.74% |
13.30% |
10.26% |
13.61% |
11.85% |
12.19% |
- Share :


Post a Comment
|
DISCLAIMER |
This report is only for the information of our customers. Recommendations, opinions, or suggestions are given with the understanding that readers acting on this information assume all risks involved. The information provided herein is not to be construed as an offer to buy or sell securities of any kind. ATS and/or its group companies do not as assume any responsibility or liability resulting from the use of such information.