CIPLA LTD.
|
Industry |
Market Price |
Recommendation |
Target |
Time Horizon |
|
Pharma Industry |
532.35 |
BUY |
638.82 |
12 months |
Cipla Ltd is one of the leading pharmaceutical companies in India, incorporated in the year 1935, founded by Khwaja Abdul Hamied. In the same year on Aug 17, Cipla was registered as a public limited company with an authorized capital of Rs 6 lakh. The company focuses on development of new formulations and has a wide range of pharmaceutical products. Cipla has over 1500 products in 65 therapeutic categories available in over 50 dosage forms.
Cipla Ltd - Investment Summary
|
CMP (Rs) |
532.35 |
|
52 Week H/L |
678.45/507.20 |
|
Market Cap (Cr) |
507.20 |
|
Face Value (Rs) |
2.00 |
|
Promoter Holding (%) |
50.70 |
|
Non-Promoter Holding (%) |
49.30 |
|
Total (%) |
100.00 |
-
A pioneer in API manufacturing in India.
-
Research & Development (R&D).
-
Sales Increased in North America
-
Recent approvals are increasing the investor's interest.
-
The company’s fundamentals are strong.
Cipla Ltd - Financial Summary
|
Particulars(Rs. Cr) |
14-Mar |
15-Mar |
16-Mar |
17-Mar |
18-Mar |
|
Total Assets |
4,956.62 |
5,402.62 |
6,138.40 |
6,775.60 |
7,396.88 |
|
Total Revenue |
5,997.27 |
6,906.22 |
6,905.39 |
7,687.35 |
9,244.73 |
|
Profit after Tax |
487.08 |
545.87 |
624.46 |
693.64 |
668.35 |
|
Profit Margins |
8.12 |
7.9 |
9.04 |
9.02 |
7.23 |
|
EPS( Rs) |
5.73 |
6.42 |
7.35 |
8.16 |
7.86 |
Outlook and Valuation
Cipla’s Q2FY19 results were weaker-than-expected, there was a fall of 11% YoY in its net profit for the second quarter at Rs 377 crore when compared to last year, and operating margins was also low by 2.2%, mainly due to high base of restocking in the domestic market and a fall in the tender opportunity in South Africa and other emerging markets. Some of their tender businesses are growing 40% lower than last year. But company’s fundamentals are good and they are focusing more into new products. They have invested in R&D about 8.5% of their revenue to improve their product quality and this will show results in 3rd & 4th quarter. Considering all factors, we recommend to buy this stock for long term.
Management Profile
|
Key Personnel |
Designation and Experience |
Auditors |
|
Dr. Y. K. Hamied |
Non-Executive Chairman: Dr. Y. K. Hamied is appointed as the Non-Executive Chairman as on 1st April 2013. He represents the second generation of Cipla’s founding family. In 1960, Dr. Hamied obtained his PHD in organic chemistry from the University of Cambridge under the tutelage of the Nobel laureate Lord Alexander Todd. In the same year, he joined Cipla as an R&D Officer, was appointed Managing Director of Cipla in 1976 and became Chairman of Cipla in 1989. He retired as MD on 31st March 2013 and has continued to be the Chairman in a non-executive role since 1st April 2013. |
Walker Chandiok & Co LLP |
|
Ms. Samina Vaziralli |
Executive Vice-Chairperson: Ms. Samina Vaziralli is the Executive Vice-Chairperson of Cipla since September 1, 2016. She represents the third generation of Cipla’s founding family. Ms. Vaziralli received the ‘Most Powerful Women in Business’ award from Business Today in 2017. She holds B.Com. From The London School of Economics and Political Science in International Accounting. |
Mr D. H. Zaveri |
|
Mr. Umang Vohra |
Managing Director and Global Chief Executive Officer: Umang Vohra is the Managing Director and Global Chief Executive Officer of Cipla since September 1, 2016. Mr. Umang Vohra holds a B.E. in computer engineering and has done his MBA with a specialization in Finance from TA Pai Institute of Management. |
Mr Deepak Viegas |
|
Mr. Ashok Sinha |
Independent Director: Mr. Ashok Sinha is appointed as an Independent Non-Executive Director of Cipla. He is an Electrical Engineer from Indian Institute of Technology, Kanpur and Post Graduate Diploma in Management from Indian Institute of Management, Bangalore with specialization in Finance. He is a receiver of Distinguished Alumnus Award from IIT Kanpur as well as from IIM Bangalore. |
|
Cipla Ltd - Company Overview
Cipla, a global pharmaceutical company, offers active pharmaceutical ingredients and formulations in various therapeutic areas such as women’s health, cardiovascular, children’s health, dermatology and cosmeceuticals, diabetes, HIV-AIDS, oncology, infectious diseases and critical care, malaria, neurosciences, ophthalmology, osteoporosis, respiratory, and urology. The company is focused on agile and sustainable growth, complex generics, and deepening portfolio in Indian markets, South Africa, North America, and key regulated and emerging markets. Cipla is ranked 3d largest in pharma in India, 3rd largest in the pharma private market in South Africa, and is among the most dispensed generic players in the US.
The company develops and manufactures more than 200 generic active Pharmaceutical Ingredients used in making finished drugs. Cipla makes APIs for more than 300 partners around the world. The company is continuously adding to its development pipeline to expand its reach across key therapeutic segments.
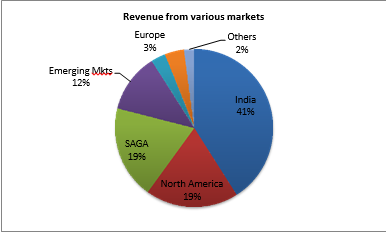
The company’s revenue from domestic market stood at 41%. The SAGA region which includes South Africa, Sub-Saharan Africa, and Cipla Global Access businesses declined 25% year-on-year in quarter 2 when reported in US dollars, largely behind the rebasing of the CGA business and the slower offtake in Sub-Saharan Africa and the lower tender sales in South Africa. As per YTD August IMS data, Cipla became the third largest pharma company in the South Africa private market with the 6.3% share.
Europe business declined by 14% on a year-on-year basis during the quarter, largely behind supply issues related to certain products and milestone payments in the previous year on account of the FPSM launch. But North America showed a rapid growth for this quarter, increased to 19% which is 2% higher than last year.
Key Ratios
|
|
FY18 |
FY17 |
FY16 |
FY15 |
FY14 |
|
Debt-Equity Ratio |
0.01 |
0.01 |
0.03 |
0.09 |
0.12 |
|
Current Ratio |
2.91 |
2.91 |
2.48 |
2.19 |
1.83 |
|
Inventory Turnover Ratio (x) |
3.75 |
3.77 |
4.06 |
4.15 |
3.08 |
|
Total Asset Turnover Ratio (%) |
66.62 |
66.94 |
68.99 |
79.51 |
66.69 |
|
PBDIT Margin (%) |
22.21 |
22.10 |
16.02 |
19.25 |
20.81 |
|
PBIT Margin (%) |
17.56 |
17.48 |
11.38 |
15.60 |
16.54 |
|
ROCE (%) |
13.93 |
10.22 |
9.39 |
11.90 |
10.17 |
|
RONW (%) |
10.40 |
10.40 |
7.61 |
12.20 |
10.65 |
|
Payout (%) |
10.95 |
0.00 |
16.50 |
12.37 |
13.59 |
|
Price/Book Value (x) |
3.10 |
3.10 |
3.72 |
3.43 |
5.15 |
|
EV/EBITDA (x) |
17.26 |
17.26 |
27.76 |
18.10 |
27.69 |
|
Market Cap/Sales |
3.84 |
3.82 |
4.42 |
3.40 |
5.64 |
Investment Rationale
-
A pioneer in API manufacturing in India.
Cipla is a pioneer in API manufacturing in India for over 5 decades. Currently the company manufactures more than 200 generic and complex APIs. Cipla Active Pharmaceutical Ingredients (APIs) covers a broad spectrum of therapeutic categories that are supplied to some of the major formulation players in the pharmaceutical industry globally, over 350 Drug Master Files and 70 Certificate of suitability of Monographs of the European Pharmacopoeia. In addition to that, the firm also has a robust pipeline of over 50 APIs at various stages of development and has become one of the top Indian pharmaceutical companies.
-
Sales Increased in North America
Cipla’s North America business delivered sales of 108 million, growing 12% year-on-year (YoY). As alluded to in earlier call, the US business is undergoing a change in mix as designed with the B2B business coming down sharply as no new products are getting added and the portfolio rationalization that they had initiated. These are impacting the reported sales for the US business as the new DTM product sales increase which is 40% of the Q2 DTM revenues which were on Nov 05, 2018 contributed by new products launched in the last 12 months. This has helped the company to drive significant margin improvement in our DTM business in line with our internal estimates.
-
Research & Development (R&D)
The company has increased its investment in R&D at 8% (INR 316cr) versus approximately 6.5% in the previous year. They are continuing to invest in their quality systems and maintaining a strong state of control and compliance at their plants. The Company has been investing towards building a strong internal pipeline for the future. The absolute investment is marginally below last year on reported basis due to Company’s decision to discontinue its investment in CiplaBioTec. Considering this, the absolute investment is in line with the expectations and will drive focus on developing complex and high-value products. In the past two years, Cipla has stepped up R&D investments targeting the US, with several assets such as gAdvair, gProventil and gAbraxane in the pipeline.
-
Recent approvals have increasing the investors’ interest.
Recently, Cipla has received final approval for its abbreviated new drug application for Valganciclovir tablets 450mg from the United States Food and Drug Administration. Valganciclovir Tablets 450mg is AB-rated generic therapeutic equivalent version of Roche’s Valcyte. This news impacted positively and created shareholders interest in the company. As on 30th Sept, 2018, Cipla had cumulative pipeline of 256 ANDAs of which 161 ANDAs are approved, 24 ANDAs are tentatively approved and 71ANDAs are under approval process.
Industry Overview
Indian Pharma industry contributes over 4% of the Indian GDP. There are close to half a million people directly, and over a million people indirectly employed in Indian Pharmaceutical industry making India as the second highest skilled biotech workforce in the world. Between 2000 -2017, FDI investment in this sector is over US$ 16 billion. India’s pharma export 2017-18 is over 16 Billion USD. Present government aims to make India a major hub for end-to-end drug discovery through initiatives such as ‘Pharma Vision 2020’.
While most of the sales come from US and European Markets followed by Asian countries, Indian Pharma companies contribute to over 20% of Global Generic business. Thanks to the pricing pressures from governments, Indian Domestic Pharma Market makes up of 10% of global sales account only for 3% in value terms. World medical spending is expected to grow by 3-6% CAGR to USD 1.4 Trillion from current 1.13 Trillion by 2022.
India exports 20% of World Generic; cost of producing drugs is 33% lower in India than US due to lower labor and production plant set up cost. Generic drugs are low-priced copies of off-patent medicines. They serve a critical purpose in healthcare provision allowing cheap competition to older medicines frees up resources to pay for newer innovative treatments. Generics drugs have made it possible to reduce the total cost of care as they cost 75-90% less than their branded equivalents.
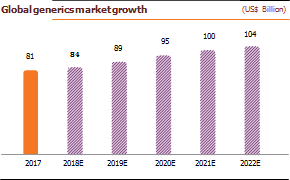
The global generic drugs market reached ~US$ 245 billion in 2017. The use of generics saved the US healthcare system an amount of US$253 billion during 2016 and US$1.67 trillion over the last decade. Generic drugs make up >80% of the volume of drugs dispensed around the world, and the volume is expected to grow as more drugs lose patent protection. The global generic drugs market was pegged at US$185 billion in 2016, 17% of the global pharmaceutical market. Generic drugs accounted for 28% of the total pharmaceutical sales worldwide in 2017. Additionally, there were 847 generics approved in 2017, up by 37% from the previous record (633) in 2016 as well as 73 unique ANDAs approved during the same period.
Demand drives as the elderly population rises around the world and the need for multiple drugs increases. This could cause volumes to rise faster than the population growth as well as put a greater pressure on costs. Healthcare costs have risen consistently as a share of GDP in all developed countries and are expected to keep rising. In the US, healthcare expenditure increased to US$ 3 trillion in 2015 and is forecast to reach 20% of the GDP by 2025. As expenditure in developing countries catches up with the developed world, a greater share of these expenses is being borne by governments, pressuring budgets. While a number of factors drive rising healthcare costs and drugs account for only 10-15% of healthcare spending in most countries, pressure on healthcare budgets is unlikely to ease. The increasing focus on value in healthcare provision and greater price sensitivity from patients could support generics demand.
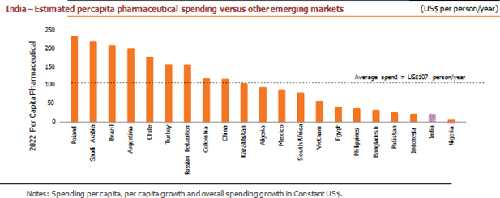
At about 4.5% of the GDP against the global average of 9%, India has among the lowest spends on healthcare. To cover over 100 million poor and vulnerable families, the Government has taken a hallmark step of launching a National Health Protection Scheme (NHPS). An annual coverage scheme provides 5 lakhs per family for secondary and tertiary care hospitalization. According to IQVIA, spending on medicines is projected to grow by 9-12% in the next five years compared to China’s 5-8%. In the ongoing financial year, this growth will thrust India forward to reach the list of the Top 10 countries.
Peer Review
|
Name |
Last Price |
Market Cap. |
Sales Turnover |
Net Profit |
Total Assets |
|
Sun Pharma |
485.25 |
116,427.40 |
7,947.60 |
-494.59 |
26,548.60 |
|
Aurobindo |
803.25 |
47,063.03 |
10,303.15 |
1,812.77 |
13,636.41 |
|
DrReddys Labs |
2,690.95 |
44,682.11 |
9,359.30 |
566.90 |
14,396.60 |
|
Cipla |
532.70 |
42,904.65 |
11,444.81 |
1,468.52 |
14,287.95 |
|
Piramal Enter |
2,182.45 |
40,017.36 |
3,288.63 |
518.47 |
33,327.58 |
|
Lupin |
878.15 |
39,715.76 |
10,088.18 |
1,344.66 |
15,797.25 |
|
Divis Labs |
1,466.80 |
38,938.93 |
3,837.23 |
869.58 |
6,022.76 |
|
Cadila Health |
360.55 |
36,911.04 |
5,809.90 |
1,090.80 |
10,397.5 |
Profit and Loss
|
Particulars (Rs. Cr) |
Mar 18 |
Mar 17 |
Mar 16 |
Mar 15 |
Mar 14 |
|
INCOME |
|
|
|
|
|
|
Revenue From Operations [Gross] |
11,004.44 |
11,004.44 |
10,637.08 |
11,873.46 |
9,831.88 |
|
Less: Excise/Service Tax/Other Levies |
54.91 |
0.00 |
206.09 |
0.00 |
92.94 |
|
Revenue From Operations [Net] |
10,949.53 |
11,004.44 |
10,430.99 |
11,873.46 |
9,738.94 |
|
Other Operating Revenues |
440.37 |
440.37 |
337.50 |
244.26 |
392.84 |
|
Total Operating Revenues |
11,389.90 |
11,444.81 |
10,768.49 |
12,117.72 |
10,131.78 |
|
Other Income |
334.88 |
334.88 |
129.85 |
280.30 |
147.91 |
|
Total Revenue |
11,724.78 |
11,779.69 |
10,898.34 |
12,398.02 |
10,279.69 |
|
EXPENSES |
|
|
|
|
|
|
Cost Of Materials Consumed |
3,303.31 |
3,303.31 |
2,956.04 |
3,633.34 |
3,426.74 |
|
Purchase Of Stock-In Trade |
1,064.23 |
1,064.23 |
1,128.99 |
1,037.56 |
903.41 |
|
Operating And Direct Expenses |
475.13 |
0.00 |
443.37 |
0.00 |
0.00 |
|
Changes In Inventories Of FG,WIP And Stock-In Trade |
-212.05 |
-212.05 |
56.27 |
228.35 |
-349.05 |
|
Employee Benefit Expenses |
1,785.94 |
1,785.94 |
1,728.97 |
1,778.56 |
1,505.58 |
|
Finance Costs |
11.90 |
11.90 |
39.20 |
147.07 |
136.05 |
|
Depreciation And Amortization Expenses |
529.61 |
529.61 |
499.97 |
442.69 |
433.20 |
|
Other Expenses |
2,777.79 |
3,307.83 |
2,858.59 |
3,386.48 |
2,683.79 |
|
Profit/Loss Before Exceptional, Extra Ordinary Items And Tax |
1,988.92 |
1,988.92 |
1,186.94 |
1,743.97 |
1,539.97 |
|
Exceptional Items |
-77.52 |
-77.52 |
0.00 |
0.00 |
0.00 |
|
Profit/Loss Before Tax |
1,911.40 |
1,911.40 |
1,186.94 |
1,743.97 |
1,539.97 |
|
Current Tax |
431.33 |
442.88 |
311.06 |
356.64 |
318.78 |
|
Deferred Tax |
11.55 |
0.00 |
-99.06 |
-74.97 |
40.10 |
|
Total Tax Expenses |
442.88 |
442.88 |
212.00 |
281.67 |
358.88 |
|
Profit/Loss After Tax And Before Extra Ordinary Items |
1,468.52 |
1,468.52 |
974.94 |
1,462.30 |
1,181.09 |
|
Profit/Loss From Continuing Operations |
1,468.52 |
1,468.52 |
974.94 |
1,462.30 |
1,181.09 |
|
Profit/Loss For The Period |
1,468.52 |
1,468.52 |
974.94 |
1,462.30 |
1,181.09 |
|
OTHER ADDITIONAL INFORMATION |
|
|
|
|
|
|
EARNINGS PER SHARE |
|
|
|
|
|
|
Basic EPS (Rs.) |
18.25 |
18.25 |
12.13 |
18.21 |
14.71 |
|
Diluted EPS (Rs.) |
18.22 |
18.22 |
12.11 |
18.16 |
14.66 |
Cipla Ltd - Balance Sheet
|
Particulars (Rs. Cr) |
Mar 18 |
Mar 17 |
Mar 16 |
Mar 15 |
Mar 14 |
|
Equity Share Capital |
161.02 |
160.90 |
160.68 |
160.59 |
160.58 |
|
Total Share Capital |
161.02 |
160.90 |
160.68 |
160.59 |
160.58 |
|
Revaluation Reserves |
0.00 |
0.00 |
0.00 |
8.97 |
8.97 |
|
Reserves and Surplus |
13,952.50 |
12,639.61 |
11,825.20 |
10,920.59 |
9,922.09 |
|
Total Reserves and Surplus |
13,952.50 |
12,639.61 |
11,825.20 |
10,929.56 |
9,931.06 |
|
Total Shareholders’ Funds |
14,113.52 |
12,800.51 |
11,985.88 |
11,090.15 |
10,091.64 |
|
NON-CURRENT LIABILITIES |
|
|
|
|
|
|
Long Term Borrowings |
0.00 |
0.07 |
0.13 |
0.41 |
0.43 |
|
Deferred Tax Liabilities [Net] |
0.00 |
0.00 |
35.85 |
330.59 |
311.20 |
|
Total Non-Current Liabilities |
249.75 |
250.88 |
298.70 |
522.93 |
415.62 |
|
CURRENT LIABILITIES |
|
|
|
|
|
|
Short Term Borrowings |
174.43 |
324.26 |
1,131.68 |
1,380.20 |
876.91 |
|
Trade Payables |
1,580.02 |
1,298.21 |
990.84 |
1,496.60 |
962.56 |
|
Other Current Liabilities |
579.07 |
670.58 |
582.73 |
352.42 |
333.20 |
|
Short Term Provisions |
398.18 |
262.78 |
249.22 |
349.52 |
244.07 |
|
Total Current Liabilities |
2,731.70 |
2,555.83 |
2,954.47 |
3,578.74 |
2,416.74 |
|
Total Capital And Liabilities |
17,094.97 |
15,607.22 |
15,239.05 |
15,191.82 |
12,924.00 |
|
ASSETS |
|
|
|
|
|
|
NON-CURRENT ASSETS |
|
|
|
|
|
|
Tangible Assets |
4,158.37 |
4,095.16 |
3,702.28 |
3,468.33 |
3,519.59 |
|
Capital Work-In-Progress |
435.28 |
540.52 |
512.81 |
339.00 |
319.64 |
|
Fixed Assets |
4,782.95 |
4,791.35 |
4,377.16 |
3,954.33 |
3,900.88 |
|
Long Term Loans And Advances |
233.13 |
215.75 |
219.37 |
576.71 |
535.30 |
|
Total Non-Current Assets |
9,156.80 |
9,261.88 |
8,771.68 |
8,633.16 |
7,826.03 |
|
CURRENT ASSETS |
|
|
|
|
|
|
Inventories |
3,037.98 |
2,653.50 |
2,918.47 |
3,289.20 |
2,511.16 |
|
Trade Receivables |
2,336.32 |
1,938.79 |
1,896.41 |
2,058.91 |
1,728.10 |
|
Cash And Cash Equivalents |
227.53 |
58.46 |
53.01 |
82.76 |
46.04 |
|
Short Term Loans And Advances |
17.74 |
9.53 |
10.92 |
589.96 |
515.56 |
|
Other Current Assets |
1,278.86 |
1,046.88 |
1,049.04 |
153.72 |
38.26 |
|
Total Current Assets |
7,938.17 |
6,345.34 |
6,467.37 |
6,558.66 |
5,097.97 |
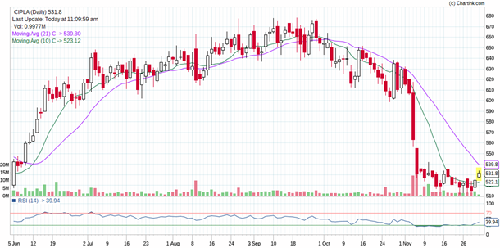
Stock Performance Chart
- Share :


Post a Comment
|
DISCLAIMER |
This report is only for the information of our customers. Recommendations, opinions, or suggestions are given with the understanding that readers acting on this information assume all risks involved. The information provided herein is not to be construed as an offer to buy or sell securities of any kind. ATS and/or its group companies do not as assume any responsibility or liability resulting from the use of such information.