Club Mahindra
ABOUT Mahindra Holidays & Resorts India Ltd
Mahindra Holidays & Resorts India Ltd., incorporated in the year 1996, is a Mid Cap company (having a market cap of Rs 2132.52 Cr.) operating in Hospitality sector.
Mahindra Holidays & Resorts India Ltd. key Products/Revenue Segments include Income from
-
Vacation Ownership which contributed Rs 482.60 Cr to Sales Value (62.06% of Total Sales)
-
Subscription Income which contributed Rs 132.73 Cr to Sales Value (17.07% of Total Sales)
-
Beverages & Food which contributed Rs 70.50 Cr to Sales Value (9.06% of Total Sales)
-
Other Operating Revenue which contributed Rs 47.34 Cr to Sales Value (6.08% of Total Sales)
-
Service (Hotel) which contributed Rs 24.18 Cr to Sales Value (3.11% of Total Sales)
-
Income (Room Rent) which contributed Rs 10.72 Cr to Sales Value (1.37% of Total Sales)
-
Income From Travel Operations which contributed Rs 6.69 Cr to Sales Value (0.86% of Total Sales)
-
Wine & Liquor which contributed Rs 2.75 Cr to Sales Value (0.35% of Total Sales)
for the year ending 31-Mar-2014.
For the quarter ended 31-Mar-2015, the company has reported a Standalone sales of Rs. 185.73 Cr., down -4.53% from last quarter Sales of Rs. 194.54 Cr. and down -11.87% from last year same quarter Sales of Rs. 210.75 Cr. Company has reported net profit after tax of Rs. 10.42 Cr. in latest quarter.
The company’s management includes Mr.Dinesh Shetty, Mr.S Krishnan, Mr.A K Nanda, Mr.Cyrus J Guzder, Mr.Kavinder Singh, Mr.Rohit Khattar, Mr.Sanjeev Aga, Mr.Sridar Iyengar, Mr.Uday Y Phadke, Mr.V S Parthasarathy, Mr.Vineet Nayyar, Ms.Radhika Shastry, Mr.Dinesh Shetty.
Club Mahindra Holidays has Deloitte Haskins & Sells as its auditors. As on 31-Mar-2015, the company has a total of 88,780,856 shares outstanding.
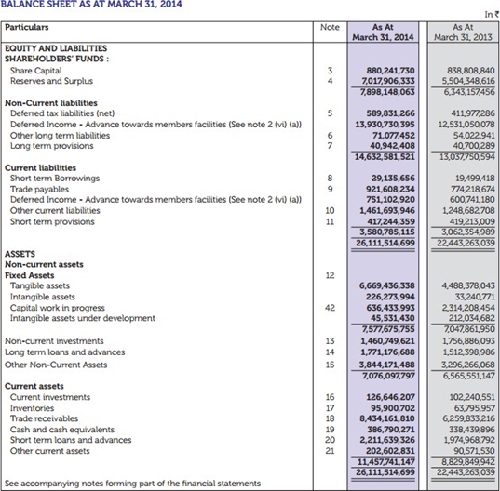
Mahindra Holidays & Resorts India Ltd - Balance Sheet
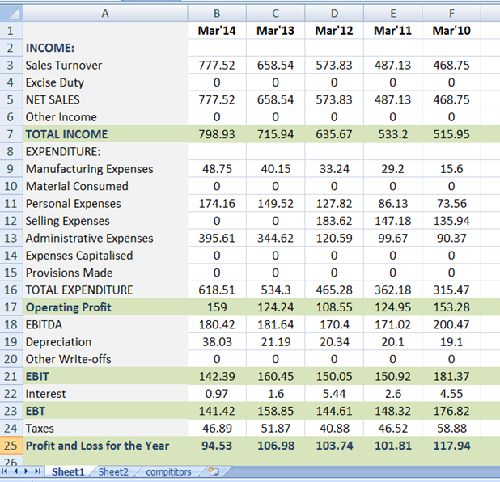
Mahindra Holidays & Resorts India Ltd - Income Statement (YoY)
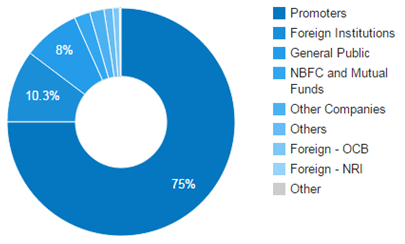
Mahindra Holidays & Resorts India Ltd Share Holding
|
Category |
No. of Shares |
Percentage |
|
Promoters |
66,585,642 |
75.00 |
|
Foreign Institutions |
9,139,452 |
10.29 |
|
General Public |
7,114,882 |
8.01 |
|
NBFC and Mutual Funds |
1,981,457 |
2.23 |
|
Other Companies |
1,808,687 |
2.04 |
|
Others |
1,117,502 |
1.26 |
|
Foreign - OCB |
824,565 |
0.93 |
|
Foreign - NRI |
167,755 |
0.19 |
|
Financial Institutions |
40,914 |
0.05 |
Relative Valuation
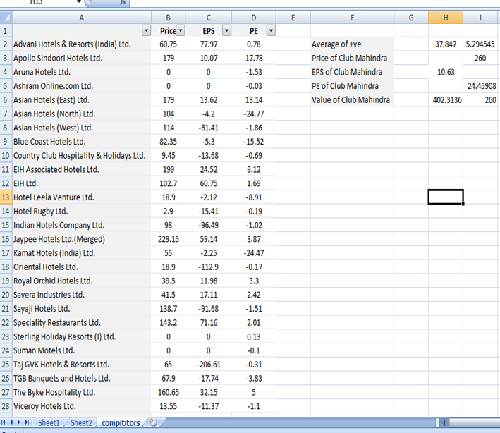
PE Multiple Market Value -260 per share
EPS Multiple Market Value -400 per share
EBIT Multiple Market Value -340 per share
Financial comparison
|
Profitability and Growth |
||
|
|
Club M |
Peers |
|
Return of Equity |
11.96 |
0.43 |
|
Return on Assets |
3.85 |
1.91 |
|
Return on Capital Employed |
11.66 |
6.32 |
|
Gross Profit Margin |
15.55% |
14.62 |
|
Operating Profit Margin |
20.54 |
14.62 |
|
Net Profit Margin |
11.83 |
-ve |
|
Key ratios |
||
|
Quick Ratio |
0.93 |
7.23 |
|
Current Ratio |
0.93 |
7.43 |
|
Cash Ratio |
0.02 |
0.32 |
|
D/E Ratio |
- |
.86 |
|
Coverage Ratio |
- |
10.71 |
Club Mahindra Holidays is long term debt free. Interest on short term borrowings was 9,684,184 in the FY 14. That will be more convincing to investors since market is punishing companies with more debt on balance sheet. Company has little cash in hand and most of the liquid cash is provided by short term assets and short term borrowings.
Comparative analysis shows that investors haven’t awarded the stock well. Sector itself is undervalued by 10-15%. Mahindra Holidays as seasonal stock, most of the revenue is expected in summer season i.e., Q1 and Q2 results should be rewarding. We expect revenue to grow by 18% YoY basis and Q1 results by 20% QoQ basis. Dividend is expected to remain same (1.25-1.5%).
Club Mahindra Holidays doesn’t have much expense in any particular goods and services. Most of the expense is in the form of employee benefit and tax.
We expect the stock to move up in the coming quarterly results. One of the main reasons stock price is declining is because the company is issuing new shares every year. On April 12, 2013, the Company allotted 4,141,084 equity shares of 10 Rs each for cash at a premium of Rs 245 per equity share aggregating to Rs 10,559.76 lakhs, pursuant to shares issued under an Institutional Placement Programme (IPP). Out of the total proceeds, the Company has spent Rs 308.78 lakhs towards issue expenses, Rs 7,313.68 lakhs towards capital expenditure and the balance has been invested in debt schemes of mutual funds/Fixed Deposits with Bank/ lying in bank account.
Investment Risks
-
Slowdown in economy as a result of higher interest rates and less new job creation could hamper the growth prospects of the company.
-
Inflation on the other hand is stable mainly because of the drop in crude oil prices.
-
Bad monsoon may inflate the price of food and beverage which in turn add more expense to the company’s balance sheet.
-
Tax on service increased from 12.5% to 14%.
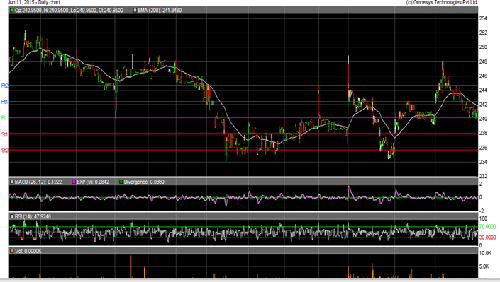
Price Action
-
Price is expected to waver ranging 220-250 until results come out.
-
Positive news may spike the price to 300.
Technical analysis – Charts shows the price is moving in a band between 230 and 245-250. More reward in the upside than downside.
Chart
|
RSI (21) |
48 |
BUY |
|
STOCH(9,6) |
53 |
Natural |
|
MACD(12,26) |
1.46 |
BUY |
|
STOCHRSI(14) |
73.9 |
BUY |
|
Action |
HOLD |
|
|
Stock price |
240.50 |
|
|
Target |
|
|
|
Upside |
250 – 270 – 285 |
|
|
Downside |
220 - 200 |
|
|
Symbol |
(NSE)MHRIL (BSE) BOM:533088 |
|
|
Market Cap |
21.03 B |
|
- Share :


Post a Comment
|
DISCLAIMER |
This report is only for the information of our customers. Recommendations, opinions, or suggestions are given with the understanding that readers acting on this information assume all risks involved. The information provided herein is not to be construed as an offer to buy or sell securities of any kind. ATS and/or its group companies do not as assume any responsibility or liability resulting from the use of such information.