DCB Bank Limited Research Report
|
Industry |
Market Price |
Recommendation |
Target |
Time Horizon |
|
Bank |
80.90 |
Buy |
107 |
1 Year |
Q3 FY 2022 Review
DCB Bank Limited reported net revenue of ₹878.08 crores for the quarter ended December 31, 2021, compared to ₹869.35 crores for December 31, 2020. Profit After Tax was ₹75.37 crores for the quarter ended, 31, 2021, as compared to ₹96.21 crores, during the corresponding quarter of the previous year respectively.
DCB Bank - Investment Summary
|
CMP (₹) |
80.90 |
|
52 Week H/L |
67.85/114.4 |
|
Market Cap (crores) |
2,515 |
|
Face Value (₹) |
10.00 |
|
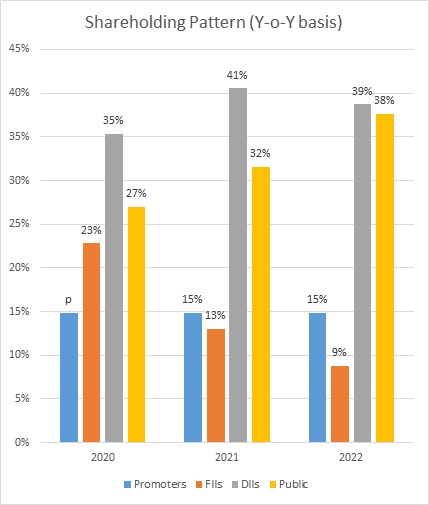
Promoter Holding (%) |
14.86 |
|
Non-Promoter Holding (%) |
85.14 |
|
Total (%) |
100.00 |
|
Book Value |
₹119 |
|
EPS TTM |
₹10.70 |
DCB Bank - Overview
-
DCB Bank Limited launched the 400th Branch on 05th April 2022.
-
Due to the covid-19 disruptions and lockdowns, Bank had slowed down its branch expansion. They aim to open 25 to 30 branches in the next 12 to 18 months.
-
The Bank has allotted 37,500 equity shares of ₹10 each under the Employee Stock Option Plan terms. With that Bank’s issued and paid share capital has increased to 31.10 crores equity shares of ₹10 each.
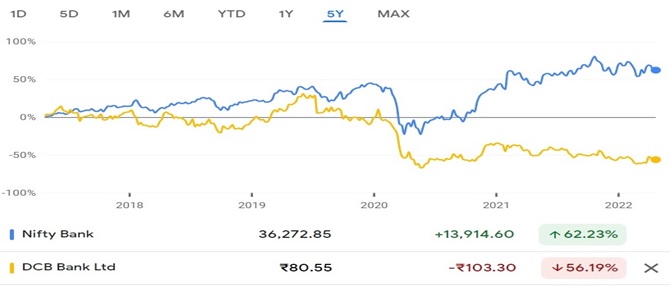
Beta: 0.83 |
Alpha: -38.94 |
Risk Reward Ratio: 1.55 |
Margin of Safety: 1.59% |
DCB Bank - Quarterly Summary
|
Quarterly (INR in crores) |
Dec-21 |
Sep-21 |
Jun-21 |
Mar-21 |
Dec-20 |
|
Interest Income |
878 |
869 |
846 |
837 |
869 |
|
Interest Expended |
533 |
546 |
537 |
526 |
535 |
|
Net Interest Income |
345 |
323 |
309 |
311 |
335 |
|
Other Income |
118 |
98 |
121 |
134 |
157 |
|
Total Income |
463 |
421 |
430 |
445 |
491 |
|
Payments to and Provisions for Employee |
138 |
132 |
123 |
111 |
109 |
|
Other Expenses |
127 |
114 |
105 |
129 |
103 |
|
Provision and Contingencies |
97 |
86 |
157 |
101 |
150 |
|
EBT |
102 |
89 |
46 |
104 |
130 |
|
Tax Expenses |
26 |
24 |
12 |
26 |
33 |
|
PAT |
75 |
65 |
34 |
78 |
96 |
Business
-
DCB Bank is a new generation private sector bank with 400 branches (10th April 2022) across India.
-
It is a scheduled commercial bank regulated by the Reserve Bank of India.
-
DCB Bank’s business segments are Retail, Micro-SME, SME, Mid-corporate, Agriculture, Commodities, Government, Public Sector, Indian Banks, Co-operative Banks, and Non-Banking Finance Companies.
-
DCB banks have approximately 9,50,000 customers.
-
Incorporated in 1995, DCB was formed through the merger of Ismailia Co-operative Bank Limited and Masalawala Co-operative Bank.
-
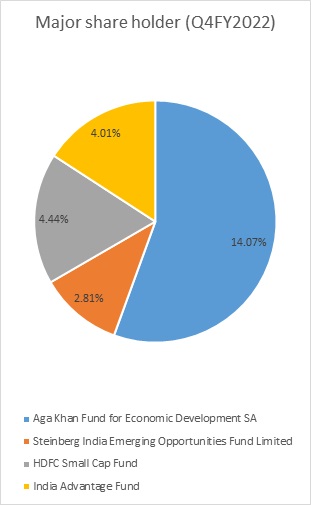
The Aga Khan Fund for Economic Development (AKFED) and Group companies are the largest shareholders in the bank, with a combined stake of 14.86% as of 31st March 2022.
-
DCB Bank's business segments include:
-
Treasury Operations:
-
Treasury actively manages liquidity and compliance with important regulatory items such as CRR/SLR, trading in fixed income securities and currencies, and investment in IPO.
-
Treasury also shares the responsibility of interest rate risk management of the Bank.
-
-
Corporate Banking:
-
The Bank intends to have limited exposure in Corporate Banking.
-
The Bank has a robust underwriting and credit/process to address the inherent risks in Corporate Banking.
-
-
Retail Banking:
-
Retail Banking offers unique products to meet the financial needs of individuals and businesses.
-
-
-
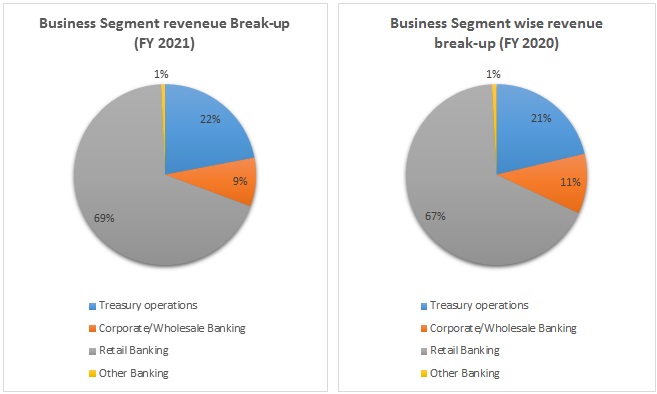
Out of the total revenue, 22% has been generated from Treasury operations, 9% from Corporate/wholesale Banking, 69% from Retail Banking, and 1% from others in FY 2021 compared to 21%, 11%, 67%, and 1% in FY 2020, respectively.
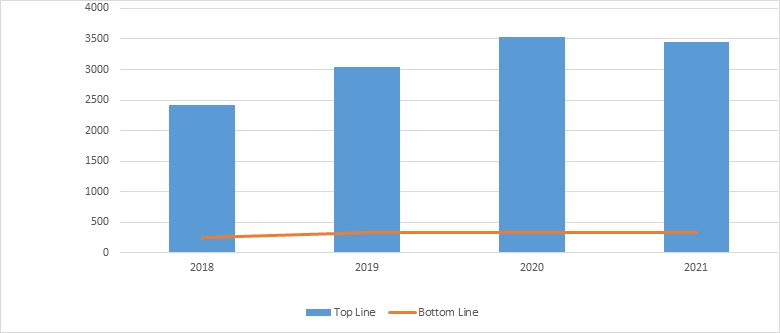
DCB Bank - Revenue Trend
Topline and Bottomline trend (crores)
Ratio Analysis
|
|
Mar-18 |
Mar-19 |
Mar-20 |
Mar-21 |
|
Net Interest Income |
8% |
8% |
9% |
9% |
|
Gross NPA |
1.79% |
1.84% |
2.46% |
4.09% |
|
Net NPA |
0.72% |
0.65% |
1.16% |
2.29% |
|
Provision Coverage Ratio |
75.72% |
78.77% |
70.81% |
62.35% |
|
Capital Adequacy Ratio |
16.47% |
16.81% |
17.75% |
19.67% |
|
CASA Ratio |
24.30% |
23.90% |
21.50% |
22.80% |
|
Credit Deposit Ratio |
85% |
83% |
83% |
87% |
|
ROA |
0.94% |
0.99% |
0.90% |
0.87% |
DCB Bank - Financial Overview
DCB Bank - Profit and Loss Statement (₹ in crores)
|
|
Mar-18 |
Mar-19 |
Mar-20 |
Mar-21 |
|
Interest income |
2,412.99 |
3,041.49 |
3,536.63 |
3,458.21 |
|
Interest Expended |
1,417.56 |
1,892.20 |
2,271.72 |
2,171.60 |
|
Net Income |
995.43 |
1,149.29 |
1,264.91 |
1,286.62 |
|
|
|
|
|
|
|
Other income |
310.28 |
350.16 |
391.09 |
458.50 |
|
Total income |
1,305.70 |
1,499.45 |
1,656.01 |
1,745.11 |
|
|
|
|
|
|
|
Payments to and Provisions for employee |
381.23 |
433.99 |
458.80 |
433.50 |
|
Other expenses |
399.50 |
418.86 |
444.15 |
413.13 |
|
Provision and Contingencies |
138.80 |
140.06 |
261.14 |
445.68 |
|
EBT |
386.17 |
506.54 |
491.92 |
452.81 |
|
|
|
|
|
|
|
Tax expenses |
140.83 |
181.17 |
153.99 |
117.02 |
|
PAT |
245.34 |
325.37 |
337.94 |
335.79 |
|
|
|
|
|
|
|
EPS |
|
|
|
|
|
Basic |
8.02 |
10.53 |
10.87 |
10.82 |
|
Diluted |
7.85 |
10.36 |
10.74 |
10.70 |
|
|
|
|
|
|
|
Number of shares |
|
|
|
|
|
Basic |
30.61 |
30.89 |
31.10 |
31.05 |
|
Diluted |
31.24 |
31.42 |
31.45 |
31.37 |
Cash Flow Statement (₹ in crores)
|
|
Mar-18 |
Mar-19 |
Mar-20 |
Mar-21 |
|
Net Profit Before Tax |
386 |
507 |
492 |
453 |
|
Net Cash from Operating Activities |
230 |
(281) |
171 |
(1,502) |
|
Net Cash Used for Investing Activities |
(59) |
(76) |
(72) |
(79) |
|
Net Cash From (Used For) Financing Activities |
1,009 |
779 |
654 |
1,075 |
|
Net Increase in Cash and Cash Equivalents |
1,180 |
421 |
752 |
(507) |
|
Cash And Cash Equivalents at The Beginning of the Year |
1,192 |
2,372 |
2,793 |
3,546 |
|
Cash And Cash Equivalents at The End of the Year |
2,372 |
2,793 |
3,546 |
3,039 |
DCB Bank - Balance Sheet (₹ in crores)
|
|
Mar-18 |
Mar-19 |
Mar-20 |
Mar-21 |
|
CAPITAL & LIABILITIES: |
|
|
|
|
|
Capital |
308.08 |
309.55 |
310.42 |
310.54 |
|
Employee Stock Options (Grants Outstanding net of deferred cost) |
1.41 |
1.16 |
0.98 |
0.95 |
|
Reserves and Surplus |
2,498.34 |
2,804.90 |
3,110.76 |
3,447.10 |
|
Total Capital and Reserves |
2,807.83 |
3,115.60 |
3,422.15 |
3,758.59 |
|
|
||||
|
Deposits |
24,006.86 |
28,435.11 |
30,369.93 |
29,703.86 |
|
Borrowings |
1,926.71 |
2,723.20 |
3,407.95 |
4,482.25 |
|
Other Liabilities and Provisions |
1,480.69 |
1,517.91 |
1,305.11 |
1,657.43 |
|
Total Liabilities |
27,414.26 |
32,676.23 |
35,082.99 |
35,843.54 |
|
|
||||
|
Total Capital & Liabilities |
30,222.09 |
35,791.83 |
38,505.14 |
39,602.13 |
|
|
||||
|
ASSETS: |
||||
|
Cash and Balances with Reserve Bank of India |
1,136.39 |
1,317.22 |
1,029.80 |
1,182.89 |
|
Balances with Banks and Money at call and short Notice |
1,235.59 |
1,476.16 |
2,516.07 |
1,856.45 |
|
Investments |
6,218.96 |
7,844.09 |
7,741.50 |
8,413.69 |
|
Advances |
20,336.69 |
23,568.00 |
25,345.29 |
25,959.24 |
|
Fixed Assets |
494.02 |
525.98 |
545.87 |
568.51 |
|
Other Assets |
800.44 |
1,060.39 |
1,326.60 |
1,621.35 |
|
Total Assets |
30,222.09 |
35,791.83 |
38,505.14 |
39,602.13 |
|
|
Industry Overview
-
Indian Banking Industry has recently witnessed the rollout of innovative banking models like payments and small finance banks. RBI’s new measure may go a long way in helping the restructuring of the domestic banking industry.
-
The digital payment systems in India have evolved among 25 countries, with India’s Immediate Payment Services (IMPS) being the only system at level five in the faster payments Innovation Index (FPII).
-
The Indian Banking System consists of 12 public sectors, 22 private sector banks, 46 foreign banks, 56 regional banks, 1485 urban co-operative banks, and 96,000 rural co-operative banks in addition to co-operative credit institutions as of September 2021.
-
India Ratings and Research (Ind-Ra) has revised its outlook on the banking sector to ‘improving’ from ‘stable’ for FY 2023. The Agency expects credit growth to pick up to 10% and GNPA ratio of 6.1%.
-
As of February 2022, credit to non-food industries stood at ₹114.10 trillion.
-
As of February 21, 2022, the number of bank accounts opened under the government’s Flagships financial inclusion drive ‘Pradhan Mantri Jan Dhan’ (PMJDY)- reached 44.63 crores and deposits in the Jan Dhan Bank accounts totalled ₹1.58 trillion.
-
In January 2022, the Unified Payments Interface (UPI) recorded 4.62 billion transactions worth ₹8.32 trillion. The number of transactions through Immediate Payment Service (IMPS) reached 430.67 million and amounted to ₹3.70 million.
Concall Overview (Q3FY2022)
-
Net Interest Margin (NIM) is expected to improve as excess liquidity normalises.
-
Collection efficiency is around the pre-covid level. However, if customers are out of moratorium it takes 1 to 2 months to settle down the payment.
-
Slippages were higher during the quarter on account of gold loan slippages. Including a co-lending portfolio, the gold loan stood at 140 crores. Challenges in the gold book were primarily due to high covid-infection and are getting resolved in Q4FY2022.
-
As slippages are normalised, credit costs are expected to improve to pre-covid levels in 1 to 2 quarters.
DCB Bank - Technical Analysis
-
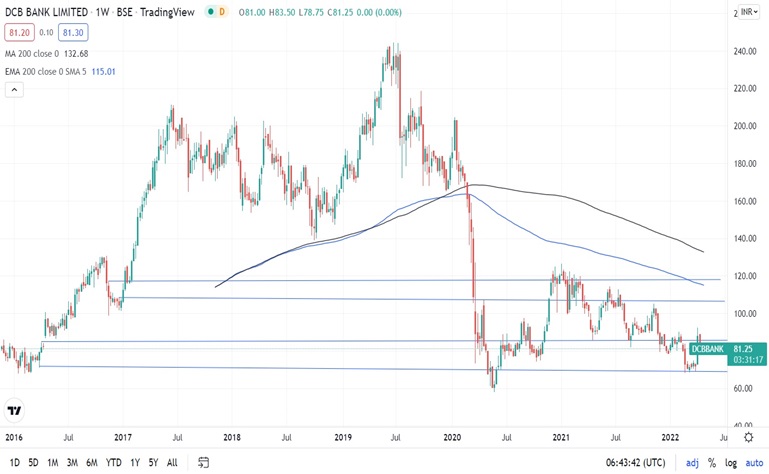
Stock is trading below EMA 200 and MA 200 indicators, with a strong support level of ₹86 and a resistance level of ₹118.
-
Share is consolidating at the current level and can break out once it crosses the level of ₹86
Recommendation Rationale:
-
DCB bank’s Revenue and PAT are improving Q-o-Q basis.
-
The capital Adequacy ratio was 18.21% as of Q3FY2022.
-
Covid-19 pandemic had witnessed a sharp rise in slippages which led to an increase in credit cost and weakening the profitability levels. The weakening in the asset quality was due to the bank’s customer profile, mainly comprised of small-ticket borrowers in the self-employed segment, which was more severely impacted by the pandemic. Collection and recoveries have helped the bank to offset the impact of high slippages to a certain extent. The overall books remain collateralized, thereby lowering credit losses.
-
The bank has steadily grown the retail term deposits (less than ₹ 2 crores) and reducing bulk deposits.
-
In Q3FY2022 Gross NPA was impacted by an increase in Gold Loans (including co-lending). It is expected to get improve by the end of Q4FY2022.
-
Recoveries and Upgrades remain high in 9 months (Q3FY2022) at ₹1,051 crores against gross slippages of ₹1,394 crores, which in turn keeps net slippages at relatively manageable levels.
-
Economic recovery, experience management, branch expansion plans, and improvement in deposits and loan books shall help the bank to have overall growth in terms of business and finance.
Valuation
-
The Bank’s Net Interest Income has increased at a CAGR of 8.98 % from FY 2019-2021
-
The Bank’s nine months (FY2022) performance was impacted due to the covid-19 pandemic and slow recoveries of amounts in the certain retail banking segment. There is a slight improvement in Net NPA in Q3FY2022 which is further expected to improve in the coming quarters.
|
Segment-wise Non-performing Assets (INR in Millions) |
|||
|
|
Q1FY2022 |
Q2FY2022 |
Q3FY2022 |
|
Mortgages |
4,716 |
4,479 |
3,853 |
|
SME-MSME |
1,509 |
1,367 |
1,198 |
|
Corporate |
836 |
834 |
1,016 |
|
AIB |
2,394 |
2,586 |
3,003 |
|
Gold Loans |
646 |
531 |
1,365 |
|
CV/STVL |
2,069 |
2,454 |
2,363 |
|
Others |
518 |
598 |
600 |
|
|
|||
|
Gross NPA |
12,688 |
12,849 |
13,398 |
|
Net NPA |
7,190 |
7,070 |
6,965 |
-
Based on the current performance of the company in the first nine months, we expect the company could post higher Net Interest income for the current financial (2022), corresponding to the previous year.
-
We have taken data for the last five years (2018-2021) and forecasted revenue for FY 2022-2026. Revenue growth is assumed to be 8%.
Estimated Income Statement (₹ in crores):
|
|
Mar-22 |
Mar-23 |
Mar-24 |
Mar-25 |
Mar-26 |
|
|
2022-E |
2023-E |
2024-E |
2025-E |
2026-E |
|
Interest income |
3,735 |
4,034 |
4,356 |
4,705 |
5,081 |
|
Interest Expended |
2,372 |
2,562 |
2,767 |
2,988 |
3,227 |
|
Net Interest Income |
1,363 |
1,472 |
1,589 |
1,717 |
1,854 |
|
|
|
|
|
|
|
|
Other income |
500 |
545 |
594 |
647 |
705 |
|
Total income |
1,862 |
2,016 |
2,183 |
2,364 |
2,559 |
|
|
|
|
|
|
|
|
Payments to and Provisions for employee |
486 |
524 |
566 |
612 |
661 |
|
Other expenses |
448 |
484 |
523 |
565 |
610 |
|
Provision and Contingencies |
560 |
605 |
653 |
706 |
762 |
|
EBT |
368 |
403 |
441 |
482 |
527 |
|
|
|
|
|
|
|
|
Tax expenses |
95 |
104 |
114 |
125 |
136 |
|
PAT |
273 |
299 |
327 |
357 |
391 |
-
We initiate coverage on DCB Bank Limited with a “BUY” and a 1-year Target Price of ₹ 107.
Disclaimer: This report is only for the information of our customers Recommendations, opinions, or suggestions are given with the understanding that readers acting on this information assume all risks involved. The information provided herein is not to be construed as an offer to buy or sell securities of any kind.
- Share :


Post a Comment
|
DISCLAIMER |
This report is only for the information of our customers. Recommendations, opinions, or suggestions are given with the understanding that readers acting on this information assume all risks involved. The information provided herein is not to be construed as an offer to buy or sell securities of any kind. ATS and/or its group companies do not as assume any responsibility or liability resulting from the use of such information.