DCB Bank Ltd.
DCB Bank Ltd.
|
Current price |
114.35 |
|
Sector |
BANKING |
|
No of shares |
281493393 |
|
52 week high |
127.00 |
|
52 week low |
59.00 |
|
BSE Sensex |
28260.14 |
|
Nifty |
8586.25 |
|
Average Volume |
1234642 |
|
BSE Code |
532772 |
|
NSE Symbol |
DCBBANK |
DCB Bank Ltd - Company Overview
Development Credit Bank is one of the emerging private sector banks in India. Their network spread over 10 states and 2 union territories namely of Maharashtra, Gujarat, Andhra Pradesh, Karnataka, New Delhi, Rajasthan, Goa, Tamil Nadu, Haryana, West Bengal, Daman and Diu, and Dadra and Nagar Haveli. The Bank operates in four business segments, namely treasury operations, corporate, retail and other banking operations. Development Credit Bank was started as a Credit Society in the 1930s. Eventually, Diamond Jubilee Co-operative Bank Ltd merged with Ismailia Co-operative Bank Ltd. In the year 1981, Ismailia Co-operative Bank Ltd was amalgamated with Masalawalla Co-operative Bank Ltd to form the Development Co-operative Bank Ltd. Later, Citi Cooperative Bank Ltd merged with Development Co-operative Bank Ltd. In the year 1995, Development Co-operative Bank Ltd was converted into Development Credit Bank Ltd.
DCB Bank is a modern emerging new generation private sector bank with 134 plus branches across 17 states and 2 union territories. Which resulting in sticky customer deposits from traditional customers. New branch expansions in Madhya Pradesh, Odisha, Punjab, Rajasthan. It is a scheduled commercial bank regulated by the Reserve Bank of India. It is professionally managed and governed. DCB Bank has contemporary technology and infrastructure including state of the art internet banking for personal as well as business banking customers. DCB Bank’s business segments are retail, micro-SMEs, SMEs, mid-Corporate, Agriculture, commodities, government, PSUs, Indian banks, co-operative banks and Non- Banking Finance Companies (NBFCs). The bank has Comprehensive range of banking products across all businesses. Management continued to maintain a cautious stance on MSME book due to stress in this segment.
DCB reshaped its strategy of refocusing on small-ticket loans. DCB Bank Ltd continued to build granularity in loan book by focusing on secured lending like mortgages and reduced lumpy exposures. Going ahead, DCB to further double its balance sheet in the next three years in sync with management guidance. The current market capitalisation stands at Rs 3,178.28 crore.
DCB Bank Ltd - Share Holding Pattern
|
Category |
No. of Shares |
Percentage |
|
Promoters |
2,450,182 |
0.98 |
|
General Public |
75,599,178 |
30.15 |
|
Foreign Promoters |
43,750,052 |
17.45 |
|
Foreign Institutions |
37,219,787 |
14.84 |
|
Other Companies |
30,552,076 |
12.18 |
|
NBFC and MutualFunds |
25,280,158 |
10.08 |
|
Financial Institutions |
15,717,856 |
6.27 |
|
Foreign - OCB |
11,745,484 |
4.68 |
|
Foreign - NRI |
6,481,431 |
2.58 |
|
Others |
1,518,232 |
0.61 |
|
Directors |
459,786 |
0.18 |
Financial Details
-
Market Cap (Rs Cr) – 3186.74
-
Company P/E (x) – 19.06
-
Industry P/E (x) – 23.04
-
Book Value (Rs) – 41.94
-
Price / BV (x) – 2.69
-
Dividend (%) – Nil
-
EPS (TTM) – 5.93
-
Dividend Yield (%) – Nil
-
Face Value (Rs) – 10
Industry Overview
The banking sector in India is on a growing trend. It has vastly benefitted from the surge in disposable income of individuals in the country. There has also been a noticeable upsurge in transactions through ATMs, and also internet and mobile banking. Consequently, the different banks, viz public, private and foreign banks have invested considerably to increase their banking network and thus, their customer reach. The Indian banking sector is fragmented, with 46 commercial banks jostling for business with dozens of foreign banks as well as rural and co-operative lenders.
Indian banking industry, with total asset size of Rs 81 trillion (USD 1.34 trillion), is expanding continuously but on a cautious note. The fact that the industry is plagued by bad loans, the lenders have chosen to go slow in terms of credit off take. Fiscal 2014 saw a combination of various external and internal events that kept markets turbulent, interest rates high and investor confidence low, resulting in shrinking investment and GDP growth.
Total banking sector credit is anticipated to grow at a CAGR of 18.1 percent to reach US$ 2.4 trillion by 2017. The total banking assets in India touched US$ 1.8 trillion in FY13 and are anticipated to cross US$ 28.5 trillion in FY25. To help Micro Small and Medium Enterprises (MSME), RBI has permitted setting up of an exchange- based trading platform to facilitate financing of bills raised by such small entities to corporate and other buyers, including government departments and PSUs. Powered by an economy which is slated to grow at 7% to 9% and the fact that India is under-penetrated in Banking. This industry is also expected to have a healthy growth of over 15% in the next 3 to 4 years.
With the advancements in technology, mobile and internet banking services have come to the fore. Banks in India are focusing more and more to provide better services to their clients and have also started upgrading their technology infrastructure, which can help improve customer experience as well as give banks a competitive edge.
Balance Sheet
|
|
Mar '14 |
Mar '13 |
Mar '12 |
Mar '11 |
Mar '10 |
|
Capital and Liabilities: |
|
|
|
|
|
|
Total Share Capital |
250.32 |
250.11 |
240.67 |
200.17 |
199.99 |
|
Equity Share Capital |
250.32 |
250.11 |
240.67 |
200.17 |
199.99 |
|
Share Application Money |
2.96 |
3.02 |
2.82 |
2.81 |
2.12 |
|
Reserves |
900.67 |
749.93 |
562.91 |
362.35 |
340.34 |
|
Net Worth |
1,153.95 |
1,003.06 |
806.40 |
565.33 |
542.45 |
|
Deposits |
10,325.16 |
8,363.84 |
6,335.56 |
5,610.17 |
4,787.33 |
|
Borrowings |
860.16 |
1,525.62 |
1,123.45 |
860.72 |
503.51 |
|
Total Debt |
11,185.32 |
9,889.46 |
7,459.01 |
6,470.89 |
5,290.84 |
|
Other Liabilities & Provisions |
583.86 |
386.31 |
356.48 |
279.97 |
244.72 |
|
Total Liabilities |
12,923.13 |
11,278.83 |
8,621.89 |
7,316.19 |
6,078.01 |
|
Assets |
|
|
|
|
|
|
Cash & Balances with RBI |
505.07 |
378.77 |
407.50 |
404.51 |
291.36 |
|
Balance with Banks, Money at Call |
184.50 |
504.49 |
49.05 |
82.60 |
40.98 |
|
Advances |
8,140.19 |
6,586.09 |
5,284.42 |
4,271.45 |
3,459.71 |
|
Investments |
3,634.22 |
3,358.66 |
2,517.76 |
2,295.04 |
2,017.93 |
|
Gross Block |
238.64 |
236.09 |
215.38 |
205.68 |
204.07 |
|
Revaluation Reserves |
0.00 |
0.00 |
54.97 |
56.15 |
58.65 |
|
Accumulated Depreciation |
0.00 |
0.00 |
89.50 |
78.18 |
68.31 |
|
Net Block |
238.64 |
236.09 |
70.91 |
71.35 |
77.11 |
|
Capital Work In Progress |
0.00 |
3.36 |
58.76 |
0.00 |
0.00 |
|
Other Assets |
220.51 |
211.38 |
233.47 |
191.23 |
190.92 |
|
Total Assets |
12,923.13 |
11,278.84 |
8,621.87 |
7,316.18 |
6,078.01 |
|
Contingent Liabilities |
2,951.49 |
4,952.24 |
3,080.67 |
2,998.17 |
3,821.53 |
|
Bills for collection |
0.00 |
0.00 |
630.58 |
786.00 |
751.01 |
|
Book Value (Rs) |
45.98 |
39.98 |
33.39 |
28.10 |
27.02 |
Profit and Loss Account
|
|
Mar '14 |
Mar '13 |
Mar '12 |
Mar '11 |
Mar '10 |
|
Income |
|
|
|
|
|
|
Interest Earned |
1,128.26 |
916.10 |
716.97 |
536.26 |
459.40 |
|
Other Income |
138.66 |
117.02 |
102.73 |
112.10 |
107.09 |
|
Total Income |
1,266.92 |
1,033.12 |
819.70 |
648.36 |
566.49 |
|
Expenditure |
|
|
|
|
|
|
Interest expended |
759.87 |
631.69 |
489.27 |
347.12 |
317.42 |
|
Employee Cost |
157.08 |
137.90 |
124.59 |
106.37 |
88.05 |
|
Selling, Admin & Misc Expenses |
180.64 |
147.83 |
138.80 |
160.29 |
224.10 |
|
Depreciation |
17.97 |
13.64 |
11.97 |
13.15 |
15.38 |
|
Operating Expenses |
319.09 |
275.30 |
271.21 |
261.89 |
314.33 |
|
Provisions & Contingencies |
36.60 |
24.07 |
4.15 |
17.92 |
13.20 |
|
Total Expenses |
1,115.56 |
931.06 |
764.63 |
626.93 |
644.95 |
|
Net Profit for the Year |
151.36 |
102.06 |
55.08 |
21.43 |
-78.45 |
|
Extraordinary Items |
0.00 |
0.00 |
0.00 |
0.00 |
0.00 |
|
Profit brought forward |
-249.47 |
-323.36 |
-364.54 |
-378.37 |
-299.89 |
|
Total |
-98.11 |
-221.30 |
-309.46 |
-356.94 |
-378.34 |
|
Per share data (annualised) |
|
|
|
|
|
|
Earning Per Share (Rs) |
6.05 |
4.08 |
2.29 |
1.07 |
-3.92 |
|
Book Value (Rs) |
45.98 |
39.98 |
33.39 |
28.10 |
27.02 |
|
Appropriations |
|
|
|
|
|
|
Transfer to Statutory Reserves |
40.30 |
28.17 |
13.89 |
7.60 |
0.03 |
|
Transfer to Other Reserves |
-138.40 |
-249.47 |
-323.36 |
-364.55 |
-378.37 |
|
Balance c/f to Balance Sheet |
-138.41 |
-249.47 |
-323.36 |
-364.54 |
-378.37 |
|
Total |
-236.51 |
-470.77 |
-632.83 |
-721.49 |
-756.71 |
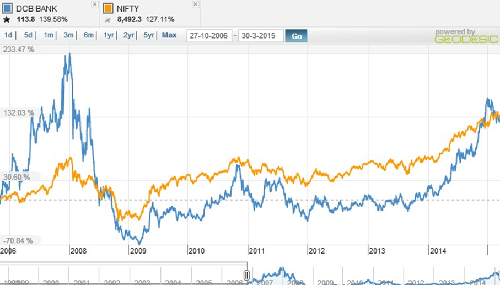
Index and Company Price Movement Comparison
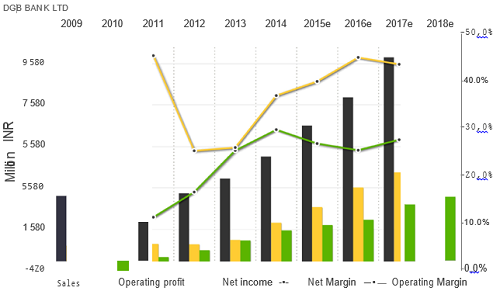
Company Forecast
Technical Indicators
|
Symbol |
Value |
Action |
|
RSI(14) |
64.783 |
Buy |
|
STOCH(9,6) |
39.560 |
Sell |
|
STOCHRSI(14) |
38.355 |
Sell |
|
MACD(12,26) |
1.450 |
Buy |
|
ADX(14) |
59.483 |
Buy |
|
Williams %R |
-32.967 |
Buy |
|
CCI(14) |
80.1133 |
Buy |
|
ATR(14) |
1.3964 |
Less Volatility |
|
Highs/Lows(14) |
0.2357 |
Buy |
|
Ultimate Oscillator |
53.187 |
Buy |
|
ROC |
1.614 |
Buy |
|
Bull/Bear Power(13) |
3.2340 |
Buy |
Important Ratios (YoY)
-
RoE – 14.03 v/s 10.95
-
Net Profit Margin – 11.94 v/sw 9.87
-
Return on net worth – 13.15 v/s 10.20
-
Reserves – 900.67 cr v/s 749.93 cr
-
PAT – 151.36 cr v/s 102.06
-
Total assets – 12923.13 cr v/s 11278.84 cr
-
Interest earned – 1128.26 cr v/s 916.10 cr
-
EBIT – 205.94 cr v/s 139.77 cr
-
OPM – 5.96 v/s 2.48
-
Book Value – 45.98 v/s 39.98
Simple Moving Average
|
Days |
BSE |
NSE |
|
30 |
109.78 |
109.76 |
|
50 |
112.42 |
112.40 |
|
150 |
102.89 |
102.91 |
|
200 |
97.04 |
97.0 |
Investment Rationalize
-
DCB Bank is one of the fastest-growing private sector banks in India with more than 140 branches spread over 17 states with a growth oriented and low risk business model. Trade Finance Business – East Africa will add to the profits of the company.
-
Gross NPAs decreased by Rs.77 crore and the overall NPA coverage ratio was 81%. Gross NPAs have decreased to Rs.138.45 crore as on 31st March, 2014 from Rs.214.98 crore as on 31st March 2013. The overall NPA Provision Coverage Ratio as on 31st March, 2014 was 80.54%. Trade Finance Business – East Africa will add to the profits of the company.
-
DCB Bank Ltd has posted and Operating Profit of Rs.187.96 crore (previous year Rs.126.13 crore) and a Net Profit of Rs.151.36 crore (previous year Rs.102.06 crore). Trade Finance Business – East Africa will add to the profits of the company.
-
The Bank’s target market is the self-employed segment (traders, shop keepers, small businessmen, MSMEs and SMEs). MSME / SME sector plays a very important role in the growth of the Indian economy. It is estimated that MSME / SME contribute 17% to GDP and employs over 70 mn people in about 30 mn units. Further, MSME / SME is estimated to contribute 45% of India’s industrial output and 40% of export which provides a huge growth potential. Trade Finance Business – East Africa will add to the profits of the company.
-
DCB Bank Ltd is expanding at a fast pace i.e. 25-30 new branches in every year which allows the company to tap the growth potential not only in cities but also in tier 2 – tier 6 locations. Trade Finance Business – East Africa will add to the profits of the company.
-
DCB Bank Ltd has been able to sustain the growth even in the adverse market conditions and its gives an idea about the banks growth potential when the economic condition improves. Trade Finance Business – East Africa will add to the profits of the company.
-
RBI measures non cutting interest rates and governments emphasis on “Make in India” and development measures towards SME/MSME will add to the profits of the bank. Trade Finance Business – East Africa will add to the profits of the company.
-
Allied financial services such as Insurance, Portfolio Management services, Foreign Exchange and Trade Finance Business – East Africa will add to the profits of the company.
- Share :


Post a Comment
|
DISCLAIMER |
This report is only for the information of our customers. Recommendations, opinions, or suggestions are given with the understanding that readers acting on this information assume all risks involved. The information provided herein is not to be construed as an offer to buy or sell securities of any kind. ATS and/or its group companies do not as assume any responsibility or liability resulting from the use of such information.