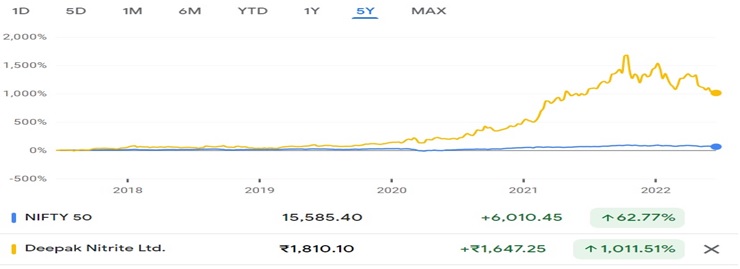
Deepak Nitrite Limited Research Report
|
Industry |
Market Price |
Recommendation |
Target |
Time Horizon |
|
Chemical |
1,797.75 |
Buy |
2,333 |
1 year |
Q4 FY 2022 Review
Deepak Nitrite Limited reported net revenue of ₹1,872.35 crores for the quarter ended March 31, 2022, compared to ₹1,463.23 crores for March 31, 2021. EBIT and Profit After Tax were ₹369.25 crores and ₹267.21 crores for the quarter ended March 31, 2022, as compared to ₹404.14 crores and ₹290.11 crores, during the corresponding quarter of the previous year.
Deepak Nitrite Limited - Investment Summary
|
CMP (₹) |
1,797.75 |
|
52 Week H/L |
1,700/3,020 |
|
Market Cap (crores) |
24,520 |
|
Face Value (₹) |
2.00 |
|
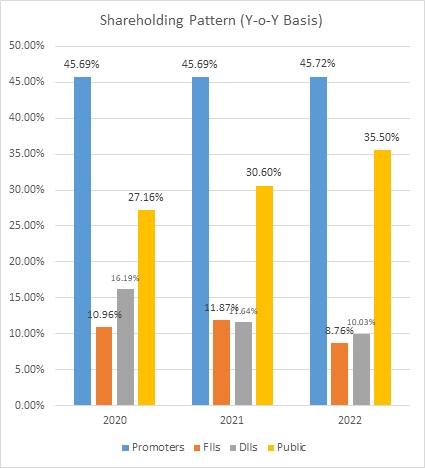
Promoter Holding (%) |
45.72 |
|
Non-Promoter Holding (%) |
54.28 |
|
Total (%) |
100.00 |
|
Book Value |
₹244.75 |
|
EPS TTM |
₹78.20 |
Deepak Nitrite Limited - Overview
-
Deepak Nitrite Limited is a chemical manufacturing company based in Gujarat, India.
-
It is the leading manufacturer of organic, inorganic, fine, and specialty chemicals.
-
On June 2, 2022, the fire caused damages to the warehouse, offices, utilities, and part of the manufacturing facility; the impact is still being assessed, but no casualties are reported and both loss of assets, as well as loss of business, are covered under insurance.
-
The company has been assigned an AA credit rating on a long-term bank facility.
Beta: 1.11 |
Alpha: 60.33 |
Risk Reward Ratio: 1.48 |
Margin of Safety: 24% |
Deepak Nitrite Limited - Quarterly Summary
|
Quarterly (INR in crores) |
Mar-22 |
Dec-21 |
Sep-21 |
Jun-21 |
Mar-21 |
|
Revenue from Operations |
1,872 |
1,722 |
1,681 |
1,526 |
1,463 |
|
Other income |
4 |
26 |
8 |
8 |
6 |
|
Total Income |
1,876 |
1,748 |
1,689.78 |
1,534 |
1,469 |
|
|
|
|
|
|
|
|
Total Expenditure |
1507 |
1416 |
1339 |
1118 |
1065 |
|
EBIT |
369 |
332 |
351 |
416 |
404 |
|
|
|
|
|
|
|
|
Finance cost |
7 |
7 |
9 |
11 |
14 |
|
EBT before Exceptional Items |
362 |
325 |
342 |
405 |
390 |
|
|
|
|
|
|
|
|
Tax Expenses |
95 |
83 |
87 |
103 |
100 |
|
PAT |
267 |
242 |
254 |
303 |
290 |
Business
-
Deepak Nitrite Limited (DNL) is the flagship of the Deepak Group, which was incorporated in 1970 by C.K. Mehta.
-
It began as a fully indigenous sodium nitrite and sodium nitrate manufacturer before gradually widening its product portfolio over the years.
-
The company has five manufacturing facilities, Nandesari and Dahej in Gujarat, Taloja and Roha in Maharashtra, and Hyderabad in Telangana.
-
DNL also has a research and development facility at Nandesari in Gujarat.
-
The company’s growth has also been aided by the strategic acquisition of companies with complementary product lines.
-
In November 2018, the company commissioned its phenol and acetone manufacturing plant at Dahej under its wholly-owned subsidiary, Deepak Phenolics Limited.
-
DNL caters to over 1000 customers in 6 countries with more than 100 products.
-
Some of the company’s notable clients include BASF, Biocon, Reliance, Syngenta, Aarti Drugs, PI Industries, Atul, Lupin, and many more.
-
The company is amongst the top 3 global players for the products like Xylidines, Cumidines, and Oximes.
-
The company’s product portfolio is broadly divided into three parts:
-
Basic Chemicals:
-
Within basic chemicals, DNL manufactures nitrites, nitrogen toluidines, and fuel additives.
-
As most of these chemicals are manufactured and sold in high volumes with higher price sensitivity, cost leadership plays a pivotal role in gaining competitive advantages, which drives growth and profitability.
-
User industries for Basic Chemicals:
-
Colourants.
-
Rubber Chemicals.
-
Pigments.
-
Explosives.
-
Dyes.
-
Pharmaceuticals.
-
And many more.
-
-
-
Fine Specialty Chemicals:
-
DNL manufactures niche and specialized products under the Fine and Specialty Chemicals segments.
-
These are developed in-house, using the company’s expertise in process engineering and technical know-how.
-
Among other things, it produces specialty chemicals such as Xylidines, Oximes, and Cumidines.
-
User industries for Fines Speciality Chemicals:
-
Agro-Chemicals.
-
Colourants.
-
Pigments
-
Pharmaceuticals and Personal Wellness.
-
-
-
Performance Products:
-
The Performance Products segment of the company has two essential products at present: Optical Brightening Agents and DASDA.
-
These products have specific attributes and serve to enable particular characteristics to the end-products.
-
User industries for Performance Products:
-
Paper.
-
Detergents.
-
Textiles.
-
-
-
-
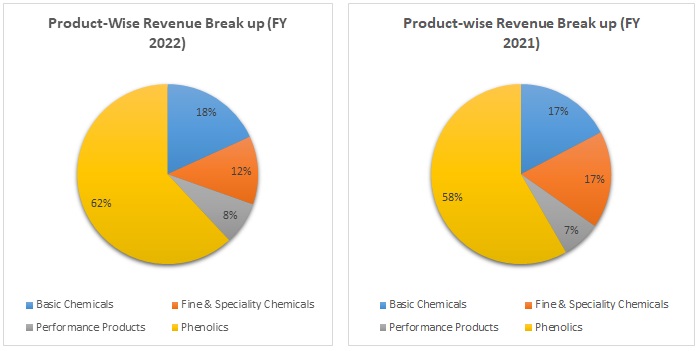
Out of the total revenue, 62% of revenue have generated from Phenolics, 18% from Basic Chemicals, 12% from Fine & Speciality Chemicals, and 8% from Performance Products in FY 2022, compared to 58%, 17%, 17% and 7% in FY 2020.
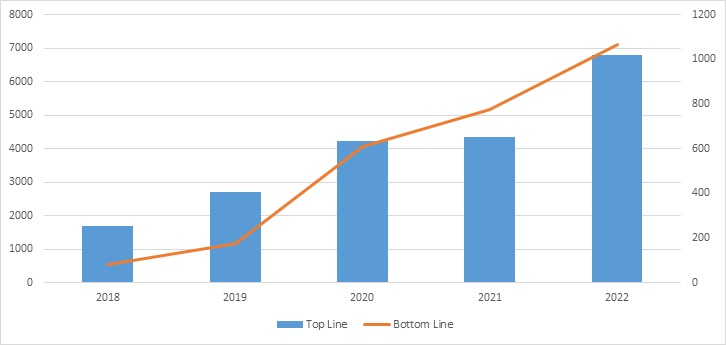
Deepak Nitrite Limited - Revenue Trend
Topline and Bottomline trend (crores)
Ratio Analysis
|
|
Mar-19 |
Mar-20 |
Mar-21 |
Mar-22 |
|
Profitability Ratio |
|
|
|
|
|
Gross Profit |
40% |
45% |
49% |
40% |
|
EBITDA Margin |
15.89% |
25.08% |
29.10% |
24.20% |
|
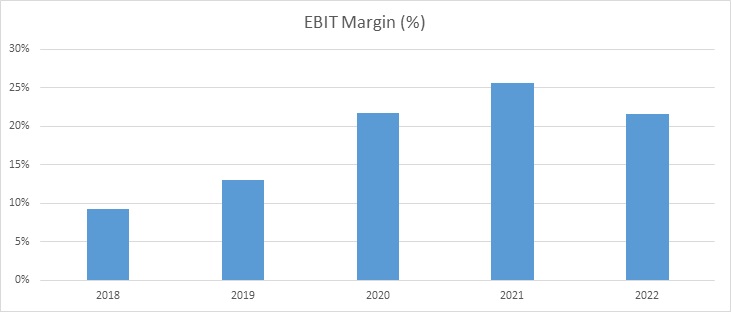
EBIT Margin |
13.01% |
21.78% |
25.60% |
21.59% |
|
Pre-Tax Margin |
9.93% |
19.07% |
23.89% |
21.09% |
|
Net Profit Margin |
6.43% |
14.45% |
17.79% |
15.68% |
|
|
||||
|
Return on Investment |
||||
|
Return on Asset – ROA |
6.29% |
19.91% |
22.92% |
26.70% |
|
Return on Capital Employed – ROCE |
19.58% |
40.91% |
40.83% |
43.90% |
|
Return on Equity – ROE |
17.42% |
46.23% |
39.60% |
37.52% |
|
|
||||
|
Liquidity Ratio |
||||
|
Current ratio (x) |
1.31 |
1.54 |
2.62 |
3.06 |
|
Quick Ratio |
0.85 |
1.02 |
1.93 |
2.28 |
|
|
||||
|
Turnover Ratio |
||||
|
Receivables Turnover |
5.47 |
7.12 |
6.36 |
7.21 |
|
Inventory Turnover |
4.47 |
5.89 |
5.82 |
8.50 |
|
Payables Turnover |
3.45 |
5.77 |
5.81 |
9.13 |
|
Asset Turnover |
0.97 |
1.37 |
1.28 |
1.70 |
|
|
||||
|
Solvency Ratio |
||||
|
Debt to Equity |
0.81 |
0.50 |
0.22 |
0.06 |
|
Interest Coverage Ratio |
4.22 |
8.02 |
15.04 |
43.14 |
Deepak Nitrite Limited - Financial Overview
Deepak Nitrite Limited - Profit and Loss Statement (₹ in crores)
|
|
Mar-19 |
Mar-20 |
Mar-21 |
Mar-22 |
|
Revenue from Operations |
2699.92 |
4229.71 |
4359.75 |
6802.19 |
|
Other Income |
15.12 |
35.2 |
21.52 |
42.61 |
|
Total Revenue |
2715.04 |
4264.91 |
4381.27 |
6844.8 |
|
|
|
|
|
|
|
Cost of Goods Sold |
1646.7 |
2373.5 |
2264.26 |
4114.35 |
|
Gross Profit |
1068.34 |
1891.41 |
2117.01 |
2730.45 |
|
|
|
|
|
|
|
Excise Duty |
0 |
0 |
0 |
0 |
|
Employee Benefits Expense |
179.77 |
216.96 |
247.04 |
274.11 |
|
Power & Fuel Expense |
207.33 |
285.19 |
264.74 |
438.61 |
|
Other Expenses |
252.23 |
328.26 |
336.68 |
371.54 |
|
EBITDA |
429.01 |
1061 |
1268.55 |
1646.19 |
|
|
|
|
|
|
|
Depreciation and Amortisation |
77.79 |
139.73 |
152.63 |
177.7 |
|
EBIT |
351.22 |
921.27 |
1115.92 |
1468.49 |
|
|
|
|
|
|
|
Finance Costs |
83.24 |
114.87 |
74.2 |
34.04 |
|
EBT |
267.98 |
806.4 |
1041.72 |
1434.45 |
|
|
|
|
|
|
|
Tax Expenses |
94.32 |
195.37 |
265.91 |
367.81 |
|
PAT |
173.66 |
611.03 |
775.81 |
1066.64 |
|
|
|
|
|
|
|
EPS |
|
|
|
|
|
Basic |
12.73 |
44.8 |
56.88 |
78.2 |
|
Diluted |
12.73 |
44.8 |
56.88 |
78.2 |
|
|
|
|
|
|
|
Number of Shares |
|
|
|
|
|
Basic |
13.64 |
13.64 |
13.64 |
13.64 |
|
Diluted |
13.64 |
13.64 |
13.64 |
13.64 |
Deepak Nitrite Limited - Cash Flow Statement (₹ in crores)
|
|
Mar-19 |
Mar-20 |
Mar-21 |
Mar-22 |
|
Net Profit Before Tax |
267.98 |
806.4 |
1041.72 |
1434.45 |
|
Net Cash from Operating Activities |
60.27 |
764.66 |
1001.9 |
823.84 |
|
Net Cash Used for Investing Activities |
-162.55 |
-427.92 |
-396.16 |
-424.05 |
|
Net Cash From (Used For) Financing Activities |
345.32 |
95.81 |
-337.56 |
-598.99 |
|
Net Increase in Cash and Cash Equivalents |
-6.47 |
-0.82 |
6.75 |
13.97 |
|
Cash And Cash Equivalents at The Beginning of The Year |
9.42 |
2.95 |
2.13 |
8.88 |
|
Cash And Cash Equivalents at The End of the Year |
2.95 |
2.13 |
8.88 |
22.85 |
Deepak Nitrite Limited - Balance Sheet (₹ in crores)
|
|
Mar-19 |
Mar-20 |
Mar-21 |
Mar-22 |
|
ASSETS: |
|
|
|
|
|
Non-Current Assets |
|
|
|
|
|
Property, Plant, and Equipment |
1700.56 |
1787.56 |
1835.69 |
1932.68 |
|
Right-of-use Assets |
0 |
14.35 |
0 |
0 |
|
Capital Work-in-Progress |
33.87 |
172.27 |
206.76 |
103.69 |
|
Intangible Assets |
15.27 |
30.07 |
28.05 |
30.75 |
|
Intangible Assets Under Development |
0 |
0 |
13.68 |
18.54 |
|
Financial Asset: |
|
|
|
|
|
Investment |
2.39 |
2.38 |
2.5 |
2.23 |
|
Loans |
1.36 |
1.06 |
0.79 |
0.76 |
|
Other Financial Assets |
6.76 |
8.8 |
8.76 |
8.89 |
|
Non-Current Tax Assets |
2.04 |
6 |
0 |
0.98 |
|
Other Non-Current Assets |
3.81 |
29.82 |
11.89 |
47.2 |
|
Total Non-Current Assets |
1766.06 |
2052.31 |
2108.12 |
2145.72 |
|
|
|
|
|
|
|
Current Assets: |
|
|
|
|
|
Inventories |
410.73 |
394.5 |
382.69 |
584.55 |
|
Financial Assets: |
|
|
|
|
|
Investments |
0 |
0 |
186.79 |
436.79 |
|
Trade Receivables |
574.96 |
612.72 |
756.3 |
1129.06 |
|
Cash and Cash Equivalents |
2.96 |
2.14 |
8.89 |
22.85 |
|
Other Bank Balances |
22.81 |
29.26 |
24.54 |
18.94 |
|
Loans |
0 |
0 |
0.57 |
0.41 |
|
Other Financial Assets |
1.91 |
1.62 |
2.76 |
2.98 |
|
Current Assets |
0 |
0 |
5.09 |
6.16 |
|
Other Current Assets |
148 |
113.83 |
82.83 |
81.61 |
|
Assets Classified as Held for Sale |
0.35 |
2.23 |
1.72 |
1.39 |
|
Total Current Assets |
1161.72 |
1156.3 |
1452.18 |
2284.74 |
|
|
|
|
|
|
|
Total Assets |
2927.78 |
3208.61 |
3560.3 |
4430.46 |
|
|
|
|
|
|
|
EQUITY & LIABILITIES: |
|
|
|
|
|
Equity: |
|
|
|
|
|
Equity Share Capital |
27.28 |
27.28 |
27.28 |
27.28 |
|
Other Equity |
1044.31 |
1544.63 |
2319.37 |
3311.16 |
|
Total Equity |
1071.59 |
1571.91 |
2346.65 |
3338.44 |
|
|
|
|
|
|
|
Liabilities: |
|
|
|
|
|
Non-Current Liabilities: |
|
|
|
|
|
Financial Liabilities: |
|
|
|
|
|
Borrowings |
869.86 |
779.43 |
524.04 |
187.49 |
|
Lease Liabilities |
0 |
13.46 |
10.76 |
12.88 |
|
Provisions |
11.44 |
14.4 |
17.2 |
21.86 |
|
Deferred Tax Liabilities |
77.46 |
79.61 |
107.81 |
122.87 |
|
Other Non-Current Liabilities |
13.8 |
0.85 |
0.36 |
0 |
|
Total Non-Current Liabilities |
972.56 |
887.75 |
660.17 |
345.1 |
|
|
|
|
|
|
|
Current Liabilities: |
|
|
|
|
|
Financial Liabilities: |
|
|
|
|
|
Borrowings |
255.05 |
248.42 |
53.5 |
113.19 |
|
Lease Liabilities |
0 |
1.93 |
1.44 |
1.47 |
|
Trade Payables: |
|
|
|
|
|
Micro and Small Enterprises |
7.77 |
6.7 |
15.04 |
32.37 |
|
Other Creditors |
464.66 |
357.56 |
421.7 |
479.34 |
|
Other Financial Liabilities |
115.9 |
108.57 |
32.44 |
42.11 |
|
Other Current Liabilities |
28.89 |
12.76 |
17.39 |
68.35 |
|
Provisions |
7.62 |
12.04 |
10.38 |
7.7 |
|
Current Tax Liabilities |
3.74 |
0.97 |
1.59 |
2.39 |
|
Total Current Assets |
883.63 |
748.95 |
553.48 |
746.92 |
|
|
|
|
|
|
|
Total Equity & Liabilities |
2927.78 |
3208.61 |
3560.3 |
4430.46 |
Industry Overview
-
India is the 6th largest producer of chemicals in the world and the 3rd largest in Asia.
-
India is the 4th largest producer of agrochemicals in the world and manufactures more than 50% of technical-grade pesticides.
-
The chemicals and petrochemicals industry is expected to reach $300 billion by 2025.
-
The chemical sector is the integral constituent of the growing Indian industry.
-
The diversification within the chemical industry is large and covers more than eighty thousand commercial products.
-
The total budget allocation for FY 2022-23 towards the Department of Chemicals and Petrochemicals is ₹209 crore.
-
The total budget allocation for FY 2022-23 towards the Department of Fertilizers is ₹1,05,262.23 crore.
-
The Government of India has conceptualized PCPIRs as clusters that provide investors with transparent and investment-friendly policy and facility regimes.
-
The Department of Chemicals and Petrochemicals has formulated the Scheme for setting up Plastic Parks with the objective of synergizing and consolidating the various units of the Indian Plastic Industry.
-
The structure of China’s chemical industry is changing due to the stricter environmental norms, tighter financing, and consolidation. These could cause uncertainty for international players that source chemicals from China. That could create opportunities for India’s chemical companies in certain value chains and segments.
Concall Overview (Q4FY2022)
-
Volume growth for several products during Q4FY 2022 enabled the company to deliver traction in revenue.
-
In Fine and Specialty Chemicals, Deepak Nitrite would gain a new multi-year contract with leading customers, with pass-through cost mechanisms in place.
-
Phenolics business utilization was around 118% for Q4FY2022.
-
Domestic export stood at 80:20 in Q4FY2022.
-
Over the next two years, the company will invest 15 billion in new upstream/downstream products besides debottlenecking projects in the existing product line.
-
Performance products segment EBIT is expected to normalize as there is tepid demand in the European markets, experiencing the highest energy prices.
Deepak Nitrite Limited - Technical Analysis
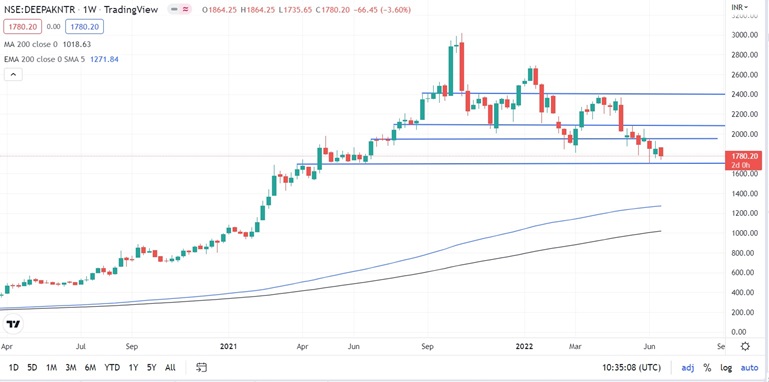
-
Stock is trading above EMA 200 and MA 200 indicators, with a strong support level of ₹1,691 and a resistance level at ₹2,400.
-
One can accumulate this share at the current price.
Recommendation Rationale:
-
In FY 2022, Deepak Nitrite Limited’s revenue increased by 56.02% to ₹6,802.19 crores, compared to the previous year at ₹4,359.74. Profit After Tax increased by 37.48% to ₹1,066.64 crores compared to the last year at ₹775.81 crores.
-
The company has long operating history and established position in the global chemical intermediates industry.
-
The company started with a limited portfolio of low-value bulk chemicals; it has grown its product portfolio to include high-value specialty chemicals for multiple end-user applications.
-
Deepak Nitrite has a 70% market share in sodium nitrite and nitro toluidines in India.
-
Healthy improvement in financials of the company.
-
The company has negligible debt.
-
Besides India, DNL has developed a strong presence in key geographies, including the United States, Europe, and China.
-
DNL has successfully substituted imports of key products such as phenol and acetone, saving millions of dollars of foreign exchange and ensuring self-sufficiency.
-
The intention of global majors to minimize the reliance on China gives existing chemical intermediate players in India new opportunities to demonstrate their capabilities on a global level.
Valuation
-
The company’s revenue has increased at a CAGR of 42% from FY 2018-2022.
-
The company can sustain healthy revenue growth and profit margins on a consolidated basis, backed by a change in the product mix towards more value-added products.
-
The company’s ROE and ROCE are 37.52% and 43.90%.
-
The company could face challenges like volatility in prices of raw materials, fluctuation in foreign exchange, and scarcity of energy exchange.
-
We have taken data for the last five years (2018-2022) and forecasted revenue for FY 2023-2027. Revenue growth is assumed to be 10%-12%.
Estimated Income Statement (₹ in crores):
-
We initiate coverage on Deepak Nitrite Limited with a “BUY” and a 1-year Target Price of 2,333.
Disclaimer: This report is only for the information of our customers. Recommendations, opinions, or suggestions are given with the understanding that readers acting on this information assume all risks involved. The information provided herein is not to be construed as an offer to buy or sell securities of any kind.
- Share :


Post a Comment
|
DISCLAIMER |
This report is only for the information of our customers. Recommendations, opinions, or suggestions are given with the understanding that readers acting on this information assume all risks involved. The information provided herein is not to be construed as an offer to buy or sell securities of any kind. ATS and/or its group companies do not as assume any responsibility or liability resulting from the use of such information.