Dynamics Technologies Limited Research Report
|
Industry |
Market Price |
Recommendation |
Target |
Time Horizon |
|
Misc. Capital Goods |
2,383 |
Buy |
5,000 |
1-Year |
Q3 FY 2022 Review
Dynamics Technologies Limited reported net revenue of ₹30,770 lakhs for the quarter ended December 31, 2021, compared to ₹34,035 lakhs for the quarter ended December 31, 2020. EBIT and Profit After Tax were ₹2,367 lakhs and ₹802 lakhs for the quarter ended, 31, 2021, as compared to ₹1,866 lakhs and ₹114 lakhs, during the corresponding quarter of the previous year.
Dynamics Technologies Limited - Investment Summary
|
CMP (₹) |
2,383 |
|
52 Week H/L |
949/3380 |
|
Market Cap (Lakhs) |
1,51,145. |
|
Face Value (₹) |
10.00 |
|
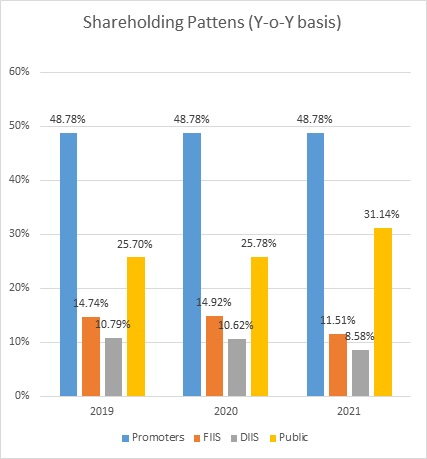
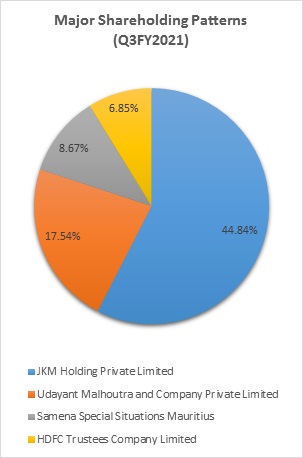
Promoter Holding (%) |
44.84 |
|
Non-Promoter Holding (%) |
55.16 |
|
Total (%) |
100.00 |
|
Book Value |
₹581.50 |
|
EPS TTM |
(₹34.59) |
Overview
-
Dynamatic Technologies Limited got an order from Boeing for manufacturing assemblies for their tactical fighter, the F-15 EX Eagle II.
-
The expansion of the Aerospace facility at Dynamatic Aerotropolis near Bangalore Airport is well underway and is expected to be completed in mid-FY-2023. Technological advancements at the new plant are expected to improve the company’s operational efficiency and meet customer expectations more effectively.
-
The company has been rated BBB+ for the banking facilities by Indian Ratings & Research (credit rating agency).
Beta: 0.99 |
Alpha: 15.11 |
Risk Reward Ratio: 4.56 |
Margin of Safety: 55% |
Dynamics Technologies Limited - Quarterly Summary
|
Quarterly (INR in lakhs) |
Dec-21 |
Sep-21 |
Jun-21 |
Mar-21 |
Dec-20 |
|
Revenue from Continued business (A) |
30,770 |
30,435 |
32,041 |
35,333 |
31,001 |
|
Revenue from Discontinued business (B) |
- |
168 |
1,843 |
3,529 |
3,057 |
|
Total |
30,770 |
30,603 |
33,884 |
38,862 |
34,058 |
|
|
|||||
|
Other Income |
34 |
155 |
137 |
250 |
301 |
|
Total Revenue (A+B) |
30,804 |
30,758 |
34,021 |
39,112 |
34,359 |
|
Total Expenditure (continuing business) |
28,437 |
28,587 |
29,852 |
32,634 |
29,102 |
|
Total Expenses (discontinued business) |
- |
1,498 |
2,172 |
4,720 |
3,391 |
|
EBIT |
2,367 |
673 |
1,997 |
1,758 |
1,866 |
|
Interest |
1,324 |
1,392 |
1,494 |
1,663 |
1,647 |
|
EBT |
1,043 |
-719 |
503 |
95 |
219 |
|
Tax |
241 |
290 |
251 |
871 |
105 |
|
Net Profit (continued + discontinued business) |
802 |
1,009 |
252 |
-776 |
114 |
-
The board of directors of JKM Ferrotech Limited, a wholly subsidiary of Dynamatic technologies, vide its meeting on February 01, 2021, had approved the term sheet and plan for its foundry business to Danblock Brakes India Private Limited. All the conditions have been met, and Dynamatic Technologies received a net consideration of ₹7041 lakhs on July 22, 2021.
Business
-
Incorporated in 1973, Dynamatic Technologies Limited (DTL) is into the manufacturing of Hydraulic Gear Pumps and Automotive Turbochargers.
-
It also serves clients across Aerospace, automotive and Hydraulic Industries
-
DTL has manufacturing facilities in Europe and India, serving customers across six continents
-
DTL has diversified business segments, and they are as follows:
-
Hydraulics
-
The company is one of the world's largest manufacturers of hydraulic gear pumps and geared motors.
-
The company can build customized solutions for any application, from farm mechanization to agricultural tractors and harvesters, off-highway vehicles, construction equipment, metal cutting metal forms, material handling, and mining equipment.
-
The company has over 75% market share of pumps on agriculture tractors produced in India and 34% shares in agriculture tractors produced globally.
-
-
Aerospace and Defense:
-
The company is a leading player in the Indian private sectors and the UK to manufacture Flight Critical Airframe Structures and High Precision Class 1 parts.
-
The company has an extensive infrastructure to cater to the needs of OEMs like Airbus, Boeing, Bell, and Hindustan Aeronautics Limited as Tier-1 suppliers.
-
-
Automotive and Metallurgy:
-
The company is a leading player in the Indian private sectors and the UK to manufacture Flight Critical Airframe Structures and High Precision Class 1 parts.
-
-
-
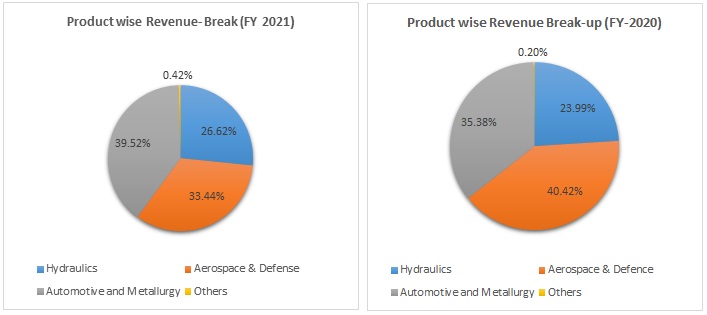
Out of the total revenue, 39.52% of revenue have generated from Automotive and Metallurgy, 26.62% from Hydraulics, 33.44% from Aerospace & Defence, and 0.42% from others % in FY 2021, compared to 35.38%, 23.99%, 40.42% and 0.20% in FY 2020.
-
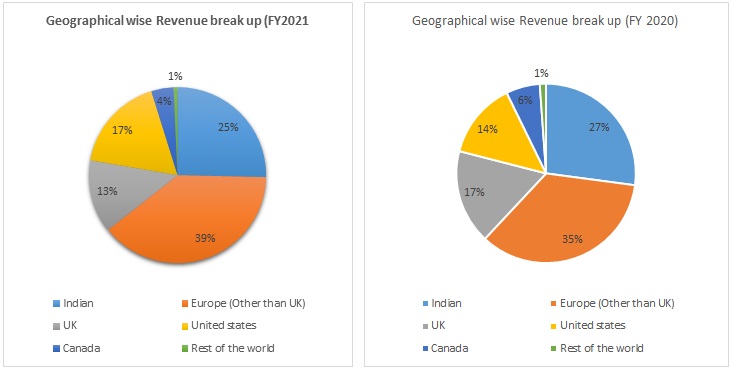
Out of the total revenue, 39% of revenue have generated from Europe, 25% from India, 17% from the United States, 13% from the UK and 4% from Canada, and 1% from the Rest of the countries in FY 2021, compared to 35%, 27%, 14%, 17%, 6% and 1% in FY 2020.
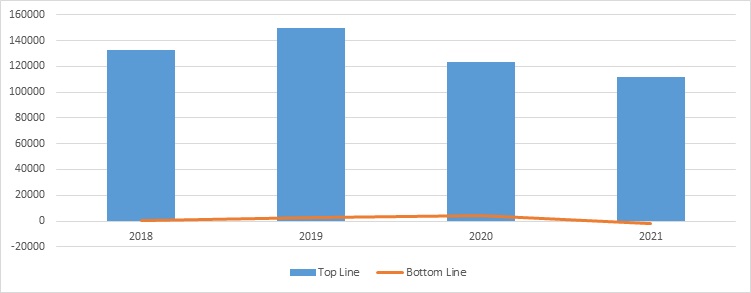
Revenue Trend
Topline and Bottomline trend (lakhs)
Ratio Analysis
|
|
Mar-18 |
Mar-19 |
Mar-20 |
Mar-21 |
|
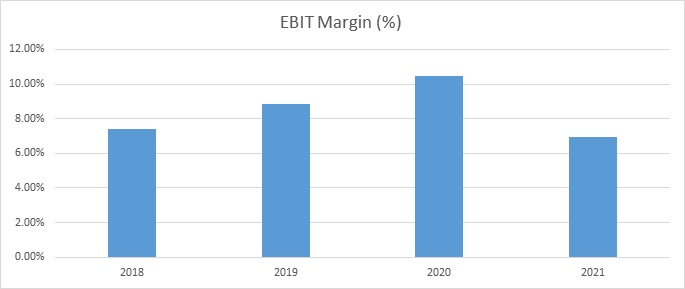
Profitability Ratio |
49.79% |
49.33% |
53.02% |
51.35% |
|
EBITDA Margin |
10.96% |
12.16% |
16.96% |
13.87% |
|
EBIT Margin |
7.40% |
8.87% |
10.46% |
6.93% |
|
Pre-Tax Margin |
1.79% |
3.57% |
3.92% |
0.68% |
|
Net Profit Margin |
0.05% |
1.82% |
3.18% |
-1.96% |
|
|
|
|
|
|
|
Return on Investment |
|
|
|
|
|
Return on Asset – ROA |
0.05% |
1.95% |
2.72% |
-1.50% |
|
Return on Capital Employed – ROCE |
12.33% |
17.01% |
15.77% |
8.90% |
|
Return on Equity – ROE |
0.24% |
8.57% |
11.19% |
-5.90% |
|
|
|
|
|
|
|
Liquidity Ratio |
|
|
|
|
|
Current ratio (x) |
0.95 |
1.05 |
1.01 |
1.02 |
|
Quick Ratio |
0.50 |
0.59 |
0.59 |
0.60 |
|
|
|
|
|
|
|
Turnover Ratio |
|
|
|
|
|
Receivables Turnover |
46.28 |
50.54 |
69.04 |
70.86 |
|
Inventory Turnover |
134.07 |
167.19 |
162.46 |
175.30 |
|
Payables Turnover |
- |
63.87 |
160.86 |
151.37 |
|
Asset Turnover |
0.97 |
1.07 |
0.86 |
0.77 |
|
Solvency Ratio |
||||
|
Debt to Equity |
1.37 |
1.22 |
1.20 |
1.30 |
|
Interest Coverage Ratio |
1.32 |
1.67 |
1.60 |
1.11 |
Note: Net profit margin, ROA, ROE includes net profit from the discontinued business.
Dynamics Technologies Limited - Financial Overview
Profit and Loss Statement (₹ in Lakhs)
|
|
Mar-18 |
Mar-19 |
Mar-20 |
Mar-21 |
|
Revenue |
1,32,779 |
1,50,030 |
1,23,007 |
1,11,820 |
|
Other income |
578 |
724 |
1,782 |
607 |
|
Total Revenue |
1,33,357 |
1,50,754 |
1,24,789 |
1,12,427 |
|
Cost of Goods Sold |
67,241 |
76,751 |
59,574 |
55,011 |
|
Gross Profit |
66,116 |
74,003 |
65,215 |
57,416 |
|
Excise Duty |
670 |
|||
|
Employee benefit expense |
23,839 |
25,388 |
24,288 |
22,147 |
|
Other Expenses |
27,049 |
30,377 |
20,069 |
19,761 |
|
EBITDA |
14,558 |
18,238 |
20,858 |
15,508 |
|
Depreciation and amortisation expenses |
4,733 |
4,925 |
7,988 |
7,754 |
|
EBIT |
9,825 |
13,313 |
12,870 |
7,754 |
|
Finance costs |
7,442 |
7,950 |
8,045 |
6,999 |
|
EBT Before exceptional item |
2,383 |
5,363 |
4,825 |
755 |
|
Exceptional items |
||||
|
Profit before tax |
2,383 |
5,363 |
4,825 |
755 |
|
Income Tax Expense |
1,179 |
2,257 |
-2,531 |
557 |
|
Profit from continuing operations (A) |
1,204 |
3,106 |
7,356 |
198 |
|
Discontinued operations: |
||||
|
Loss of the year from discontinued operations |
-1,652 |
-460 |
-3,450 |
-2,385 |
|
Tax credit of discontinued operations |
-520 |
-91 |
||
|
Loss of the year from discontinued operations after tax (B) |
-1,132 |
-369 |
-3,450 |
-2,385 |
|
(Loss)/Profit of the year (C)= (A)+(B) |
72 |
2,737 |
3,906 |
-2,187 |
|
EPS |
||||
|
Basic |
1 |
43 |
62 |
-34 |
|
Diluted |
1 |
43 |
62 |
-34 |
|
|
|
|
|
|
|
Number of shares |
||||
|
Basic |
63 |
63 |
63 |
63 |
|
Diluted |
63 |
63 |
63 |
63 |
Cash Flow Statement (₹ in Lakhs)
|
|
Mar-18 |
Mar-19 |
Mar-20 |
Mar-21 |
|
Net Profit Before Tax |
731 |
4913 |
1375 |
-1630 |
|
Net Cash from Operating Activities |
8803 |
12378 |
22578 |
12621 |
|
Net Cash Used for Investing Activities |
-5986 |
295 |
-5176 |
-7079 |
|
Net Cash From (Used For) Financing Activities |
-4790 |
-12827 |
-15514 |
-7339 |
|
Net Increase in Cash and Cash Equivalents |
-1973 |
-154 |
1888 |
-1797 |
|
Cash And Cash Equivalents at The Beginning of The Year |
6191 |
3988 |
3710 |
5598 |
|
Cash And Cash Equivalents at The End of Year |
3988 |
3710 |
5598 |
3801 |
Balance Sheet (₹ in Lakhs)
|
|
Mar-18 |
Mar-19 |
Mar-20 |
Mar-21 |
|
ASSETS: |
|
|
|
|
|
Non-current assets: |
|
|
|
|
|
Property, Plant and equipment |
67,022 |
52,594 |
58,863 |
44,534 |
|
Other Intangible Assets |
2,735 |
2,541 |
2,339 |
2,322 |
|
Goodwill |
9,513 |
9,252 |
9,719 |
10,259 |
|
Capital work-in-progress |
817 |
556 |
301 |
325 |
|
Right-use-assets |
- |
- |
11,723 |
13,702 |
|
Financial Assets: |
||||
|
Investments |
60 |
34 |
34 |
33 |
|
Loans |
1,291 |
1,154 |
1,014 |
931 |
|
Other financial assets |
18 |
18 |
||
|
Income tax asset (net) |
23 |
632 |
996 |
1,571 |
|
Other non-current assets |
476 |
448 |
125 |
175 |
|
Total Non-current assets |
81,955 |
67,229 |
85,114 |
73,852 |
|
Current assets: |
||||
|
Inventories |
28,305 |
28,080 |
26,496 |
22,475 |
|
Financial assets: |
||||
|
Trade receivables |
18,610 |
22,938 |
23,594 |
19,822 |
|
Cash and cash equivalents |
3,988 |
3,710 |
5,598 |
3,801 |
|
Bank Balances other than cash and cash equivalents above |
2,277 |
3,077 |
2,699 |
2,258 |
|
Loans |
295 |
413 |
992 |
964 |
|
Other current financial assets |
- |
- |
- |
- |
|
Other current assets |
6,464 |
5,463 |
4,586 |
5,669 |
|
Total Current assets |
59,939 |
63,681 |
63,965 |
54,989 |
|
Assets are classified as held for sale. |
- |
7,574 |
- |
14,037 |
|
Total Assets |
1,41,894 |
1,38,484 |
1,49,079 |
1,42,878 |
|
EQUITY AND LIABILITIES: |
||||
|
Equity: |
||||
|
Equity share capital |
634 |
634 |
634 |
634 |
|
Other equity |
30,750 |
31,855 |
36,679 |
36,242 |
|
Total Equity |
31,384 |
32,489 |
37,313 |
36,876 |
|
Liabilities: |
||||
|
Non-current liabilities: |
||||
|
Financial Liabilities: |
||||
|
Borrowings |
42,867 |
39,580 |
35,776 |
36,343 |
|
Lease Liabilities |
- |
- |
8,921 |
11,776 |
|
Other financial Liabilities |
333 |
152 |
||
|
Provisions |
1,669 |
2,002 |
2,390 |
2,537 |
|
Deferred tax liabilities |
2,511 |
3,450 |
976 |
840 |
|
Other Non-current liabilities |
101 |
98 |
99 |
99 |
|
Total Non-current liabilities |
47,481 |
45,130 |
48,162 |
51,747 |
|
Current Liabilities: |
||||
|
Financial liabilities: |
||||
|
Borrowings |
22,092 |
21,604 |
21,995 |
15,054 |
|
Trade payables: |
26,314 |
- |
- |
- |
|
Total outstanding dues of micro and small enterprises |
- |
814 |
1,811 |
482 |
|
Total outstanding dues of creditors other than micro and small enterprises |
- |
26,859 |
25,650 |
19,978 |
|
Other financial liabilities |
10,618 |
8,251 |
7,616 |
10,980 |
|
Lease Liabilities |
- |
- |
4,612 |
4,869 |
|
Provisions |
1,076 |
1,156 |
973 |
1,019 |
|
Current tax liabilities (net) |
1,125 |
423 |
315 |
1,105 |
|
Other current liabilities |
1,804 |
1,677 |
632 |
614 |
|
Total current liabilities |
63,029 |
60,784 |
63,604 |
54,101 |
|
Liabilities directly associated with assets classified as held for sale |
81 |
154 |
||
|
Total Liabilities |
1,10,510 |
1,05,995 |
1,11,766 |
1,06,002 |
|
Total Equity and Liabilities |
1,41,894 |
1,38,484 |
1,49,079 |
1,42,878 |
Industry Overview
-
Hydraulic Segment:
-
The global hydraulics market size is expected to grow from USD 37.4 billion in 2020 to USD 42.1 billion by 2025 at a CAGR of 2.4 %.
-
The market’s growth is attributed to growing construction activities driving significant demand for hydraulic equipment, an increase in demand for material handling equipment and rising demand for advanced agriculture equipment, and increasing adaption of hydraulic equipment in various industries.
-
With the covid-19 easing, increasing demand for infrastructure, farmers adopting modern techniques for agriculture will increase the demand for Hydraulic in coming years.
-
Latest Budget announced is also going to focus on infrastructure development.
-
-
Aerospace and Defense:
-
India accounts for 3.7% of the total military spending, making it the third-highest army spender in the world.
-
The defence expenditure constituted 2.9% of India’s total GDP, with approximately $72.9 billion spent on defence in 2020.
-
With the growing demand in the defence sector, the government has identified it as one of the areas to boost ‘Atma Nirbhar Bhara.’. The export value of defence items, including significant items in FY 2014-15 and 2020-21, was ₹1,9040 crores and ₹8,434.84 crores, respectively.
-
The Government has also spelled out its vision of achieving a turn of $25 billion, including export of $5 billion in Aerospace and Defence goods and services by 2025.
-
Government has issued 568 Defence Industrial Licenses to 351 companies. Out of the 113 companies covering 170, Defence Industrial Licenses have conveyed commencement of production.
-
Dynamics Technologies Limited - Technical Analysis
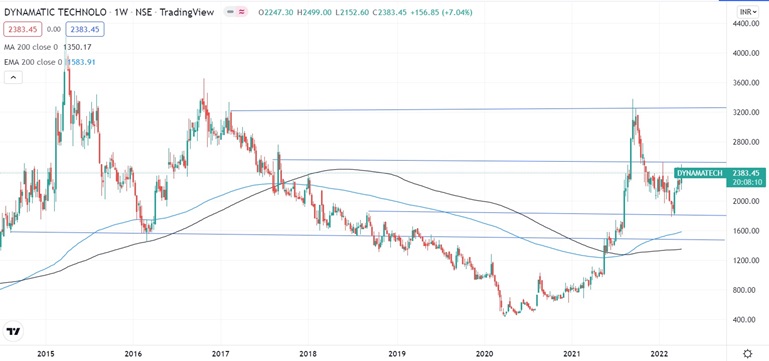
-
Stock is trading above EMA 200 and MA 200 indicators, with a strong support level of ₹1,828 and a resistance level at ₹3,260
-
One can accumulate this share at the current price.
Recommendation Rationale:
-
For the first nine months, Dynamatic Technologies Limited’s revenue increased by 17.97% to ₹93,572 lakhs, compared to the previous year at ₹76,844. Profit After Tax was ₹45 lakhs compared to -₹1411 lakhs last year.
-
DTL has a well-diversified business profile in three industries: aerospace & Defence, Hydraulics, and Automotive & Metallurgy. The company’s strong market position, its relationships with renowned customers across sectors, and solid technological capabilities across geographies support its business prospects.
-
DTL is a tier-1 supplier of global aerospace original equipment manufacturers such as Airbus, Bell, and Hindustan Aeronautics limited. The company has marquee clients in other segments as well.
-
DTL Hydraulic segment is expected to perform well due to increasing in volume of tractors and easing infrastructure segment.
-
The company’s credit metrics improved in the first nine months of FY 2022. The company has reduced term debt by using the proceeds from the sale of the assets of its loss-making Indian-based subsidiary, JKM Ferrotech Limited.
-
The company is in an advanced discussion stage to sell its wind farmland to the government. Whatever money comes from the proceedings, it will utilize to reduce its debts.
-
With recovery demand in the infrastructure sector, increasing demand for tractors, easing of covid-19, strong technology tie-ups, experience management, and debt reduction will help the company develop overall.
Valuation
-
The company’s financials deteriorated due to pandemics, disruptions increasing interest costs, and delays in monetizing non-core assets.
-
In the first nine months of FY 2022, the company’s financials are improving with revenue and EBIT, and debt and interest costs are reduced.
-
Deal of disposal of wind Farmland will help the company reduce its debt to a great extent and improve its operational cycle and efficiency from FY 2023.
-
Based on the current performance of the company in the first nine months, we expect the company could post higher revenue for the current financial (2022), corresponding to the previous year.
-
We have taken data for the last five years (2017-2021) and forecasted revenue for FY 2022-2026. Revenue growth is assumed to be 3%,
Estimated Income Statement (₹ in lakhs):
|
|
Mar-22 |
Mar-23 |
Mar-24 |
Mar-25 |
Mar-26 |
|
|
2022-E |
2023-E |
2024-E |
2025-E |
2026-E |
|
Revenue |
1,16,162.42 |
1,20,122.53 |
1,24,249.01 |
1,28,550.07 |
1,33,034.39 |
|
COGS |
58,964.22 |
60,981.09 |
63,082.78 |
65,273.48 |
67,557.61 |
|
Gross Profit |
57,198.20 |
59,141.44 |
61,166.23 |
63,276.59 |
65,476.78 |
|
Employee Expenses |
22,863.76 |
23,645.81 |
24,460.75 |
25,310.21 |
26,195.90 |
|
Other Expenses |
19,647.50 |
20,319.55 |
21,019.85 |
21,749.82 |
22,510.91 |
|
EBITDA |
14,686.94 |
15,176.08 |
15,685.62 |
16,216.56 |
16,769.96 |
|
Depreciation |
5,854.32 |
5,717.33 |
5,615.87 |
5,546.54 |
5,506.36 |
|
EBIT |
8,832.61 |
9,458.75 |
10,069.75 |
10,670.02 |
11,263.61 |
|
Financial Cost |
5,299.57 |
5,675.25 |
6,041.85 |
6,402.01 |
6,758.16 |
|
EBT |
3,533.05 |
3,783.50 |
4,027.90 |
4,268.01 |
4,505.44 |
|
Tax expenses |
883.26 |
945.88 |
1,006.97 |
1,067.00 |
1,126.36 |
|
PAT |
2,649.78 |
2,837.63 |
3,020.92 |
3,201.01 |
3,379.08 |
-
We initiate coverage on Dynamatic Technologies Limited with a “BUY” and a 1 Year Target Price of 5,000.
Disclaimer: This report is only for the information of our customers Recommendations, opinions, or suggestions are given with the understanding that readers acting on this information assume all risks involved. The information provided herein is not to be construed as an offer to buy or sell securities of any kind.
- Share :


Post a Comment
|
DISCLAIMER |
This report is only for the information of our customers. Recommendations, opinions, or suggestions are given with the understanding that readers acting on this information assume all risks involved. The information provided herein is not to be construed as an offer to buy or sell securities of any kind. ATS and/or its group companies do not as assume any responsibility or liability resulting from the use of such information.