eClerx Services Ltd.
eClerx Services Ltd., incorporated in the year 2000, is a Mid Cap company operating in the Information Technology sector. It is a specialist knowledge and business process outsourcing company providing operational support, data management, and analytics solutions.
|
BSE |
532927 |
|
NSE |
ECLERX |
|
REUTERS |
ECLE.BO |
|
INCEPTION |
2000 |
|
IPO |
2007 |
|
INDUSTRY |
IT SOFTWARE/BPO |
|
CMP (as on 5/2/2016) |
1345 |
|
Stock Beta |
0.6475 |
|
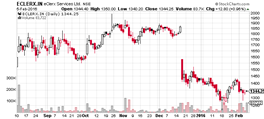
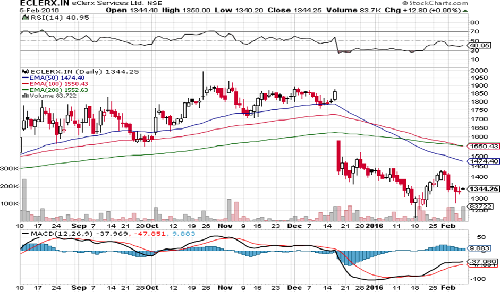
52 Week H/L |
881.20 / 1580.00 |
|
Market Cap (Cr) |
5411 |
|
Equity Capital (cr) |
30.35 |
|
Face Value (Rs) |
10 |
|
Average Volume |
83722 |
|
Shareholding Pattern (%) |
|
|
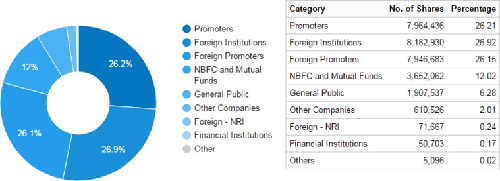
Promoters |
50.46 |
|
Non Institutions |
49.54 |
|
Grand Total |
100.00 |
eClerx Services Ltd - Potential Catalysts
-
New acquisitions would drive the top-line growth
-
Establishing its global delivery capabilities with operations in three European and two Asian countries including India
-
Emerging clients taking the top position, supporting the top-line growth
-
The short term projects to contribute more than half of revenue growth
eClerx Services Ltd - Recommendation
We expect the company to maintain its strong top-line growth in FY16E, which is driven by inorganic growth (CLX acquisition). We maintain a positive outlook for the company, despite the flattish growth expected in revenue and margins in Q4FY16E. We recommend a “BUY” rating at a CMP of 1345 with a target price of Rs.1594 per share.
eClerx Services Ltd - Financial Summary
|
Income Statement |
||||
|
|
2013 |
2014 |
2015 |
2016 E |
|
Total Income |
642.36 |
852.01 |
974.58 |
1155.20 |
|
Total Expenditure |
405.88 |
487.42 |
626.62 |
727.38 |
|
EBITDA |
236.47 |
364.6 |
347.96 |
427.83 |
|
PBT |
210.93 |
331.57 |
297.93 |
367.14 |
|
Adjusted PAT |
173.32 |
255.66 |
229.68 |
275.91 |
|
EPS |
58.33 |
85.14 |
75.82 |
90.59 |
|
EBIDTA (%) |
35.8 |
43.35 |
36.93 |
39.82 |
|
PAT (%) |
25.98 |
30.4 |
24.38 |
25.32 |
eClerx Services Ltd - BUSINESS DESCRIPTION
eClerx Services Limited is an India-based Knowledge and Business Process Outsourcing (KPO/BPO) company. The Company provides operational support, data management, and analytics solutions to companies, including high-tech, industrial manufacturing, financial services, e-commerce, retail and distribution, broadband, cable and telecom, interactive media and entertainment, travel and leisure, and software vendors. The Company provides financial solutions, such as trade processing support, contract risk review, reconciliation and controls, margin and exposure management, metrics and reporting, and expense management, among others. Digital branding includes content creation, multi-channel media content management, and digital asset management, among others. Digital marketing comprises online operations and Web analytics, data management and reporting, and quality and compliance, among others. It has operations in the United States, the United Kingdom, Europe, and the Asia Pacific.
MANAGEMENT & GOVERNANCE
Shareholding Pattern as on Dec 31st, 2015
eClerx Services Ltd. key Products/Revenue Segments include I T Enabled Services which contributed Rs 818.34 Cr to Sales Value (100.00% of Total Sales), for the year ending 31-Mar-2015.
The company’s management includes Mr.Alok Goyal, Mr.Anish Ghoshal, Mr.Anjan Malik, Mr.Biren Gabhawala, Mr.Gaurav Tongia, Mr.P D Mundhra, Mr.Pradeep Kapoor, Mr.Rohitash Gupta, Mr.V K Mundhra, Mr.Vikram Limaye, Ms.Deepa Kapoor, Mr.Gaurav Tongia.
|
KEY PEOPLE |
|
|
|
|
|
Rohitash Gupta |
Chief Financial Officer |
|
Anjan Malik |
Non-Executive Director |
|
Pradeep Kapoor |
Non-Executive Independent Director |
|
Anish Ghoshal |
Non-Executive Independent Director |
|
Alok Goyal |
Non-Executive Independent Director |
The company has S R Batliboi & Associates as its auditors.
Fund Holding
|
Mutual Fund Name |
Shares Held (% Change) |
% Outstanding |
|
Matthews India Fund |
23,66,218 (2.92) |
10.38 |
|
Fidelity® Low-Priced Stock Fund |
13,50,000 (0.00) |
5.89 |
|
Reliance Equity Opportunities |
10,16,453 (0.00) |
3.34 |
|
HDFC Mid-Cap Opportunities |
8,01,836 (0.00) |
2.63 |
|
ICICI Pru Value Discovery Fund |
7,42,659 (-0.22) |
2.44 |
|
Institution Name |
Shares Held (% Change) |
% Outstanding |
|
Matthews International Cap Mgmt LLc |
24,83,172 (+2.78%) |
10.9 |
|
Fidelity Management & Research Company |
14,50,000 (0.00%) |
6.33 |
|
Franklin Templeton Asst Mgmt(IND)Pvt Ltd |
13,20,859 (0.00%) |
4.34 |
|
HDFC Asset Management Company Limited |
12,01,870 (0.00%) |
3.95 |
|
Reliance Capital Asset Mgmt Limited |
11,72,641 (0.00%) |
3.85 |
|
ICICI Prudential Asset Management Company Limited |
8,09,325 (-10.07%) |
2.66 |
|
SBI Funds Management Private Limited |
5,76,902 (0.00%) |
1.89 |
INDUSTRY OUTLOOK
India is home to over 3500 BPM (Business Process Management) companies and has a share of 55% in the global sourcing market. IT-BPM industry has the highest relative share in India’s GDP and is the largest private-sector employer having around 3.5 Mn employees. BPM industry grew at the rate of 12% in FY15 to US$ 26 Bn and will likely maintain the pace of expansion this year. According to the Nasscom BPM council, the BPM industry is on course to achieve US$ 50 Bn by 2020. Digital also became mainstream during the year, with the industry increasingly investing in digitized solutions to drive future growth opportunities.
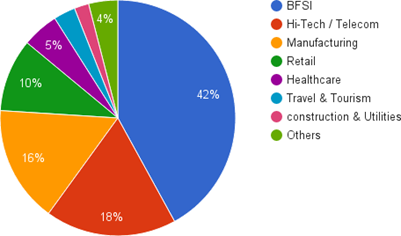
BFSI (Banking, Financial Services, and Insurance) sector is holding the highest percentage in terms of sector-wise contribution to the IT-BPM industry. In BFSI services, the company has the huge potential to grow its client base.
|
Demand (%) |
|
|
USA |
62% |
|
UK |
17% |
|
Hi-Tech / Telecom |
18% |
|
APAC |
8% |
|
Others |
2% |
For the IT-BPM industry, major demand for the BPM services is from the USA with 62% contribution; and the UK is standing at the second position seeking the BPM services.
INVESTMENT RATIONALE
New acquisitions would drive the top-line growth
With the acquisition of CLX (an Italian company specializing in creative and digital marketing services for the retail and luxury goods sector in Europe), eClerx Services Ltd is getting the new luxury brand clients added to its client portfolio and the opportunity to sell native services to CLX clients. With this acquisition, eClerx Services Ltd has a huge opportunity in strengthening its presence in the digital marketing segment. Cable and telecom business is well organized and contributing a high percentage of revenue, Digital marketing business has the scope of strengthening business with the CLX acquisition.
eClerx Services Ltd is in the maturity stage posting the constant growth of 10%-15% and we expect the topline growth would be driven by the inorganic way, CLX acquisition would drive FY16E topline growth to 39.3% compared to FY15. H1FY16 has shown strong revenue growth of 39.5% against H1FY15 on the back of a significant increase in short-term projects. Considering the management statement, “short term projects roll-off in due course” is likely to create flattish growth in the near term.
Establishing its global delivery capabilities with operations in three European and two Asian countries including India
In FY15, US$ contributed nearly 83.0%; Euro, GBP contributed 12.0% and 5.0% of total revenue respectively; and in terms of geographic concentration, US contributes 72.8% and Europe contributes 17.0% of total operational revenue. With the CLX acquisition, Europe's geographic concentration has increased to 25.0% and 29.0% in Q1FY16 and Q2FY16 respectively. The company has posted a significant US$ revenue growth of 14.2% and 8.1% in Q1FY16 and Q2FY16 respectively and we expect the significant growth in the US$ revenue would drive the top line. Operational facilities have also increased in India, added new facilities in Aroli, Pune, and Chandigarh which could accommodate 1400 seats and the total seat count increased to 8600.
Emerging clients taking the top position, supporting the top-line growth
Revenue contribution from the emerging clients (non-top clients) showed strong growth in FY15 and also continued the same momentum in Q1FY16 & Q2FY16 reflecting growth rates of 84% and 81% respectively. The top 5 clients’ contribution has been continuously reducing from the level of 87% in FY11 to 56% in Q2FY16, reflecting reducing client concentration risk. 2 new clients have added in US$ 500k bucket in Q1FY16; 3 new clients and 2 new clients added to US$ 1mn bucket in Q1FY16 and Q2FY16 respectively.
The short term projects to contribute more than half of revenue growth largely from the company’s top clients pertaining to Banking and Digital businesses.
Management said that the company usually has 10-15% of revenues from short-term projects (project duration <1 year). Management indicated that there are short term project opportunities in the market that will contribute to the company’s revenue growth in medium-term (1-2 years); however, visibility/predictability of these projects is low.
VALUATION
eClerx Services Ltd is currently trading at 1345 per share with a market capitalization of 5411 Crores. It has no debt in its balance sheet making it a 100% equity-financed company. It has total cash and bank balance of 286.58 Cr.
|
Co_Name |
YearEnd |
Sales |
EBITDA |
Payout(%) |
Long term/ERatio |
EBITDA% |
latest/ERatio |
latest/BV |
|
Vakrangee |
201503 |
2780.48 |
729.13 |
3.94 |
0.06 |
26.22 |
29.23 |
8.39 |
|
Nucleus Soft. |
201503 |
353.14 |
99.16 |
26.36 |
0 |
25.36 |
18.32 |
1.63 |
|
Sonata Software |
201503 |
1682.13 |
190.73 |
61.98 |
0 |
11.34 |
11.75 |
3.96 |
|
Accelya Kale |
201506 |
302.82 |
120.55 |
92.38 |
0 |
39.81 |
20.4 |
11.71 |
|
KPIT Tech. |
201503 |
3002.38 |
359.58 |
9.34 |
0.08 |
11.98 |
11.46 |
2.15 |
|
R Systems Intl. |
201412 |
648.5 |
124.56 |
117 |
0 |
15.38 |
18.59 |
4.33 |
|
Take Solutions |
201503 |
730.43 |
157.67 |
15.5 |
0.06 |
21.59 |
15.93 |
3.28 |
|
Average |
|
|
|
46.64 |
0.03 |
21.67 |
17.95 |
5.06 |
|
|
||||||||
|
eClerx Services |
201503 |
942.12 |
348.62 |
51.21 |
0 |
37 |
17.75 |
7.64 |
We expect strong topline growth in FY16E, which is driven by inorganic growth (CLX acquisition). H1FY16 has shown significant growth in revenue by 39.5% compared to H1FY15. EBITDA margins also showed recovery in H1FY16 and we expect the margins would recover to 35.0% and 33.7% in FY16E and FY17E respectively. Significant growth in the topline and recovering EBITDA margins would drive the PAT margins and EPS in FY16E and FY17E.
eClerx Services Ltd is fairly valued with its peers at 17.75x PE against an average of 17.95x PE. It is trading at 7.64x BV against an average of 5.06x BV which can be justified considering it is 100% equity financed. We can also observe payout of eClerx is 51.21 against an average of 46.64 which signifies the company is giving out more dividends than its peers.
We value eClerx Services Ltd using DCF at a price target of 1594 for FY16 with an expected growth rate of 18.53% per annum. For valuation, we assume that over the period company will keep the capital structure unaltered and the tax rate unchanged.
CONCUSSION AND RECOMMENDATION
We expect the company to maintain its strong top-line growth in FY16E, which is driven by inorganic growth (CLX acquisition). We maintain a positive outlook for the company, despite the flattish growth expected in revenue and margins in Q4FY16E. We recommend a “BUY” rating at a CMP of 1345 with a target price of Rs.1594 per share.
RISKS AND CONCERNS
-
Currency risk: eClerx Services Ltd derives around 83% of revenue in US$; 12% and 5% in Euro, GBP respectively. Significant changes in the currency exchange rates could affect financial performance.
-
Top 5 clients contribute nearly 67% of the revenue. With the heavy competition, the loss of clients could significantly affect the revenue.
FINANCIALS
For the quarter ended 31-Dec-2015, the company has reported Standalone sales of Rs. 290.24 Cr., up 7.69% from last quarter Sales of Rs. 269.52 Cr. and up 36.96% from last year same quarter Sales of Rs. 211.92 Cr. Company has reported net profit after tax of Rs. 80.43 Cr. in latest quarter. As on 31-Dec-2015, the company has a total of 40,722,438 shares outstanding.
|
Income Statement |
||||
|
|
2012 |
2013 |
2014 |
2015 |
|
Gross Sales |
472.89 |
660.53 |
840.99 |
942.12 |
|
Excise Duty |
0 |
0 |
0 |
0 |
|
Net Sales |
472.89 |
660.53 |
840.99 |
942.12 |
|
Other Income |
22.3 |
-18.18 |
11.02 |
32.46 |
|
Other Operating Income |
0 |
0 |
0 |
0 |
|
Total Income |
495.18 |
642.36 |
852.01 |
974.58 |
|
Total Expenditure |
283.15 |
405.88 |
487.42 |
626.62 |
|
PBIDT |
212.04 |
236.47 |
364.6 |
347.96 |
|
Interest |
0 |
0 |
0 |
0 |
|
PBDT |
212.04 |
236.47 |
364.6 |
347.96 |
|
Depreciation |
12.89 |
25.54 |
33.03 |
50.02 |
|
Minority Interest Before NP |
0 |
0 |
0 |
0 |
|
PBT |
199.15 |
210.93 |
331.57 |
297.93 |
|
Tax |
39.38 |
39.34 |
75.91 |
68.26 |
|
Fringe Benefit Tax |
0 |
0 |
0 |
0 |
|
Deferred Tax |
0 |
0 |
0 |
0 |
|
Reported Profit After Tax |
159.77 |
171.6 |
255.66 |
229.68 |
|
Minority Interest After NP |
0 |
0 |
0 |
0 |
|
Profit/Loss of Associate Company |
0 |
0 |
0 |
0 |
|
Net Profit after Minority Interest & P/L Asso.Co. |
159.77 |
171.6 |
255.66 |
229.68 |
|
Extra-ordinary Items |
0 |
-1.72 |
0 |
0 |
|
Adjusted Profit After Extra-ordinary item |
159.77 |
173.32 |
255.66 |
229.68 |
|
|
||||
|
Equity |
29.06 |
29.87 |
30.18 |
30.35 |
|
Face Value |
10 |
10 |
10 |
10 |
|
EPS (Unit Curr.) |
55.14 |
58.33 |
85.14 |
75.82 |
|
EPS (Adj) (Unit Curr.) |
41.35 |
43.75 |
63.86 |
56.86 |
FINANCE - BALANCE SHEET
|
SOURCES OF FUNDS |
201203 |
201303 |
201403 |
201503 |
|
Share Capital |
29.06 |
29.88 |
30.18 |
30.35 |
|
Reserves Total |
313.86 |
408.45 |
558.78 |
684.52 |
|
Equity Share Warrants |
0 |
0 |
0 |
0 |
|
Equity Application Money |
0.28 |
0 |
0 |
0.14 |
|
Total Shareholders’ Funds |
343.2 |
438.33 |
588.96 |
715.01 |
|
Minority Interest |
0 |
0 |
0 |
0 |
|
Secured Loans |
0 |
0 |
0 |
0 |
|
Unsecured Loans |
0 |
0 |
0 |
0 |
|
Total Debt |
0 |
0 |
0 |
0 |
|
Policy Holders Fund |
0 |
0 |
0 |
0 |
|
Other Liabilities |
4.5 |
0 |
16.61 |
21.46 |
|
Total Liabilities |
347.7 |
438.33 |
605.57 |
736.47 |
APPLICATION OF FUNDS :
|
Gross Block |
88.06 |
206.39 |
259.99 |
322.35 |
|
Less: Accumulated Depreciation |
43.69 |
71.6 |
105.23 |
155.31 |
|
Less: Impairment of Assets |
0 |
0 |
0 |
0 |
|
Net Block |
44.37 |
134.79 |
154.76 |
167.04 |
|
Lease Adjustment |
0 |
0 |
0 |
0 |
|
Capital Work in Progress |
4.5 |
0.73 |
1.08 |
1.15 |
|
Investments |
99.91 |
35.19 |
115.48 |
155.29 |
Current Assets, Loans & Advances
|
Inventories |
0 |
0 |
0 |
0 |
|
Sundry Debtors |
42.18 |
65.48 |
98.73 |
126.14 |
|
Cash and Bank |
168.66 |
234.85 |
240.56 |
286.58 |
|
Loans and Advances |
92.83 |
116.65 |
113.35 |
150.99 |
|
Total Current Assets |
303.67 |
416.98 |
452.63 |
563.71 |
Less: Current Liabilities and Provisions
|
Current Liabilities |
21.15 |
29.31 |
24.68 |
37.12 |
|
Provisions |
92.57 |
133.51 |
159.26 |
183.78 |
|
Total Current Liabilities |
113.72 |
162.82 |
183.94 |
220.9 |
|
Net Current Assets |
189.95 |
254.16 |
268.7 |
342.81 |
|
Miscellaneous Expenses not written off |
0 |
0 |
0 |
0 |
|
Deferred Tax Assets |
0.93 |
2.27 |
3.71 |
6.97 |
|
Deferred Tax Liabilities |
0.17 |
0.99 |
1.88 |
1.81 |
|
Net Deferred Tax |
0.76 |
1.28 |
1.83 |
5.16 |
|
Other Assets |
8.21 |
12.18 |
63.71 |
65.02 |
- Share :


Post a Comment
|
DISCLAIMER |
This report is only for the information of our customers. Recommendations, opinions, or suggestions are given with the understanding that readers acting on this information assume all risks involved. The information provided herein is not to be construed as an offer to buy or sell securities of any kind. ATS and/or its group companies do not as assume any responsibility or liability resulting from the use of such information.