PRAJ INDUSTRIES LIMITED RESEARCH REPORT
Market Price: ₹360 Recommendation: BUY Target: ₹490 Time Horizon: 1 Year
Q3FY2023 REVIEW
PSP Projects Limited reported net revenue of ₹909.97 crores for the quarter ended December 31, 2022, compared to ₹585.64 crores for December 30, 2021. Profit After Tax was ₹62.31 crores for the quarter ended December 31, 2022, compared to ₹37.05 crores during the corresponding quarter of the previous year, respectively.
OVERVIEW
- Praj and Axens, France have signed an MoU to collaborate on initiatives involving sustainable aviation fuel in India. Praj's integrated bioprocess technologies for alcohol production and Axens JetanolTM Alcohol-to-Jet (ATJ) technology will be used to create SAF.
- First and second-generation ethanol projects for Egypt have been established in collaboration with Praj and ESIIC, the largest sugar firm in Egypt. In order to mainstream the bioeconomy, Praj and ESIIC will establish infrastructure, assist in creating a policy framework, raise awareness, etc. The first project for second-generation ethanol in Egypt is expected to use rice straw and sugarcane bagasse as feedstock.
BENCHMARK COMPARISON
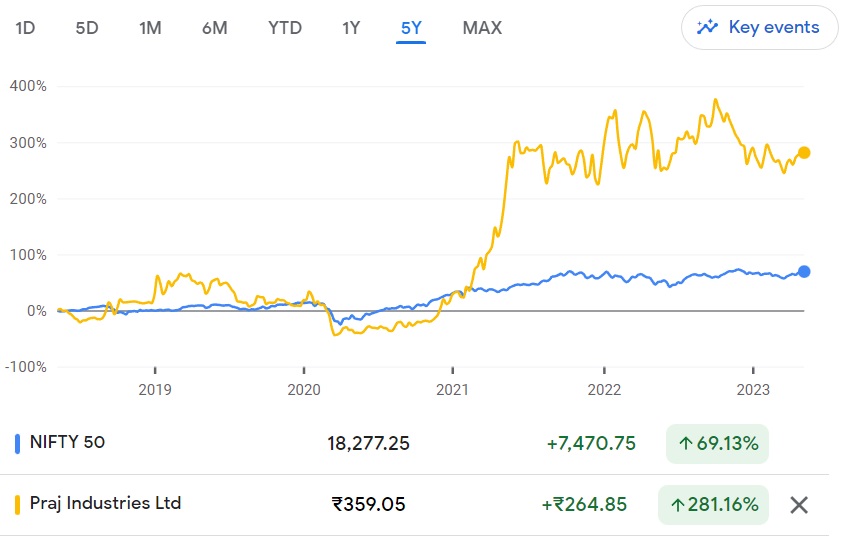
Beta: 0.96 |
Alpha: 51.49 |
Risk Reward Ratio: 1.56 |
Margin of Safety: 20% |
STOCK DATA
|
52 Week H/L |
289.05/461.60 |
|
Market Cap (crores) |
6,622 |
|
Face Value (₹) |
2.00 |
|
Book Value |
49.88 |
|
EPS TTM |
8.18 |
|
NSE Code |
PRAJ |
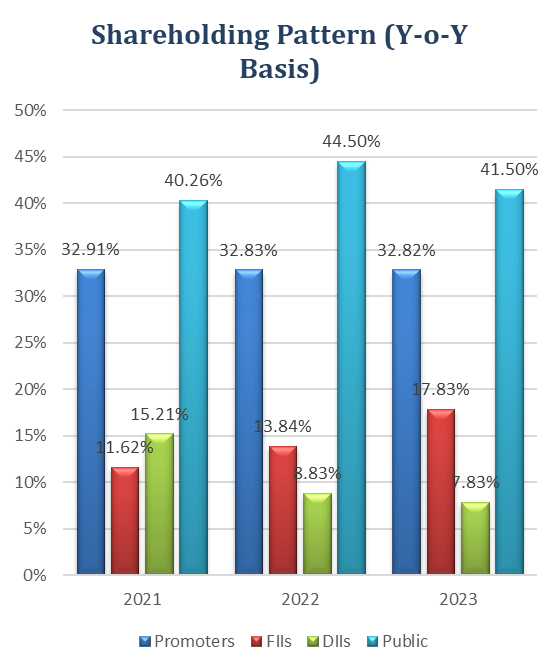
SHAREHOLDING PATTERN (%)
|
|
Sep-22 |
Dec-22 |
Mar-23 |
|
Promoter |
32.82 |
32.87 |
32.82 |
|
Public |
39.85 |
41.84 |
41.50 |
|
FIIs |
16.98 |
17.61 |
17.83 |
|
DIIs |
10.33 |
7.69 |
|
BUSINESS
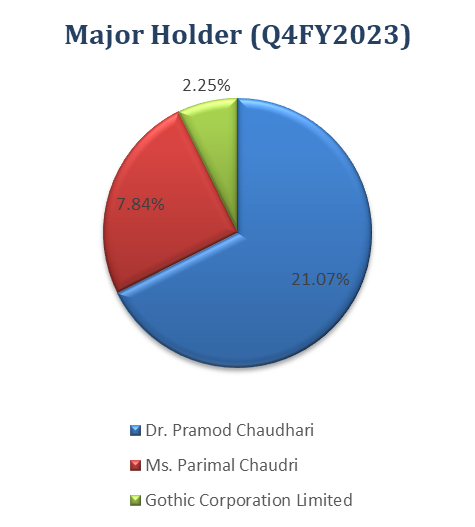
- Under the inspirational guidance of technocrat Dr. Pramod Chaudhuri, Praj Industries was founded in 1983.
- One of the most reputable and technologically cutting-edge engineering and biotechnology firms in the world is Praj Industries Ltd, providing a wide range of environmentally friendly solutions for bioenergy, ultra-pure water, vital process machinery, breweries, and industrial wastewater treatment.
- The manufacturing plant was put into operation at Kandla, Gujarat's special economic zone, in 2007. At the Praj Matrix R&D Centre, Praj launched a pilot plant in 2008 to conduct research and development (R&D) on second-generation cellulosic ethanol technology.
- Praj purchased a 50.2% share in Praj HiPurity Systems Ltd. in 2012, then in 2015 it increased that holding to 100%. This firm primarily serves the pharmaceutical, biotechnology, cosmetics, food and beverage, and water treatment sectors by producing and erecting modular process systems and water treatment facilities.
- Praj Industries, with more than a thousand client references in more than 100 countries on five continents, focuses on energy, environmental, and farm-to-fuel technology solutions. Praj Industries has 300+ patent submissions, 24 Indian and 60 foreign patent grants, and a team of 90+ technologists.
- Four top-notch production facilities in Gujarat and Maharashtra, which are close to ports and backed by a multidisciplinary technical staff, serve as evidence of the company's manufacturing skills. Global offices are in Houston, Texas, the Philippines and Thailand in South East Asia.
- In the area of Low Carbon Fuels and Renewable Chemicals, Praj Industries came in second on a list of the world's 50 Hottest Companies in the Global Bio-Economy for 2021.
- There are three business segments: (a) bioenergy business (which involves process design, engineering, fabrication, and commissioning of ethanol plants), (b) HiPurity Systems, which accounted for 9% of consolidated revenue in fiscal 2022; and (c) engineering business, which accounts for 20% of consolidated revenue and has three sub-divisions: water & waste water treatment (which operates in industrial waste water systems), critical process engineering (which provides high-reliability systems), and high purity systems.
SWOT ANALYSIS
 SWOT ANALYSIS
STRENGTH
- Net-debt free company.
- Company with strong financials.
- Diversified revenue segments.
- Established market position.
WEAKNESS
- Cyclicality and Seasonality of the Industry.
- Rise in price of raw-material.
OPPORTUNITIES
- Slowly and steadily increase in demand for ethanol as substantial fuel.
- Strong order book.
THREAT
- Exposure to project relatedrisk.
- Forex risk.
ETHANOL INDUSTRY ANALYSIS
- Ethanol Outlook:
- In order to meet the anticipated increase in demand in 2025 when it expects to introduce 20% ethanol-blended petrol across the nation, India is actively encouraging the construction of both traditional and second-generation (2G) ethanol plants.
- The Indian government began selling 20% ethanol-blended petrol in February, two months before the scheduled launch date of 1 April. They plan to make it available nationwide by the financial year 2025–26.
- By the end of the year 2023, the government projects a 25% increase in the nation's overall ethanol production capacity.
- Sugarcane is used to produce nearly 70% of the current capacity, while grains like rice and maize contribute the remaining 30%.
- India now has the potential to manufacture 9.5 billion liters of ethanol annually, of which 6.2 billion liters are made from sugarcane and 3.3 billion liters from grain, according to official government figures.
- The government is also aggressively supporting the construction of 2G ethanol facilities to significantly enhance output.
- What is First generation and Second-generation ethanol:
- A sustainable fuel derived from diverse plant resources referred to as biomass, ethanol is an organic chemical molecule. First-generation (1G) ethanol is made from raw materials such as cereals, sugarcane juice, and molasses, but second-generation (2G) ethanol factories use extra biomass and agricultural waste.
- 2G ethanol plants produce ethanol from surplus biomass and agricultural waste, which is then blended with gasoline. This helps India reduce its crude oil imports, reduce CO2 emissions, dispose of agricultural waste, and increase farmer income, among other things.
- Blending ethanol, especially 2G ethanol, has advantages beyond lowering emissions. It will give farmers a lucrative alternative to burning the stubble, which has been escalating pollution levels every year, in order to dispose of it. It provides an end-use for the Agri-crop waste and can become a source of additional income for farmers. The ethanol manufacturing units will also create jobs across the value chain.
FINANCIAL OVERVIEW
QUARTERLY SUMMARY
|
Quarterly (INR in crores) |
Dec-22 |
Sep-22 |
Jun-22 |
Mar-22 |
Dec-21 |
|
Revenue from Operations |
909.97 |
876.58 |
729.87 |
739.28 |
585.64 |
|
Other income |
7.76 |
6.16 |
5.48 |
6.83 |
4.99 |
|
Total Income |
917.73 |
882.74 |
735.35 |
746.11 |
590.63 |
|
|
|
|
|
|
|
|
Total Expenditure |
831.00 |
816.14 |
680.38 |
675.34 |
539.84 |
|
EBIT |
86.73 |
66.60 |
54.97 |
70.77 |
50.79 |
|
|
|
|
|
|
|
|
Finance cost |
0.83 |
0.82 |
0.74 |
0.70 |
0.54 |
|
PBT Before Exceptional Items |
85.90 |
65.78 |
54.23 |
70.07 |
50.25 |
|
|
|
|
|
|
|
|
Exceptional Items |
- |
- |
- |
- |
- |
|
PBT |
85.90 |
65.78 |
54.23 |
70.07 |
50.25 |
|
|
|
|
|
|
|
|
Tax Expenses |
23.59 |
17.65 |
12.97 |
18.00 |
13.20 |
|
PAT |
62.31 |
48.13 |
41.26 |
52.07 |
37.05 |
PROFIT AND LOSS STATEMENT (₹ in millions)
|
|
Mar-20 |
Mar-21 |
Mar-22 |
|
Revenue from Operations |
11,023.66 |
13,046.69 |
23,333.17 |
|
Other Income |
300.21 |
257.36 |
361.90 |
|
Total Income |
11,323.87 |
13,304.05 |
23,695.07 |
|
|
|
|
|
|
Cost of Goods sold |
5,523.70 |
7,361.16 |
14,537.45 |
|
Gross Profit |
5,800.18 |
5,942.89 |
9,157.62 |
|
|
|
|
|
|
Excise Duty |
- |
- |
- |
|
Employee Benefits Expense |
1,639.77 |
1,721.98 |
2,176.23 |
|
Other Expenses |
3,079.64 |
2,840.08 |
4,681.65 |
|
EBITDA |
1,080.77 |
1,380.84 |
2,299.74 |
|
|
|
|
|
|
Depreciation and Amortisation Expense |
218.46 |
221.22 |
225.91 |
|
EBIT |
862.31 |
1,159.62 |
2,073.82 |
|
|
|
|
|
|
Finance Costs |
30.96 |
28.58 |
25.05 |
|
EBT before Share of Profit/(Loss) of Joint Venture and Associates |
831.35 |
1,131.05 |
2,048.77 |
|
|
|
|
|
|
Share of Profit/(Loss) of Joint Venture and Associates |
- |
- |
- |
|
EBT before Exceptional Items |
831.35 |
1,131.05 |
2,048.77 |
|
|
|
|
|
|
Exceptional Items |
- |
- |
- |
|
EBT |
831.35 |
1,131.05 |
2,048.77 |
|
|
|
|
|
|
Tax Expense |
126.98 |
320.46 |
546.35 |
|
PAT Non-Controlling Interests |
704.36 |
810.59 |
1,502.42 |
|
|
|
|
|
|
Non-Controlling Interests |
-0.05 |
-0.12 |
-0.03 |
|
PAT |
704.31 |
810.47 |
1,502.40 |
|
|
|
|
|
|
EPS |
|
|
|
|
Basic |
3.85 |
4.42 |
8.18 |
|
Diluted |
3.85 |
4.42 |
8.18 |
|
|
|
|
|
|
Number of Shares |
|
|
|
|
Basic |
182.90 |
183.17 |
183.60 |
|
Diluted |
183.16 |
183.33 |
183.68 |
Balance Sheet (₹ in millions)
|
|
Mar-20 |
Mar-21 |
Mar-22 |
|
ASSETS: |
|
|
|
|
Non-Current Assets: |
|
|
|
|
Property, Plant and Equipment |
2,167.07 |
2,064.17 |
2,085.33 |
|
Capital Work-in-Progress |
20.80 |
3.57 |
14.26 |
|
Investment Property |
136.93 |
136.93 |
136.93 |
|
Goodwill on Consolidation |
626.15 |
626.15 |
626.15 |
|
Intangible Assets |
8.20 |
8.40 |
12.17 |
|
Intangible Assets Under Development |
- |
2.58 |
6.66 |
|
Finance Assets: |
|
|
|
|
Investments |
398.07 |
398.07 |
652.19 |
|
Loans |
59.86 |
- |
- |
|
Others |
126.69 |
150.89 |
138.70 |
|
Deferred Tax Assets |
180.61 |
104.21 |
19.28 |
|
Other Assets |
92.89 |
89.71 |
30.56 |
|
Total Non-Current Assets |
3,817.25 |
3,584.67 |
3,722.24 |
|
|
|
|
|
|
|
|
|
|
|
Inventories |
1,111.39 |
1,289.14 |
3,450.30 |
|
Financial Assets: |
|
|
|
|
Investments |
1,237.09 |
2,950.07 |
3,978.77 |
|
Trade Receivables |
3,301.38 |
4,534.41 |
5,117.94 |
|
Cash and Cash Equivalents |
458.43 |
1,011.09 |
1,074.56 |
|
Other Bank Balances |
34.70 |
313.38 |
476.27 |
|
Loans |
0.14 |
- |
- |
|
Others |
39.38 |
45.66 |
74.50 |
|
Current Tax Assets |
85.16 |
- |
- |
|
Other Assets |
1,531.56 |
2,209.81 |
4,232.82 |
|
Total Current Assets |
7,799.22 |
12,353.54 |
18,405.17 |
|
|
|
|
|
|
Total Assets |
11,616.47 |
15,938.21 |
22,127.40 |
|
|
|
|
|
|
EQUITY AND LIABILITIES: |
|
|
|
|
Equity: |
|
|
|
|
Equity Share Capital |
366.32 |
366.46 |
367.35 |
|
Other Equity |
6,826.17 |
7,651.77 |
8,789.84 |
|
Total Equity to Owners of the Company |
7,192.49 |
8,018.23 |
9,157.19 |
|
|
|
|
|
|
Non-Controlling Interest |
6.70 |
6.82 |
6.84 |
|
Total Equity |
7,199.19 |
8,025.05 |
9,164.03 |
|
|
|
|
|
|
Liabilities: |
|
|
|
|
Non-Current Liabilities: |
|
|
|
|
Financial Liabilities |
- |
- |
- |
|
Borrowings |
- |
- |
- |
|
Lease Liabilities |
151.68 |
113.16 |
147.55 |
|
Provisions |
171.77 |
157.01 |
170.53 |
|
Total Non-Current Liabilities |
323.45 |
270.17 |
318.08 |
|
|
|
|
|
|
Current Liabilities: |
|
|
|
|
Financial Liabilities: |
|
|
|
|
Borrowings |
|
|
|
|
Trade Payables: |
|
|
|
|
Total Outstanding Dues of Micro and Small Enterprises |
196.50 |
362.56 |
396.41 |
|
Other Creditors |
1,678.44 |
3,053.59 |
3,851.49 |
|
Lease Liabilities |
- |
63.43 |
63.33 |
|
Other Financial Liabilities |
174.73 |
134.04 |
233.42 |
|
Other Current Liabilities |
1,971.66 |
3,762.61 |
7,761.35 |
|
Provisions |
72.52 |
251.13 |
315.38 |
|
Current Tax Liabilities |
- |
15.64 |
23.92 |
|
Total Current Liabilities |
4,093.83 |
7,642.99 |
12,645.29 |
|
|
|
|
|
|
Total Equity & Liabilities |
11,616.47 |
15,938.21 |
22,127.40 |
Cash Flow Statement (₹ in millions)
|
|
Mar-20 |
Mar-21 |
Mar-22 |
|
Net Profit Before Tax |
831.35 |
1,131.05 |
2,048.77 |
|
Net Cash from Operating Activities |
146.72 |
2,250.92 |
1,747.32 |
|
Net Cash Used for Investing Activities |
620.68 |
-1,643.24 |
-1,267.69 |
|
Net Cash From (Used For) Financing Activities |
-980.33 |
-62.88 |
-443.52 |
|
Net Increase in Cash and Cash Equivalents |
-212.93 |
544.80 |
36.11 |
|
Cash And Cash Equivalents at The Beginning of The Year |
635.60 |
458.43 |
1,011.09 |
|
Cash And Cash Equivalents at The End of the Year |
458.43 |
1,011.09 |
1,074.56 |
Ratio Analysis
|
|
Mar-20 |
Mar-21 |
Mar-22 |
|
Profitability Ratio |
|
|
|
|
Gross Profit |
52.62% |
45.55% |
39.25% |
|
EBITDA Margin |
9.80% |
10.58% |
9.86% |
|
EBIT Margin |
7.82% |
8.89% |
8.89% |
|
Pre-Tax Margin |
7.54% |
8.67% |
8.78% |
|
Net Profit Margin |
6.39% |
6.21% |
6.44% |
|
|
|
|
|
|
Return on Investment |
|
|
|
|
Return on Asset – ROA |
6% |
6% |
8% |
|
Return on Capital Employed – ROCE |
11% |
15% |
23% |
|
Return on Equity – ROE |
10% |
11% |
17% |
|
|
|
|
|
|
Liquidity Ratio (x) |
|
|
|
|
Current ratio |
1.91 |
1.62 |
1.46 |
|
Quick Ratio |
1.63 |
1.45 |
1.18 |
|
|
|
|
|
|
Turnover Ratio |
|
|
|
|
Receivables Turnover |
79.1 |
75.0 |
59.1 |
|
Inventory Turnover |
4.7 |
6.1 |
6.1 |
|
Payables Turnover |
2.9 |
3.1 |
4.2 |
|
Asset Turnover |
0.9 |
0.9 |
1.2 |
|
|
|
|
|
|
Solvency Ratio |
|
|
|
|
Debt to Equity |
0.00 |
0.00 |
0.00 |
|
Interest Coverage Ratio |
28 |
41 |
83 |
Technical Analysis
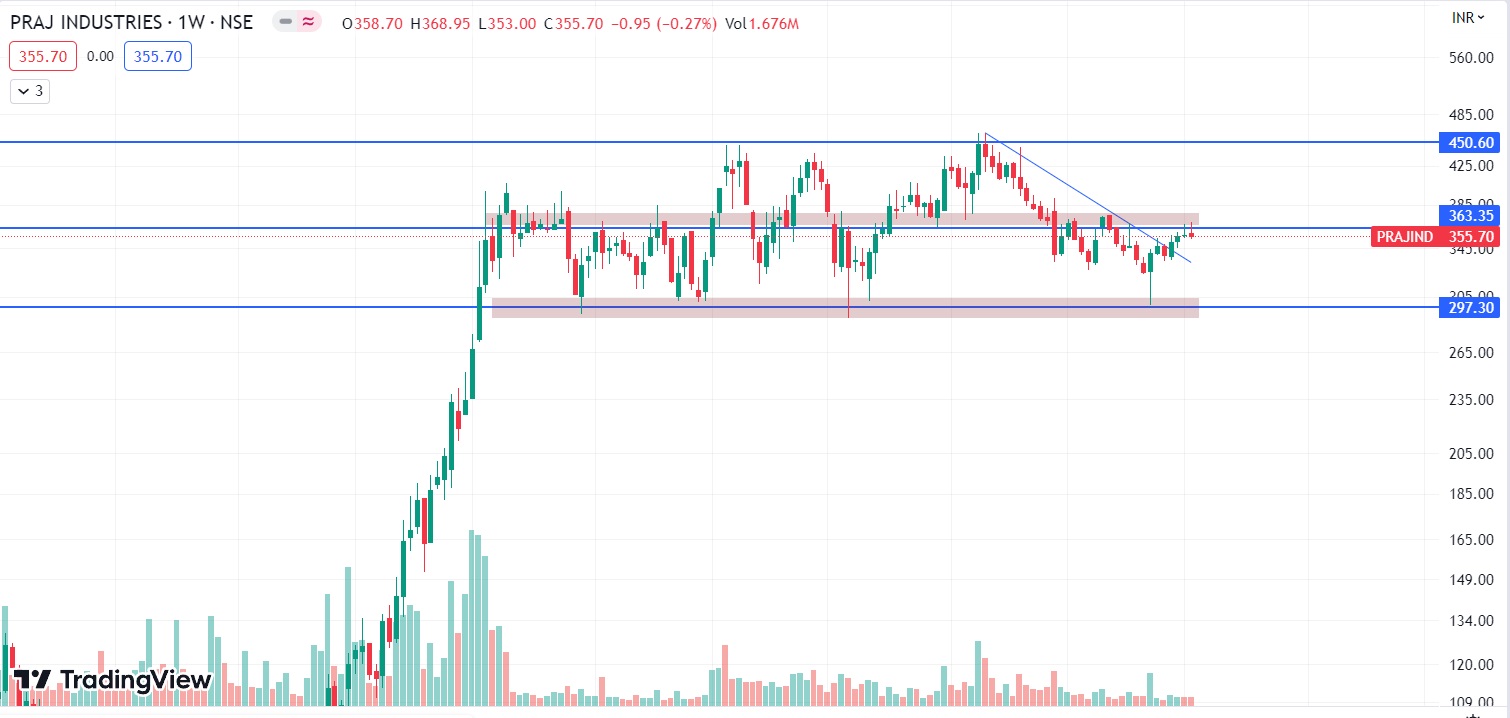
- Stock is in upward trend on monthly and weekly chart, ₹297 and ₹450 are support and resistance levels
- One can accumulate this stock at current levels.
CONCALL (Q3FY2023)
- Praj intends to boost capacity by investing INR 10,000-15,000 crores in 100-150 plants. The corporation is investing roughly INR 10,000 crores in researching various bioenergy feedstocks. The INR 100 crore investment would be used to build a manufacturing facility to meet the growing demand for vital equipment in the petrochemical and gas industries.
- Orders do not have to be closed in a certain order. On the 2G side, the business is not seeing any fresh orders. The benefit to margins is still to come. Praj provides operations and maintenance services in the Bioenergy sector. Praj is focusing on product development for the Bio-Prism RCM in the medium to long term.
- The government wants to introduce compressed biogas (CBG), and there may be a mandate to blend CBG as well. The CBG market is changing, and it is too early to determine market share, but the business intends to take the lead.
- A growing number of companies are launching flex-fuel cars that can operate on ethanol, increasing ethanol demand. Praj's short-term growth engine is ethanol, with CBG (compressed biogas) playing a role in the short to medium term.
- Partnerships for new goods are centered on medium to long-term development in order to maintain a growth trajectory. Praj and Axens have agreed to collaborate on the conversion of isobutanol and ethanol to SAF (sustainable aviation fuel).
- Praj is planning to manufacture hydrogen and is investing in modularized equipment solutions. Following the Inflation Reduction Act, the firm began providing services for decreasing carbon intensity in ethanol facilities in the United States.
- Praj does not provide quarterly revenue forecasts.
- Revenue and margins in these business divisions will be in accordance with order booking.
- Current ethanol blending is nearly 12%, and capacity for the remaining 8% is being built, with income expected in the next two to three years.
Recommendation Rationale
- Strong order book in pipeline:
- Orders of Rs 3,380 crore across the three business categories as of December 31, 2022, ensure medium-term revenue visibility.
- Because of the government's advantageous policies announced during the first nine months of fiscal 2023, new order inflows for the ethanol company increased during the first nine months of fiscal 2023.
- Rising demand and government policy assistance should boost Praj's bioenergy business. Order inflows are projected to steadily improve, and any changes in this area will be constantly observed.
- Diversified revenue stream:
- Praj has expanded into water and wastewater management, essential process equipment, bio-nutrients, and Hi-Purity Systems to reduce its reliance on its main industry of ethanol-based goods.
- These sectors, which are organised into two business divisions – Hi-Purity and engineering businesses – produced 25-30% of total revenue for the first nine months of fiscal 2023.
- The firm also has a diverse geographical footprint, with exports accounting for 15-20% of sales for the five fiscal years ending in December 2022.
- A well-established market position:
- Praj has long been the unchallenged market leader in domestic ethanol plant installation and equipment, as well as domestic breweries installation. The company's market position is additionally bolstered by its global presence, which includes over 1,000 references in over 100 countries and across five continents.
- End-to-end solutions are provided by the firm, which comprises process technology and equipment (distillery and brewery divisions), wastewater treatment technology, and essential process equipment. Furthermore, the successful commercialization of a demonstration second-generation ethanol plant and the fulfillment of orders for forthcoming projects in India would improve the business risk profile.
- In addition, fresh partnerships like those between Axens, France (for Sustainable Aviation Fuel), Sekab E-Technology AB, Sweden (producing biofuels using forest residue feedstock), and Indian Oil Corporation Ltd. (for the biofuels segment), as well as increased government focus on reaching a target of 20% in the ethanol blending by fiscal 2025, are anticipated to be the growth drivers in the medium term.
Valuation
- PSP Projects Limited has shown revenue growth of 26% CAGR for FY2018-2022.
- Net Profit has shown a growth rate of 40% CAGR for FY2018-2022.
- The company’s ROE and ROCE are 17% & 23% for FY2022.
- We estimate the company could generate higher revenue and net profit for the following FY 2023, comparable to the prior year, based on the company's present performance in FY 2022.
- To project income for the fiscal years 2023–2027, we used data from the previous five years (2018–2022).
Estimated Income Statement (₹ in millions)
|
|
Mar-23 |
Mar-24 |
Mar-25 |
Mar-26 |
Mar-27 |
|
|
2023-E |
2024-E |
2025-E |
2026-E |
2027-E |
|
Revenue |
29,816.08 |
37,527.52 |
47,243.54 |
59,486.26 |
74,913.90 |
|
COGS |
17,463.33 |
22,017.41 |
27,759.11 |
34,998.13 |
44,124.95 |
|
Gross Profit |
12,352.76 |
15,510.10 |
19,484.42 |
24,488.13 |
30,788.95 |
|
Employee Expenses |
2,941.80 |
3,708.96 |
4,676.19 |
5,895.64 |
7,433.11 |
|
Other Expenses |
5,902.54 |
7,441.80 |
9,382.47 |
11,829.23 |
14,914.06 |
|
EBITDA |
3,508.42 |
4,359.34 |
5,425.77 |
6,763.26 |
8,441.79 |
|
Depreciation |
230.04 |
231.34 |
239.09 |
254.35 |
278.50 |
|
EBIT |
3,278.38 |
4,128.01 |
5,186.68 |
6,508.90 |
8,163.28 |
|
Financial Cost |
39.60 |
49.86 |
62.65 |
78.63 |
98.61 |
|
EBT |
3,238.78 |
4,078.14 |
5,124.03 |
6,430.28 |
8,064.67 |
|
Tax expenses |
842.08 |
1,060.32 |
1,332.25 |
1,671.87 |
2,096.81 |
|
PAT |
2,396.70 |
3,017.83 |
3,791.78 |
4,758.41 |
5,967.86 |
Nayan Nahar Shubham Titvilasi
Equity Research Analyst Equity Research Analyst
Ph: 8149629086 Ph: 7415440968
Email: nayannahar23@gmail.com Email: shubham.titvilasi@gmail.com
Disclaimer: This report is only for the information of our customer Recommendations, opinions, or suggestions are given with the understanding that readers acting on this information assume all risks involved. The information provided herein is not to be construed as an offer to buy or sell securities of any kind.
- Share :


Post a Comment
|
DISCLAIMER |
This report is only for the information of our customers. Recommendations, opinions, or suggestions are given with the understanding that readers acting on this information assume all risks involved. The information provided herein is not to be construed as an offer to buy or sell securities of any kind. ATS and/or its group companies do not as assume any responsibility or liability resulting from the use of such information.