Escorts Ltd.
|
Current price |
139.95 |
|
Sector |
Tractor |
|
No of shares |
122576878 |
|
52 week high |
174.25 |
|
52 week low |
102.15 |
|
BSE Sensex |
28885.21 |
|
Nifty |
8778.30 |
|
Average Volume |
993767 |
|
BSE Code |
500495 |
|
NSE Symbol |
ESCORTS |
Escorts Limited - Company Overview
Escorts Limited manufactures and sells agri machinery, construction equipment, railway products, and auto products in India and internationally. It offers tractors under the Farmtrac, Powertrac, and Escort brands; engines for agricultural tractors; round end flat tubes; heating elements; double acting hydraulic shock absorbers for railways coaches; and center buffer couplers. Escorts Limited also provides automobile shock absorbers, telescopic front forks, Mcpherson struts, break blocks, and internal combustion engines, as well as various breaks used in railway, construction, earth moving, and material handling equipment. In addition, it trades in oils and lubricants, implements, trailers, compressor accessories and spares, construction equipment, and earth moving and material handling equipments, a well as offers lubricants, such as engine and gear oils. Escorts Limited also offer brakes, couplers, shock absorbers, rail fastening systems, composite brake blocks and vulcanized rubber parts.
Escorts Limited company through their subsidiaries operates in the ITES and financial services sectors. The company is also involved in the aero business; and financing and investment activities, as well as offers engines and gensets. Escorts Limited was incorporated in 1944 and is based in Faridabad, India. Escorts has had the privilege of being associated with some of the world leaders in the engineering manufacturing space like Minneapolis Moline, Massey Ferguson, Goetze, Mahle, URSUS, CEKOP, Ford Motor Company, J C Bamford Excavators, Yamaha, Claas, Carraro, Lucky Goldstar, First Pacific Company, Hughes Communications, Jeumont Schneider, Dynapac .
Today, Escort Agri Machinery Group has a nationwide network with over 600 dealers, 100 parts stockiests and 30 area offices. Their national share stands at 20%. The company has developed its own in-house state-of-the-art technology R&D facility. The main focus of the R&D facility is to develop new and better products - products that can offer improved performance with lower fuel consumption and least maintenance and parts requirements. The current market capitalisation stands at Rs 1,680.53 crore.
Escorts Limited - Share Holding Pattern
|
Category |
No. of Shares |
Percentage |
|
Promoters |
51,433,750 |
41.96 |
|
General Public |
46,534,451 |
37.96 |
|
Foreign Institutions |
11,416,181 |
9.31 |
|
Other Companies |
8,516,909 |
6.95 |
|
NBFC and Mutual Funds |
3,688,198 |
3.01 |
|
Financial Institutions |
987,389 |
0.81 |
Escorts Limited - Financial Details
-
Market Cap (Rs Cr) – 1667.05
-
Company P/E (x) – 17.78
-
Industry P/E (x) – 19.82
-
Book Value (Rs) – 149.62
-
Price / BV (x) – 0.91
-
Dividend (%) – 18%
-
EPS (TTM) – 7.65
-
Dividend Yield (%) – 1.32 %
-
Face Value (Rs) – 10
Escorts Limited - Industry Overview
Indian Tractor industry is the largest in world and contributes around 33% to global production. Indian Tractor Industry, comparatively young by world standards has expanded at a spectacular pace during the last four decades. Consequently it now occupies a place of pride in India's Automobile Industry also.
India's growth is unmatched even with countries of long history of Tractor manufacturing. The Indian Tractor Industry's spectacular achievement reflects the maturity and dynamism of tractor manufacturers and the various policies adopted by the government to enable it to effectively meet the demand. It is a typical industry where both imported technology and indigenous developed technology have developed towards meeting the overall national requirements of the country
Overall tractor sales (domestic +exports) have declined by 0.7% YoY during 5m FY15. ICRA however expects some pick-up in tractor sales during the latter half of the fiscal year, and our FY15 growth outlook (for domestic +export) stands at 4%. The outlook could however be revised downwards, if domestic demand fails to pick-up in the festive season. ICRA continues to maintain a volume CAGR of (8-9%) for the tractor Industry over the next five years as long term industry drivers remain favorable.
Government of India (GOI) remains committed towards rural development and agri-mechanisation besides other factors like scarcity of farm labour, healthy credit availability, moderate penetration and shortening replacement cycle, continue to encourage demand for tractors. Further, there has been considerable variation in growth rates, across geographies. Southern (except Tamil Nadu) and Western markets continued to grow during the current year, supported by relatively better monsoon precipitation. Central region however, registered a decline of 10.8% in light of high base, and weak rainfall during the current year. Volumes in Northern region also contracted, as a consequence of weak sentiments in farming community. Variance in growth across geographies, has also impacted market share of OEMs.
Balance Sheet
|
|
Mar '14 |
Sep '12 |
Sep '11 |
Sep '10 |
Sep '09 |
|
Sources Of Funds |
|
|
|
|
|
|
Total Share Capital |
119.27 |
119.27 |
102.31 |
102.28 |
90.71 |
|
Equity Share Capital |
119.27 |
119.27 |
102.31 |
102.28 |
90.71 |
|
Reserves |
1,712.11 |
1,494.69 |
1,641.56 |
1,571.08 |
1,278.48 |
|
Networth |
1,831.38 |
1,613.96 |
1,743.87 |
1,673.36 |
1,369.19 |
|
Secured Loans |
345.31 |
458.04 |
359.87 |
283.78 |
253.79 |
|
Unsecured Loans |
5.09 |
1.89 |
12.73 |
14.82 |
10.36 |
|
Total Debt |
350.40 |
459.93 |
372.60 |
298.60 |
264.15 |
|
Total Liabilities |
2,181.78 |
2,073.89 |
2,116.47 |
1,971.96 |
1,633.34 |
|
Application Of Funds |
|
|
|
|
|
|
Gross Block |
2,399.73 |
2,281.54 |
2,141.12 |
2,095.45 |
2,059.83 |
|
Less: Revaluation Reserves |
0.00 |
0.00 |
54.58 |
64.47 |
75.00 |
|
Less: Accum. Depreciation |
757.04 |
695.29 |
679.24 |
645.74 |
602.93 |
|
Net Block |
1,642.69 |
1,586.25 |
1,407.30 |
1,385.24 |
1,381.90 |
|
Capital Work in Progress |
37.36 |
66.49 |
53.52 |
19.43 |
10.71 |
|
Investments |
381.50 |
385.91 |
365.80 |
365.80 |
235.80 |
|
Inventories |
550.97 |
496.61 |
327.36 |
295.50 |
199.49 |
|
Sundry Debtors |
352.41 |
445.44 |
340.53 |
332.62 |
329.15 |
|
Cash and Bank Balance |
160.77 |
130.57 |
140.86 |
101.54 |
107.57 |
|
Total Current Assets |
1,064.15 |
1,072.62 |
808.75 |
729.66 |
636.21 |
|
Loans and Advances |
367.00 |
304.64 |
457.97 |
405.22 |
272.60 |
|
Fixed Deposits |
0.00 |
0.00 |
146.33 |
72.87 |
57.23 |
|
Total CA, Loans & Advances |
1,431.15 |
1,377.26 |
1,413.05 |
1,207.75 |
966.04 |
|
Current Liabilities |
1,110.80 |
1,143.33 |
919.30 |
773.71 |
776.85 |
|
Provisions |
200.12 |
198.69 |
205.77 |
234.50 |
189.68 |
|
Total CL & Provisions |
1,310.92 |
1,342.02 |
1,125.07 |
1,008.21 |
966.53 |
|
Net Current Assets |
120.23 |
35.24 |
287.98 |
199.54 |
-0.49 |
|
Miscellaneous Expenses |
0.00 |
0.00 |
1.87 |
1.95 |
5.42 |
|
Total Assets |
2,181.78 |
2,073.89 |
2,116.47 |
1,971.96 |
1,633.34 |
|
Contingent Liabilities |
356.08 |
333.75 |
307.84 |
284.22 |
233.91 |
|
Book Value (Rs) |
153.56 |
135.33 |
170.46 |
163.61 |
150.94 |
Profit and Loss Account
|
|
Mar '14 |
Sep '12 |
Sep '11 |
Sep '10 |
Sep '09 |
|
Income |
|
|
|
|
|
|
Sales Turnover |
6,291.51 |
3,893.88 |
3,268.87 |
2,785.86 |
2,197.20 |
|
Excise Duty |
0.00 |
0.00 |
26.15 |
22.64 |
18.59 |
|
Net Sales |
6,291.51 |
3,893.88 |
3,242.72 |
2,763.22 |
2,178.61 |
|
Other Income |
85.05 |
50.58 |
47.53 |
18.78 |
9.15 |
|
Stock Adjustments |
17.41 |
57.81 |
24.54 |
44.69 |
16.94 |
|
Total Income |
6,393.97 |
4,002.27 |
3,314.79 |
2,826.69 |
2,204.70 |
|
Expenditure |
|
|
|
|
|
|
Raw Materials |
4,591.61 |
3,003.09 |
2,371.26 |
1,935.29 |
1,480.97 |
|
Power & Fuel Cost |
64.03 |
39.47 |
35.22 |
31.99 |
26.25 |
|
Employee Cost |
667.35 |
406.12 |
327.92 |
289.24 |
238.43 |
|
Other Manufacturing Expenses |
0.00 |
0.00 |
37.85 |
36.63 |
19.61 |
|
Selling and Admin Expenses |
0.00 |
0.00 |
305.78 |
251.51 |
211.08 |
|
Miscellaneous Expenses |
604.69 |
320.77 |
26.72 |
31.78 |
19.48 |
|
Total Expenses |
5,927.68 |
3,769.45 |
3,104.75 |
2,576.44 |
1,995.82 |
|
Operating Profit |
381.24 |
182.24 |
162.51 |
231.47 |
199.73 |
|
PBDIT |
466.29 |
232.82 |
210.04 |
250.25 |
208.88 |
|
Interest |
110.67 |
96.44 |
70.52 |
51.98 |
61.10 |
|
PBDT |
355.62 |
136.38 |
139.52 |
198.27 |
147.78 |
|
Depreciation |
83.22 |
48.43 |
37.97 |
38.54 |
37.84 |
|
Profit Before Tax |
272.40 |
87.95 |
100.61 |
159.04 |
106.88 |
|
Extra-ordinary items |
0.00 |
0.00 |
44.26 |
29.95 |
4.34 |
|
PBT (Post Extra-ord Items) |
272.40 |
87.95 |
144.87 |
188.99 |
111.22 |
|
Tax |
27.51 |
18.35 |
19.02 |
50.47 |
21.33 |
|
Reported Net Profit |
244.89 |
69.60 |
120.09 |
137.55 |
89.73 |
|
Total Value Addition |
1,336.07 |
766.36 |
733.49 |
641.15 |
514.85 |
|
Equity Dividend |
22.06 |
14.71 |
15.84 |
16.20 |
9.07 |
|
Corporate Dividend Tax |
3.75 |
2.39 |
2.57 |
2.69 |
1.54 |
|
Per share data (annualised) |
|
|
|
|
|
|
Shares in issue (lakhs) |
1,192.63 |
1,192.63 |
1,023.04 |
1,022.74 |
907.09 |
|
Earning Per Share (Rs) |
20.53 |
5.84 |
11.74 |
13.45 |
9.89 |
|
Equity Dividend (%) |
18.00 |
12.00 |
15.00 |
15.00 |
10.00 |
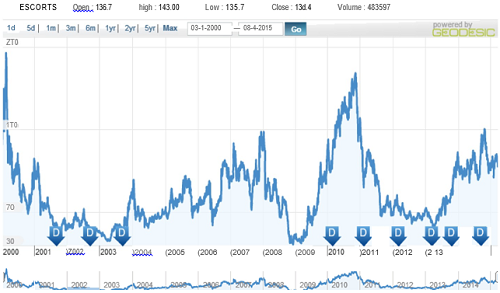
Dividend History
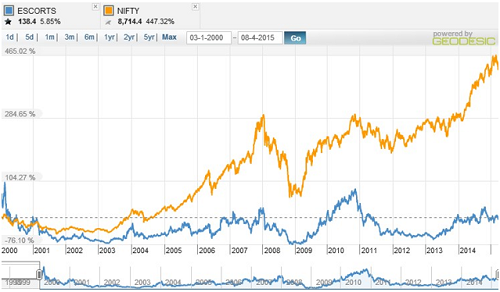
Index and Company Price Movement Comparison
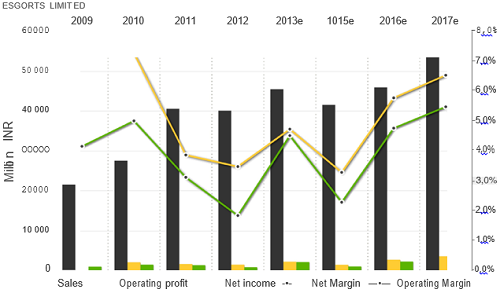
Company Forecast
Technical Indicators
|
Symbol |
Value |
Action |
|
RSI(14) |
56.970 |
Buy |
|
STOCH(9,6) |
40.323 |
Sell |
|
STOCHRSI(14) |
83.733 |
Overbought |
|
MACD(12,26) |
0.630 |
Buy |
|
ADX(14) |
34.590 |
Buy |
|
Williams %R |
-33.333 |
Buy |
|
CCI(14) |
107.7219 |
Buy |
|
ATR(14) |
5.0214 |
Less Volatility |
|
Highs/Lows(14) |
2.5607 |
Buy |
|
Ultimate Oscillator |
49.468 |
Neutral |
|
ROC |
-0.690 |
Sell |
|
Bull/Bear Power(13) |
9.5980 |
Buy |
Important Ratios (YoY)
-
PBIT – 4.67 v/s 3.39
-
RoCE – 17.39 v/s 8.81
-
RoE – 13.37 v/s 6.67
-
Net Profit Margin – 3.84 v/s 1.76
-
Return on net worth – 13.37 v/s 4.31
-
D/E Ratio – 0.19 v/s 0.28
-
Interest Cover – 3.43 v/s 1.89
-
Current Ratio – 0.83 v/s 0.72
-
Reserves – 1712.11 cr v/s 1494.69 cr
-
PAT – 244.90 v/s 69.60 cr
-
Total assets – 2181.00 cr v/s 2073.90 cr
-
Net sales – 6292.51 cr v/s3893.88 cr
-
Book Value – 153.56 v/s 135.33
Simple Moving Average
|
Days |
BSE |
NSE |
|
30 |
133.68 |
133.92 |
|
50 |
130.72 |
130.84 |
|
150 |
137.36 |
137.41 |
|
200 |
134.28 |
134.30 |
Investment Rationalize
-
Escorts Ltd. is a leading player in Indian tractor industry with Net Sales of Rs.6292.51 crore and Reserves of R.1831.38 crore which will help the company to fund the capital requirements internally.
-
Governments policy of “Make in India” will provide the company as supplement to growth as the companies majority revenue comes from tractors, construction equipments, railways products and auto ancillaries.
-
Companies Sales has a CAGR of 23.6% in the last five years and have inventories of Rs.550 crore which the company will be able to capitalize when the demands for the products improves.
-
Governments emphasis on improving agriculture industry in India will be major boost for the Escorts as the companies majority revenue comes from tractor segment.
-
Cash conversion cycle and Working capital cycle of the company has improved in recent years, which shows the higher efficiency of the company and improved availability of cash to meet the financial requirements.
-
Launching of high quality products with best in the market technology will help to increase the revenue of the company in a significant manner.
-
Improvement in economic situation in far east Asia, Europe and Latin America will increase the revenue from exports to the company.
-
Increase in revenue from Railways products, Construction Equipments and Auto Ancillaries will add to the profitability of the company.
- Share :


Post a Comment
|
DISCLAIMER |
This report is only for the information of our customers. Recommendations, opinions, or suggestions are given with the understanding that readers acting on this information assume all risks involved. The information provided herein is not to be construed as an offer to buy or sell securities of any kind. ATS and/or its group companies do not as assume any responsibility or liability resulting from the use of such information.