Exide Industries Limited Research Report
|
Industry |
Market Price |
Recommendation |
Target |
Time Horizon |
|
Auto Ancillaries |
159.60 |
Buy |
243 |
1.2-Year |
Q3 FY 2022 Review
Exide Batteries Limited reported net revenue of ₹3,196.65 crores for the quarter ended December 31, 2021, compared to ₹2,801 crores for the quarter ended December 31, 2020. EBIT and Profit After Tax were ₹283.55 crores and ₹204.10 crores for the quarter ended December 31, 2021, as compared to ₹327.62 crores and ₹241.44 crores, during the corresponding quarter of the previous year.
Exide Batteries Limited - Investment Summary
|
CMP (₹) |
159.60 |
|
52 Week H/L |
139.30/204.9 |
|
Market Cap (crores) |
13,578 |
|
Face Value (₹) |
1.00 |
|
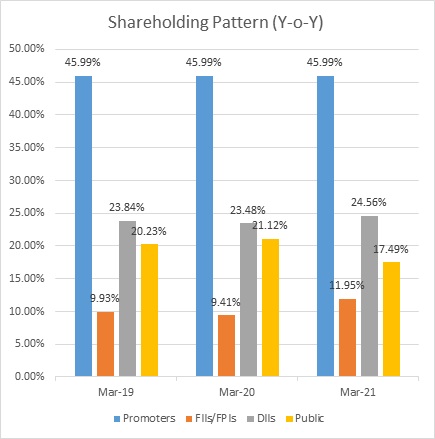
Promoter Holding (%) |
45.99 |
|
Non-Promoter Holding (%) |
50.01 |
|
Total (%) |
100.00 |
|
Book Value |
₹81.10 |
|
EPS TTM |
₹8.93 |
Overview
-
Exide Industries Limited divested its holding in Exide Life to HDFC Life for total consideration of ₹6,687 crores with ₹726 crores in cash and 87.02 crores of shares in HDFC Life issued at ₹685 per share.
-
Exide Industries Limited has entered into a long-term technical collaboration with SVOLT Energy Technology for lithium-ion-cell manufacturing.
-
The company has incorporated a wholly-owned subsidiary, i.e., Exide Energy Solutions Limited to set up a greenfield multi-gigawatt lithium-ion cell manufacturing facility.
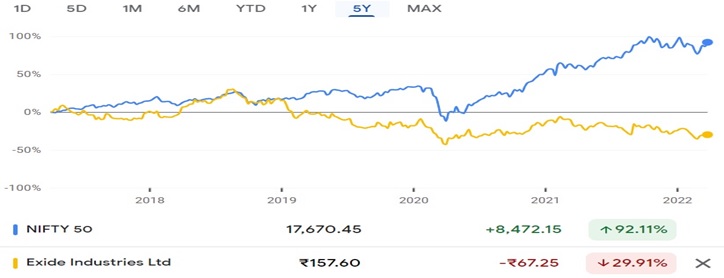
Beta: 0.81 |
Alpha: -20.48 |
Risk Reward Ratio: 1.67 |
Margin of Safety: 35% |
Exide Batteries Limited - Quarterly Summary
|
Quarterly (INR in crore) |
Dec-21 |
Sep-21 |
Jun-21 |
Mar-21 |
Dec-20 |
|
Sales |
3196.7 |
3290 |
2486.4 |
2938.84 |
2801 |
|
Other Income |
15.03 |
10.92 |
15.15 |
23.53 |
20.1 |
|
Total Revenue |
3211.7 |
3300.92 |
2501.55 |
2962.37 |
2821.1 |
|
Total Expenditure |
2928.1 |
2977.81 |
2326.68 |
2623.91 |
2493.48 |
|
EBIT |
283.55 |
323.11 |
174.87 |
338.46 |
327.62 |
|
Interest |
8.3 |
8.57 |
10.92 |
8.49 |
7.59 |
|
EBT |
275.25 |
314.54 |
163.95 |
329.97 |
320.03 |
|
Tax |
71.15 |
80.18 |
38.53 |
85.85 |
78.59 |
|
Net Profit |
204.1 |
234.36 |
125.42 |
244.12 |
241.44 |
Business
-
For more than seven decades, Exide has been one of India’s most reliable battery brands, enjoying an unrivalled reputation and recall.
-
Exide designs, manufactures, markets, and sells the broadest range of lead-acid storage batteries worldwide, from 2.5Ah to 20,0000 Ah. Capacity to cover the broadest spectrum of applications.
-
The batteries are manufactured for the Automotive, Power, Telecom, Infrastructure Projects, Computer Industries, and the Railways, Minings, and Defense sectors.
-
The company enjoys a leadership position in India, and its exports span 60 countries across six countries.
-
A few years back, Exide also forayed into lithium-ion battery systems and energy solutions through its subsidiary Exide Leclanche Energy Limited (under the brand Nexcharge), together with JV partner Leclanche SA Switzerland with its state-of-the-art R&D Centre, the subsidiary aims to build lithium-ion modules/packs lithium-ion energy storage systems for India’s electric vehicle and grid-based application.
-
As of March 22, 2022, Chloride Metals Limited, a wholly-owned material subsidiary of Exide Industries Limited, started commercial production at its newly set-up greenfield manufacturing battery recycling facility at Haldia, in the state of West Bengal. The said recycling plant is spread over 21 acres. It is equipped with modern state-of-art technology with the help of global engineering firm Engitec Technologies S.P.A. Italy. The total installed capacity of the plant is 1,08,000 MT
- p.a.
-
With the addition of a new plant recycling plant, Chloride Metal Limited is now operating with three battery recycling plants in Maharashtra, Karnataka, and West Bengal.
-
Company has a strong distribution network with 150+ warehouses and 48,000 direct and indirect dealers. It has also market share close to 55% in organized market in the lead acid battery markets.
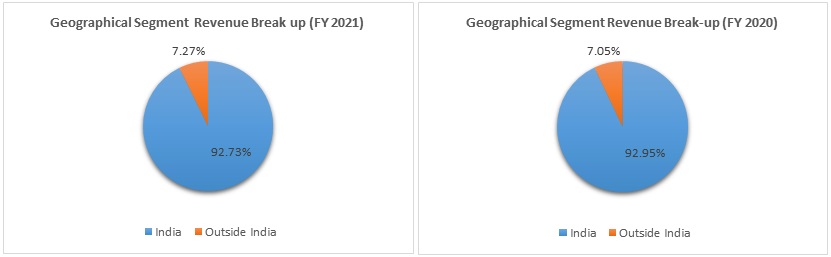
-
Out of the total revenue, 92.73% of revenue have generated from India and 7.27% from other countries in FY 2021, compared to 92.95% and 7.05% in FY 2020.
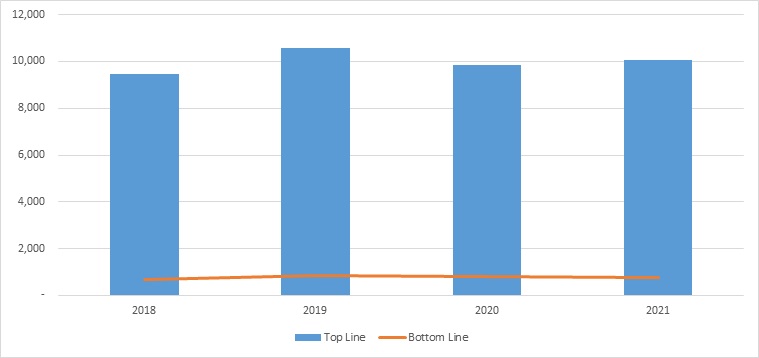
Exide Batteries Limited - Revenue Trend
Topline and Bottomline trend (crores)
Ratio Analysis
|
|
Mar-18 |
Mar-19 |
Mar-20 |
Mar-21 |
|
Profitability Ratio |
|
|
|
|
|
EBITDA Margin |
37.08% |
34.53% |
37.07% |
35.12% |
|
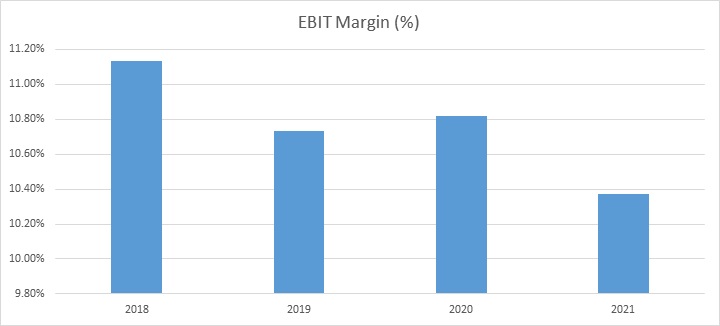
EBIT Margin |
13.73% |
13.69% |
14.50% |
14.15% |
|
Pre-Tax Margin |
10.64% |
11.70% |
10.50% |
10.14% |
|
Net Profit Margin |
11.13% |
10.73% |
10.82% |
10.37% |
|
|
7.02% |
7.94% |
8.32% |
7.50% |
|
Return on Investment |
|
|
|
|
|
Return on Asset – ROA |
9.43% |
10.84% |
10.06% |
8.49% |
|
Return on Capital Employed – ROCE |
19.59% |
19.26% |
16.78% |
15.09% |
|
Return on Equity – ROE |
12.91% |
14.84% |
13.44% |
11.50% |
|
Liquidity Ratio |
||||
|
Current ratio (x) |
1.79 |
1.77 |
1.91 |
1.89 |
|
Quick Ratio |
0.82 |
0.85 |
0.66 |
0.88 |
|
Turnover Ratio |
||||
|
Receivables Turnover |
30 |
35 |
35 |
31 |
|
Inventory Turnover |
100 |
93 |
116 |
126 |
|
Payables Turnover |
56 |
58 |
61 |
68 |
|
Asset Turnover |
1.29 |
1.30 |
1.20 |
1.05 |
Exide Batteries Limited - Financial Overview
Profit and Loss Statement (₹ in Crores)
|
|
Mar-18 |
Mar-19 |
Mar-20 |
Mar-21 |
|
Revenue |
9,459.80 |
10,588.31 |
9,856.66 |
10,040.84 |
|
Other Income |
58.41 |
38.50 |
63.94 |
65.44 |
|
Total Revenue |
9,518.21 |
10,626.81 |
9,920.60 |
10,106.28 |
|
|
||||
|
Cost Of Goods Sold |
6,010.43 |
6,970.24 |
6,266.39 |
6,579.51 |
|
Gross Profit |
3,507.78 |
3,656.57 |
3,654.21 |
3,526.77 |
|
|
||||
|
Excise Duty |
273.48 |
- |
- |
- |
|
Employee Benefits Expenses |
597.17 |
637.66 |
666.40 |
721.52 |
|
Others Expenses |
1,337.96 |
1,569.07 |
1,558.89 |
1,384.23 |
|
EBITDA |
1,299.17 |
1,449.84 |
1,428.92 |
1,421.02 |
|
|
||||
|
Depreciation And Amortisation |
245.94 |
313.50 |
362.63 |
379.35 |
|
EBIT |
1,053.23 |
1,136.34 |
1,066.29 |
1,041.67 |
|
|
||||
|
Finance Cost |
5.24 |
6.05 |
9.40 |
23.77 |
|
EBT Before Exceptional Items |
1,047.99 |
1,130.29 |
1,056.89 |
1,017.90 |
|
|
||||
|
Exceptional Items |
(41.83) |
108.29 |
(21.70) |
- |
|
EBT |
1,006.16 |
1,238.58 |
1,035.19 |
1,017.90 |
|
|
||||
|
Tax Expenses |
337.81 |
394.53 |
209.68 |
259.62 |
|
PAT |
668.35 |
844.05 |
825.51 |
758.28 |
|
|
||||
|
EPS |
||||
|
Basic |
7.86 |
9.93 |
9.71 |
8.93 |
|
Diluted |
7.86 |
9.93 |
9.71 |
8.92 |
|
|
||||
|
Number Of Shares |
||||
|
Basic |
85 |
85 |
85 |
85 |
|
Diluted |
85 |
85 |
85 |
85 |
Cash Flow Statement (₹ in crores)
|
|
Mar-18 |
Mar-19 |
Mar-20 |
Mar-21 |
|
Net Profit Before Tax |
1,006.16 |
1,238.58 |
1,035.19 |
1,017.90 |
|
Net Cash from Operating Activities |
516.61 |
1,003.79 |
913.63 |
1,413.39 |
|
Net Cash Used for Investing Activities |
(28.04) |
(765.61) |
(324.87) |
(1,276.87) |
|
Net Cash From (Used For) Financing Activities |
(421.25) |
(251.99) |
(508.59) |
(198.85) |
|
Net Increase in Cash and Cash Equivalents |
67.32 |
(13.81) |
80.17 |
(62.33) |
|
Cash And Cash Equivalents at The Beginning of The Year |
11.19 |
78.51 |
64.70 |
144.87 |
|
Cash And Cash Equivalents at The End of Year |
78.51 |
64.70 |
144.87 |
82.54 |
Balance Sheet (₹ in crores)
|
|
Mar-18 |
Mar-19 |
Mar-20 |
Mar-21 |
|
ASSETS: |
|
|
|
|
|
Non-current Assets: |
|
|
|
|
|
Property, Plant and Equipment |
1,934.97 |
2,265.97 |
2,302.92 |
2,601.79 |
|
Capital Work-in-Progress |
233.50 |
254.93 |
296.88 |
200.75 |
|
Investment Property |
- |
- |
34.23 |
33.77 |
|
Intangible Assets |
23.36 |
31.30 |
36.47 |
36.06 |
|
Finance Assets: |
||||
|
Investments |
1,765.11 |
1,945.48 |
2,052.07 |
2,176.09 |
|
Trade Receivables |
1.18 |
0.18 |
0.10 |
0.08 |
|
Loans |
12.62 |
18.18 |
17.19 |
23.64 |
|
Current Tax Assets |
71.66 |
88.62 |
64.72 |
51.05 |
|
Other Non-Current Assets |
102.51 |
95.79 |
98.00 |
110.65 |
|
Total Non-Current Assets |
4,144.91 |
4,700.45 |
4,902.58 |
5,233.88 |
|
Current Assets: |
||||
|
Inventories |
1,760.15 |
1,803.97 |
2,192.27 |
2,346.19 |
|
Financial Assets: |
||||
|
Investments |
203.89 |
253.91 |
18.73 |
882.54 |
|
Trade Receivables |
943.39 |
1,081.04 |
815.30 |
887.37 |
|
Cash and Cash Equivalents |
78.51 |
64.70 |
144.87 |
82.54 |
|
Other Bank Balances |
8.68 |
8.85 |
9.72 |
8.81 |
|
Loans |
14.58 |
13.98 |
14.98 |
14.65 |
|
Other Financial Assets |
24.80 |
33.19 |
24.66 |
38.50 |
|
Other Current Assets |
217.97 |
212.33 |
119.58 |
140.52 |
|
Total Current Assets |
3,251.97 |
3,471.97 |
3,340.11 |
4,401.12 |
|
Total Assets |
7,396.88 |
8,172.42 |
8,242.69 |
9,635.00 |
|
Equity And Liabilities: |
||||
|
Equity: |
||||
|
Equity Share Capital |
85.00 |
85.00 |
85.00 |
85.00 |
|
Other Equity |
5,304.31 |
5,901.99 |
6,211.11 |
6,808.51 |
|
Total Equity |
5,389.31 |
5,986.99 |
6,296.11 |
6,893.51 |
|
|
|
|
|
|
|
Liabilities: |
||||
|
Financial Liabilities: |
||||
|
Lease Liabilities |
- |
- |
27.39 |
279.29 |
|
Trade Payables: |
||||
|
Total Oustanding Dues of Micro and Small Enterprise |
- |
- |
- |
- |
|
Other Creditors |
4.36 |
4.79 |
5.74 |
6.64 |
|
Other Financial Liabilities |
2.62 |
2.26 |
2.95 |
3.75 |
|
Provisions |
46.45 |
45.16 |
63.78 |
53.68 |
|
Deferred Tax Liabilities |
140.50 |
175.14 |
101.86 |
77.05 |
|
Total Non-Current Liabilities |
193.93 |
227.35 |
201.72 |
420.41 |
|
Current Liabilities: |
||||
|
Financial Liabilities: |
||||
|
Borrowings |
||||
|
Lease Liabilities |
- |
- |
0.61 |
6.23 |
|
Trade Payables: |
||||
|
Total Oustanding Dues of Micro and Small Enterprise |
4.08 |
3.75 |
71.36 |
132.65 |
|
Other Creditors |
1,074.63 |
1,139.04 |
958.96 |
1,508.96 |
|
Other Financial Liabilities |
335.56 |
386.56 |
275.41 |
221.35 |
|
Other Current Liabilities |
166.51 |
160.26 |
141.49 |
174.93 |
|
Provisions |
232.86 |
268.47 |
296.42 |
270.73 |
|
Total Current liabilities |
1,813.64 |
1,958.08 |
1,744.86 |
2,321.08 |
|
Total Equity & Liabilities |
7,396.88 |
8,172.42 |
8,242.69 |
9,635.00 |
Industry Overview
-
The battery market in India is expected to record a CAGR of more than 15%.
-
The Outbreak of the Covid-19 pandemic in Q1 2020 had a significant impact on the growth of the battery market in the country.
-
The lockdown measures imposed by the government to stop the outspread of covid-19 negatively impacted major shipping events for the manufacturing units of lithium-ion and lead-acid batteries in the country.
-
Factors such as the emergence of new and exciting markets, i.e., electric vehicles and battery energy storage systems for different applications, are expected to be the major drivers for the battery market in India.
-
Plans for the local manufacturing of lithium-ion batteries in India are expected to bring down the EV cost and reduce the dependency and import duties that are likely to provide an opportunity for the lithium-battery market.
-
India is one of the most significant automobiles globally, and, in FY 2021, the total automobile production reached 2,26,52,108 units. The country produced 6,24,939 commercial vehicles in FY 2021.
-
The Two-wheeler segment dominates the automotive market owing to a growing middle class and a young population. The Indian Automotive replacement battery market is leading the lead-acid battery market.
-
The government’s efforts to boost automotive battery manufacturing in India will drive the segment’s growth. On November 11, 2020, the Indian government announced incentives worth INR 3 trillion (approximately USD 40 billion) to encourage companies in ten sectors to boost local manufacturing and increase exports. The incentive scheme worth INR 180 billion (about USD 2.4 billion) will be directed toward advanced cell chemistry, bringing at least 50 GW of lithium-ion batteries manufactured in India.
-
With an increasing population and accessible financing facilities, the automobile sector is expected to grow significantly. Electric vehicle (EV) sales are expected to support the segment.
-
The demand for lithium batteries in non-automotive applications is forecast to increase from 0.3 GWh to 12 GWh, driven by telecom towers, data centers, grid-scale renewable energy (RE) integration, and rooftop solar.
Peer Comparison
|
|
|
9 -Months FY-2022 |
Ratio- (FY-2021) |
||
|
|
Market Cap. (cr.) |
Revenue (cr.) |
PAT (cr.) |
ROCE |
ROE |
|
Exide Industries Limited |
13,336 |
8,973.05 |
563.88 |
15% |
11% |
|
Amara Raja Batteries Limited |
9,537 |
6,516.19 |
413.72 |
33% |
16% |
Exide Batteries Limited - Technical Analysis
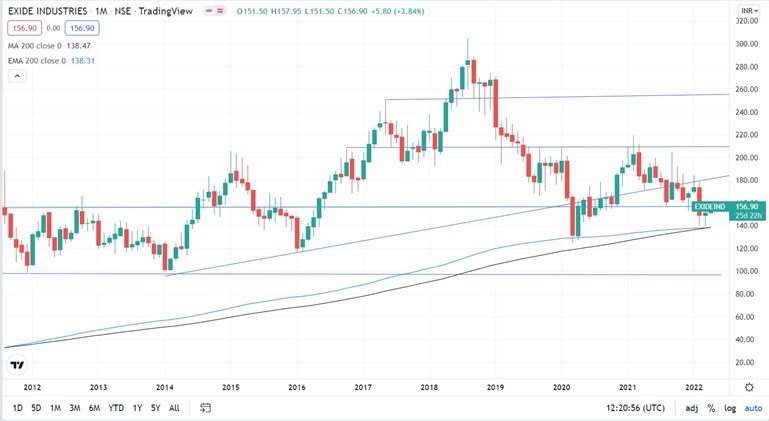
-
Stock is trading above EMA 200 and MA 200 indicators, with a strong support level of ₹156 and a resistance level at ₹210.
-
One can accumulate this share at the current price.
Recommendation Rationale:
-
For the first nine months, Exide Industries Limited’s revenue increased by 26% to ₹8,973.05 crores, compared to the previous year at ₹7,102 crores. Profit After Tax increased by 9.67% to ₹563.88 crores, compared to the last year at ₹514.16 crores.
-
The company is virtually debt-free and has a strong liquidity position.
-
Total number of mutual fund schemes that bought share of Exide Industries limited during this amid volatile market was 10. Total number of mutual fund schemes that held the stock is 41.
-
Demand for Batteries is increasing due to recovery in the automotive replacement market, an increase in demand for Industrial UPS due to high pickup in commercial activity. Also, there are high order inflows for batteries from Data-centers.
-
In Q3FY2021, the board of directors has granted approvals to set-up multi a gigawatt Li-ion cells manufacturing plant in India. Exide has participated in the production-linked incentive scheme for the National Programme on Advanced Chemistry Cell (ACC) Battery Storage issued by the Ministry of Heavy Industries as part of its commitment to venture into the Li-ion cell manufacturing business.
-
The company divested its insurance business to focus on its battery business entirely.
-
With recovery demand in the automobile sector, increasing use of batteries in different sectors like telecommunication, railways, and data centers, will increase demand for the company’s products.
Valuation
-
As the company has divested its insurance business, data on a standalone financial statement is taken for valuation purposes.
-
The company has grown at a 2% Compounded annual growth rate from FY 2018 to FY 2021.
-
The company’s revenue decreased by 7% in FY 2020 compared to the previous year due to the covid-19 pandemic. It rebounded with a growth of 2% in FY 2021
-
The company’s net profit was impacted for two years due to the covid-19 pandemic and increased raw materials prices.
-
Based on the current performance of the company in the first nine months, we expect the company could post higher revenue for the current financial (2022), corresponding to the previous year.
-
We have taken data for the last five years (2017-2021) and forecasted revenue for FY 2022-2026. Revenue growth is assumed to be 7%.
Estimated Income Statement (₹ in crores):
|
|
Mar-22 |
Mar-23 |
Mar-24 |
Mar-25 |
Mar-26 |
|
|
2022-E |
2023-E |
2024-E |
2025-E |
2026-E |
|
Revenue |
10,647.67 |
11,218.06 |
11,819.01 |
12,452.15 |
13,119.22 |
|
COGS |
6,932.20 |
7,303.79 |
7,695.31 |
8,107.81 |
8,542.42 |
|
Gross Profit |
3,715.47 |
3,914.27 |
4,123.70 |
4,344.35 |
4,576.80 |
|
Employee Expenses |
737.72 |
777.26 |
818.93 |
862.83 |
909.08 |
|
Other Expenses |
1,565.79 |
1,649.72 |
1,738.15 |
1,831.32 |
1,929.49 |
|
EBITDA |
1,411.96 |
1,487.28 |
1,566.63 |
1,650.20 |
1,738.24 |
|
Depreciation |
414.81 |
384.94 |
361.35 |
343.18 |
329.71 |
|
EBIT |
997.15 |
1,102.34 |
1,205.27 |
1,307.02 |
1,408.52 |
|
Financial Cost |
22.75 |
25.15 |
27.50 |
29.83 |
32.14 |
|
EBT |
974.40 |
1,077.19 |
1,177.77 |
1,277.19 |
1,376.38 |
|
Tax expenses |
243.60 |
269.30 |
294.44 |
319.30 |
344.10 |
|
PAT |
730.80 |
807.89 |
883.33 |
957.90 |
1,032.29 |
-
We initiate coverage on Exide Batteries limited with a “BUY” and a 1.2 Year Target Price of ₹243.
Disclaimer: This report is only for the information of our customers Recommendations, opinions, or suggestions are given with the understanding that readers acting on this information assume all risks involved. The information provided herein is not to be construed as an offer to buy or sell securities of any kind.
- Share :


Post a Comment
|
DISCLAIMER |
This report is only for the information of our customers. Recommendations, opinions, or suggestions are given with the understanding that readers acting on this information assume all risks involved. The information provided herein is not to be construed as an offer to buy or sell securities of any kind. ATS and/or its group companies do not as assume any responsibility or liability resulting from the use of such information.