GABRIEL INDIA
Gabriel India Limited - Company Profile
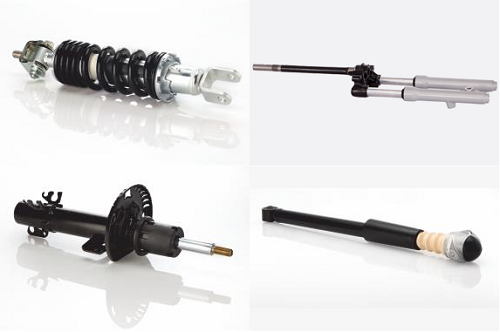
Gabriel India Limited (GIL) is a leading name in the Indian auto-component industry. Established in the year 1961, the company provides a wide range of ride control products in India, including shock absorbers, struts and front forks across every automotive segment. The company offers over 300 product models. The company provides equipment to original equipment manufacturers (OEMs), replacement and exports. Over the last 55 years, Gabriel India has established itself as a provider of innovative and proprietary products. The company commenced its operations with a single plant in Mumbai, and today has seven manufacturing plants across the country.
Gabriel India Limited - Investment Summary
|
CMP(11/9/17)(Rs) |
211.00 |
|
52 Week H/L |
222.70/99.60 |
|
Market Cap (Cr) |
3,052.43 |
|
Equity Cap (Cr) |
14.36 |
|
Face Value (Rs) |
1.00 |
|
Promoter Holding (%) |
54.63 |
|
Non-Promoter Holding (%) |
45.37 |
|
Total (%) |
100.00 |
-
Major global OEMs have made India a component sourcing hub for their global operations.
-
Product development capabilities and R&D operations are being set up.
-
Auto component manufacturers and suppliers focused on entering new vehicle segments.
-
High market share in commercial vehicles segment.
-
Strong Brand Equity in Aftermarket Segment.
Gabriel India Limited - Financial Summary
|
Particulars(Rs. Cr) |
FY13 |
FY14 |
FY15 |
FY16 |
FY17 |
|
Net Sales |
1,209.55 |
1,292.24 |
1,448.41 |
1,442.44 |
1,534.54 |
|
Total Assets |
551.87 |
587.84 |
616.38 |
671.64 |
770.06 |
|
Cost of Sales |
1,162.43 |
1,232.28 |
1,364.26 |
1,346.35 |
1,422.10 |
|
Profit after Tax |
38.14 |
42.60 |
60.02 |
75.24 |
81.62 |
|
EPS (Rs) |
2.65 |
2.97 |
4.18 |
5.24 |
5.68 |
|
Profit Margins (%) |
3.15% |
3.30% |
4.14% |
5.22% |
5.32% |
Outlook
The company’s sales grew by 6% and the Operating Profit and PAT grew by 11.4% and 8.5% respectively in the FY17. The improved profitability was due to reduction in the cost of raw materials, control of fixed expenses, better working capital and cash flow management. The company continues to deliver results on the strength of strong customer orientation, leveraging its core competencies in technology, manufacturing and supply chain efficiency. The future prospects of the company appear optimistic due to a good monsoon this year and implementation of GST. The company’s performance in Aftermarket and Exports is expected to be better due to improved focus of the company on technological enhancements.
Gabriel India Limited - Company Overview
Gabriel India Limited (GIL), ANAND Group’s flagship company, is a leading manufacturer of auto components and is one of the most recognized brands in India. Established in 1961, the company manufactures a wide range of Ride Control products, including shock absorbers, struts and front forks. The manufacturing facilities of the company are located across India in Chakan, Nashik, Hosur, Dewas, Khandsa, Parwanoo and Sanand. Four of its satellite plants are located in Malur, Aurangabad, Kumbalgodu and Manesar. The company reported a total sales of Rs.1,513.05 crores in FY17, compared to Rs. 1,426.4 crores in FY16, a growth of 6%. The company reported an EBITDA of Rs.144 crores in FY17 as compared to Rs.129.3 crores in FY16, which is a growth of 11.4%.
Gabriel India Limited - Products
Below is a list of the company’s main customers:
|
Ashok Leyland |
AMW |
Bajaj |
Daimler |
Force Motors |
Ford |
|
General Motors |
Honda |
Hyundai |
Indian Railways |
Isuzu |
Mahindra |
|
MAN |
Mando |
Maruti Suzuki |
Piaggio |
Renault |
Royal Enfield |
|
SML Isuzu |
Suzuki |
Tata Motors |
Toyota |
TVS |
UM |
|
Volkswagen |
VE Commercial |
Wheels India |
Yamaha |
|
|
Below is the summary of the company’s products and operations in OEM and aftermarkets:
|
Two Wheelers |
Passenger Cars |
Commercial vehicles and Railways |
AfterMarket |
|
Products offered |
Products offered |
Products offered |
Products offered |
|
Front Forks |
McPherson Struts |
Shock Absorbers |
Front Forks |
|
Gas and Hydraulic Shock Absorbers |
Shock Absorbers |
Cabin Dampers |
Shock absorbers for 2 & 3 wheelers, CV & PV |
|
|
Cartridges |
Seat Dampers |
Struts for passenger cars |
|
Major OEM Customers |
Major OEM Customers |
Major OEM Customers |
Front fork |
|
Atul Auto |
General Motors |
AMW Motors |
Wheel rims |
|
Bajaj Auto |
Honda Cars |
Ashok Leyland |
Gas Springs |
|
Honda Motorcycle & Scooter |
Mahindra |
Daimler |
Suspension bush kits |
|
India Yamaha Motor |
Maruti Suzuki |
Force Motors |
2 & 3 wheeler tires and tubes |
|
Mahindra 2 & 3 wheelers |
Renault |
Indian Railways |
Major Markets |
|
Piaggio |
Tata Motors |
Isuzu |
India |
|
Royal Enfield |
Toyota Kirloskar Motor |
Mahindra Truck & Bus Division |
Bangladesh |
|
Suzuki Motorcycle |
Volkswagen |
MAN Trucks |
Sri Lanka |
|
TVS Motor Company |
|
Tata Motors |
UAE & Egypt |
|
UML |
|
Volvo Eicher Commercial Vehicles |
Australia |
|
|
|
SML Isuzu |
Distribution Network |
|
Manufacturing Units |
Manufacturing Units |
Manufacturing Units |
19 Carrying and Forwarding Agents |
|
Nashik (Maharashtra) |
Khandsa (Haryana) |
Dewas (Madhya Pradesh) |
500 Dealers |
|
Hosur (Tamil Nadu) |
Chakan (Maharashtra) |
Chakan (Maharashtra) |
10,000 Retailers |
|
Parwanoo (HP) |
Sanand (Gujarat) |
Parwanoo (HP) |
|
|
Sanand (Gujarat) |
|
|
|
The company operates the following business Divisions:
-
Two & Three Wheeler Components
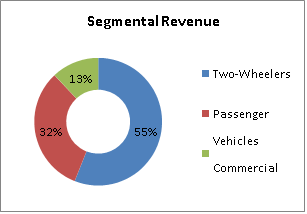
In FY17, the company’s 2 & 3 wheeler business unit accounted for 55% of the total revenues, compared to 58% in FY16. Increased focus on OEMs like TVS Motors, Honda Motorcycles, Yamaha Motors, Suzuki Motorcycles, Piaggio Vehicles and Royal Enfield are likely to bring new business as they serve new models to the market. The company inaugurated a satellite plant in Kubalgodu, Karnataka to be closer to TVS, Mysore.
-
Passenger Cars Components
In FY17, the passenger car components business unit accounted for 32% of the total revenues, compared to 31% in FY16. The division recorded a sales growth of 15.8% in FY17. Strong growth in business unit was led by new launches including Mahindra’s KUV1OO and Maruti Suzuki’s Vitara Brezza, S-Cross and Ignis. The sales also came from the growth in the volumes for exports by Renault.
-
Commercial Vehicles and Railways segment
Gabriel India is the market leader in Commercial Vehicles segment and has a good presence in Indian Railways. The Commercial Vehicles and Railways Business Unit (CVRBU) accounted for 13% of the total revenues in FY17, compared to 11% in FY16. The business unit recorded a sales growth of 12% over FY16. In FY17, the business division developed and started supplies of Linke Hoffman Busch (LHB) shock absorbers to Indian railways. The division also started supplies to Isuzu Global.
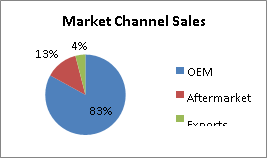
Gabriel India has a strong focus on the replacement market. The company serves both in OEM and aftermarket segments through its own brand. Gabriel India exports to all major markets in North America, Europe, Australia and Asia-Pacific regions. The company has been leveraging its relationship with global OEMs to expand its global operations. The company’s exports increased from Rs.58.6 crores in FY16 to Rs.67.7 crores in FY17, recording an annual growth of 15%. In the 2-Wheeler segment, the Company has gained business from Mahindra Peugeot for the Metropolis vehicle, and has entered the market for new models in Colombia. It has started commercial supplies to ISUZU for Thailand and Indonesia in Commercial Vehicles Segment. In the Aftermarket segment, the Company has ventured into new markets, such as Honduras, Guatemala, and Kenya.
Key Ratios
|
Key Ratios |
FY13 |
FY14 |
FY15 |
FY16 |
FY17 |
|
Debt-Equity Ratio |
0.31 |
0.23 |
0.04 |
0.03 |
0.02 |
|
Current Ratio |
1.00 |
1.02 |
1.21 |
1.41 |
1.59 |
|
Inventory Turnover Ratio (x) |
10.84 |
11.01 |
12.88 |
12.99 |
11.78 |
|
Total Asset Turnover Ratio (%) |
218.40 |
218.87 |
234.28 |
214.13 |
198.57 |
|
EBITDA Margin (%) |
6.9 |
7.0 |
8.1 |
9.0 |
9.4 |
|
Net Profit Margin (%) |
3.16 |
3.31 |
4.15 |
5.23 |
5.33 |
|
ROCE (%) |
16.4 |
18.8 |
25.7 |
26.8 |
26.5 |
|
RONW (%) |
14.84 |
14.93 |
18.44 |
19.80 |
18.11 |
|
Payout (%) |
28.24 |
28.66 |
25.12 |
22.90 |
7.92 |
|
Price/Book Value (x) |
1.07 |
1.49 |
3.79 |
3.39 |
3.87 |
|
EV/EBITDA (x) |
3.86 |
4.96 |
10.24 |
9.55 |
11.36 |
|
Market Cap/Sales |
0.23 |
0.33 |
0.85 |
0.89 |
1.14 |
The company has managed to reduce the debt and the interest expenses over the years. The current ratio has been improving which would enable the company to meet its short term expenses more easily. The company’s operating and profit margins have improved. The profit margins have improved from 3.15% in FY13 to 5.32% in FY17. The return on capital employed has increased from 16.4% in FY13 to 26.50% in FY17. Out of the profits of Rs.81.6 crores, the company has paid dividends of Rs.17 crores, and invested Rs.46 crores in fixed deposits with a maturity of more than 3 months.
Management Profile
|
Key Personnel |
Designation & Experience |
Auditors |
|
Anjali Singh |
Executive Chairman |
B.K. Khare & Co. |
|
Rajendran Arunachalam |
Chief Financial officer |
|
|
Nilesh Jain |
Compliance Officer |
|
|
Manoj Kolhatkar |
Managing Director |
|
|
Rohit Philip |
Director |
|
Investment Rationale
-
Major global OEMs have made India a component sourcing hub for their global operations
Several global Tier-I suppliers have also announced plans to increase procurement from Indian companies. The growth of global OEMs sourcing from India and increased indigenization of Indian OEMs is turning the country into a preferred designing and manufacturing base. Many Indian firms like Gabriel India which specialize in only one market segment or product market are looking forward to diversify horizontally in all segments including 2-wheelers, passenger cars and commercial vehicles. India’s projected production is 8.7 million passenger vehicles per year by FY20. This could be an opportunity for companies like Gabriel India to adapt global designs and develop new products.
-
Product development capabilities and R&D operations are being set up
Increased investments in R&D operations and laboratories are being made. Activities such as analysis, simulation and engineering animations are being conducted in India. This could be an opportunity for Gabriel India to improve its technological capabilities to produce higher quality products in India for OEMs, Aftermarket and Exports.
-
Auto component manufacturers and suppliers focused on entering new vehicle segments
Auto companies are stepping up their product development capabilities in order to have the best chance of capturing growth opportunity. Many MNC’s like Ford, Hyundai, Toyota and GM are launching new vehicle models due to their earlier success in the Indian market. To capitalize on this opportunity, auto-component suppliers are focused on entering new vehicle segments and manufacturing new products with higher margins.
-
High market share in Shock Absorbers, Struts and Font Forks
The company has a very high market share of close to 80% in commercial vehicles segment. The company also has a significant market share of 25% in the 2-wheelers and passenger cars segment. The automotive industry in India is growing at a compounded rate of 5.4% per year. This augurs well with growth plans of Gabriel India in the auto-components sector. The company could diversify into other products to improve margins and profitability.
-
Strong Brand Equity in Aftermarket Segment
Due to the cyclical nature of auto industry, the OEM dependent auto ancillary companies are exposed to high business uncertainties. Therefore, diversifying the business is of utmost importance for Gabriel India to sustain cyclical downturns. Unlike other auto ancillary companies, Gabriel India generates revenues across all auto segments and the company has strong presence in OEM, Aftermarkets and Exports. The company has strong brand equity in the aftermarket segment. Both two-wheelers and passenger vehicle segments account for significant portions of aftermarket revenues for the company. In the aftermarket segment, Gabriel India is present through 375 dealers and 6000 retailers. In order to improve revenues, the company has been launching new products like radiator coolants, suspension bush kits, front fork oils, gas springs and wheel rims.
Industry Overview
The auto-components industry accounts for 7% of India’s GDP and employs 19 million people. India is expected to become the 4th largest automobiles manufacturer globally by 2020 after China, US and Japan. The auto-components industry is also expected to become the 3rd largest in the world by 2025. The Indian auto-components industry is expected to register a turnover of $100 billion by 2020 backed by strong exports ranging between $80-100 billion by 2026. The growth of global OEM sourcing from India and increased indigenization of Indian OEMs is turning the country into a preferable designing and manufacturing base. Over the last decade, the automotive components industry has registered a CAGR of 14% to reach $39 billion in FY17. The exports have also grown at a CAGR of 14% to reach $10.8 billion. The continued support from the Government of India through Automotive mission plan 2016-26 which aims to fourfold the growth of the sector and reduction in taxes on motor vehicles is likely to increase the demand for auto components. The government also allows 100% FDI through automatic route for auto components. The auto components market in India is highly organized with 85% of the market falling under the organized sector, which is controlled by 700 companies. The remaining 15% is the unorganized sector where 10,000 companies exist.
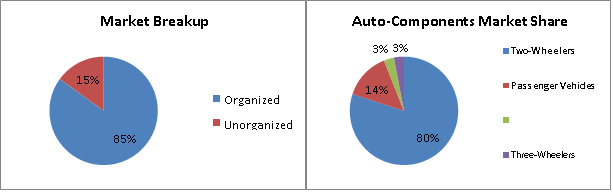
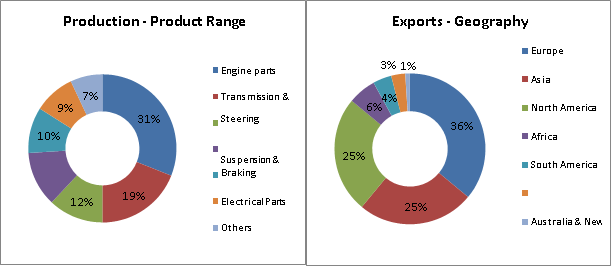
Below is the break-up of the auto components sector in India.
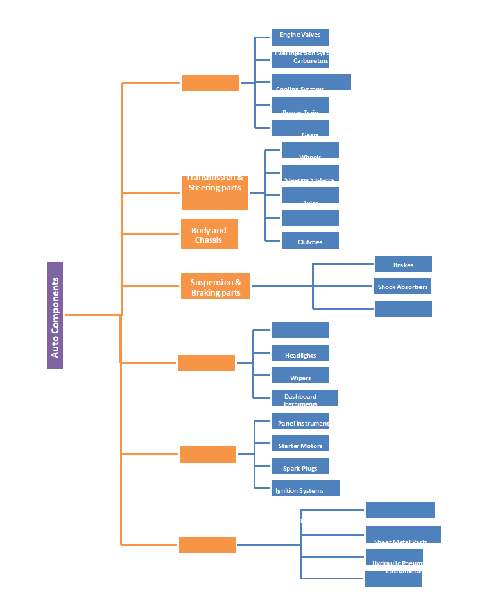
India’s projected production is around 8.7 million passenger vehicles (mostly compact cars) per year by FY20. Many companies like Ford, Hyundai, Toyota and GM are launching new vehicle models due to their earlier success in the Indian market. To make use of this growth opportunity, many global component suppliers like Bosch Chassis Systems and Tenneco & Faurecia have established R&D facilities in India to adapt global designs to the Indian market and develop new products. This robust growth in the domestic automotive industry, shift towards technological enhancements, R&D facilities and growth in disposable incomes of people has all contributed to the overall growth of the auto components sector. There are many opportunities to be captured in the components market.
The Indian automotive industry produced 25.4 million vehicles in FY17 compared to 24.0 million vehicles in FY16, recording a growth of 5.41%. In FY17, India retained its position as world’s most dynamic 2- wheeler market. The segment registered a sales growth of 6.89%, wherein scooters, motorcycles and mopeds grew by 11.39%, 3.68% and 23.02% respectively. However, 3-wheeler sales declined by 4.93% in FY17, compared to FY16. The export of 2-wheelers and 3-wheelers declined by 5.78% and 32.77% respectively. Passenger vehicle sales in India grew by 9.23% in FY17 compared to previous year. For the same period, passenger cars, utility vehicles and vans grew by 3.85%, 29.91% and 2.37% respectively. Passenger vehicles exports registered a growth of 16.20%. The commercial vehicles segment recorded a growth of 4.16% in FY17. Medium & Heavy Commercial Vehicles (M&HCVs) grew by 0.04%, whereas Light Commercial Vehicles (LCV) grew by 7.41%.
Raw Materials
Plastics: Petroleum and petroleum byproducts are the main raw materials of plastic components in cars. Chemical companies transform petroleum byproducts into plastic. Plastic comprises roughly 50% of car parts (other than body and chassis). Parts like handles, air vents, inner body, dashboard and airbags are made from plastics. The versatility, durability, and lightweight character of plastics make them an ideal material for various auto parts.
Aluminium: Aluminium is primarily being used in car manufacturing because of its excellent thermal conductivity, malleability and light-weight nature. Aluminium accounts for 15% of the total car components of the car including engine blocks and wheels.
Copper: Copper has excellent electrical conductivity and ductility. Copper is mainly used in electrical wiring and other components of the car.
Rubber: Tires are one of the most important components of a car. Rubber is mainly used to manufacture tires. Additionally, rubber is also used in belts, hoses and seals which are critical to functioning of a car’s engine. Like plastic, rubber is also durable and easily molded into different shapes. Approximately 80% of the world’s rubber production is consumed by the auto industry.
Quartz: Quartz along with sand is used to make glass and other critical electronic components of the car such as microprocessors, engine control and braking control units.
Consolidated Balance Sheet
|
FY13 |
FY14 |
FY15 |
FY16 |
FY17 |
|
|
EQUITIES AND LIABILITIES |
|||||
|
SHAREHOLDER'S FUNDS |
|||||
|
Equity Share Capital |
14.37 |
14.37 |
14.37 |
14.37 |
14.36 |
|
Total Share Capital |
14.37 |
14.37 |
14.37 |
14.37 |
14.36 |
|
Reserves and Surplus |
242.49 |
270.81 |
311.07 |
365.56 |
436.15 |
|
Total Reserves and Surplus |
242.49 |
270.81 |
311.07 |
365.56 |
436.15 |
|
Total Shareholders’ Funds |
256.86 |
285.17 |
325.43 |
379.93 |
450.52 |
|
NON-CURRENT LIABILITIES |
|||||
|
Long Term Borrowings |
16.39 |
9.57 |
5.84 |
8.06 |
7.76 |
|
Deferred Tax Liabilities [Net] |
11.05 |
9.55 |
10.49 |
10.43 |
15.94 |
|
Other Long Term Liabilities |
3.65 |
0 |
0 |
0 |
0 |
|
Long Term Provisions |
5.67 |
4.09 |
9.31 |
9.23 |
9.73 |
|
Total Non-Current Liabilities |
36.76 |
23.21 |
25.64 |
27.72 |
33.43 |
|
CURRENT LIABILITIES |
|||||
|
Short Term Borrowings |
49.31 |
46.97 |
0 |
0 |
0 |
|
Trade Payables |
137.35 |
157.88 |
190.73 |
178.09 |
214.67 |
|
Other Current Liabilities |
51.8 |
45.46 |
41.07 |
49.7 |
54.37 |
|
Short Term Provisions |
19.79 |
29.15 |
33.51 |
36.21 |
17.08 |
|
Total Current Liabilities |
258.25 |
279.46 |
265.31 |
264 |
286.12 |
|
Total Capital And Liabilities |
551.87 |
587.84 |
616.38 |
671.64 |
770.06 |
|
ASSETS |
|||||
|
NON-CURRENT ASSETS |
|||||
|
Tangible Assets |
249.86 |
263.6 |
265.54 |
267.36 |
283.25 |
|
Intangible Assets |
5.57 |
3.6 |
2.13 |
5.08 |
5.3 |
|
Capital Work-In-Progress |
6.39 |
12.46 |
3.1 |
2.21 |
1.78 |
|
Fixed Assets |
261.82 |
279.65 |
270.76 |
274.65 |
290.33 |
|
Non-Current Investments |
0.02 |
0.02 |
0.02 |
0.02 |
0.02 |
|
Long Term Loans And Advances |
30.61 |
23.23 |
22.64 |
23.61 |
25.08 |
|
Total Non-Current Assets |
292.44 |
302.91 |
295.82 |
299.69 |
315.43 |
|
CURRENT ASSETS |
|||||
|
Current Investments |
0 |
0 |
0 |
0 |
28 |
|
Inventories |
111.18 |
116.82 |
112.14 |
110.74 |
129.8 |
|
Trade Receivables |
117.02 |
136.08 |
172.34 |
192.37 |
211.79 |
|
Cash And Cash Equivalents |
6.96 |
4.88 |
3.89 |
36.24 |
52.75 |
|
Short Term Loans And Advances |
23.75 |
27.14 |
32.1 |
29.02 |
28.03 |
|
Other Current Assets |
0.52 |
0.02 |
0.11 |
3.58 |
4.27 |
|
Total Current Assets |
259.42 |
284.93 |
320.56 |
371.96 |
454.63 |
|
Total Assets |
551.87 |
587.84 |
616.38 |
671.64 |
770.06 |
Consolidated Income Statement
|
FY13 |
FY14 |
FY15 |
FY16 |
FY17 |
|
|
INCOME |
|||||
|
Revenue From Operations [Gross] |
1,321.85 |
1,407.97 |
1,580.24 |
1,576.46 |
1,667.52 |
|
Less: Excise/Service Tax/Other Levies |
125.82 |
133.44 |
150.4 |
150.05 |
154.47 |
|
Revenue From Operations [Net] |
1,196.03 |
1,274.52 |
1,429.84 |
1,426.42 |
1,513.06 |
|
Other Operating Revenues |
9.29 |
12.09 |
14.26 |
11.81 |
16.07 |
|
Total Operating Revenues |
1,205.32 |
1,286.61 |
1,444.10 |
1,438.23 |
1,529.13 |
|
Other Income |
4.23 |
5.63 |
4.31 |
4.21 |
5.41 |
|
Total Revenue |
1,209.55 |
1,292.24 |
1,448.41 |
1,442.44 |
1,534.54 |
|
EXPENSES |
|||||
|
Cost Of Materials Consumed |
880.03 |
932.17 |
1,031.92 |
1,016.24 |
1,072.43 |
|
Purchase Of Stock-In Trade |
4.09 |
4.43 |
10.07 |
13.3 |
20.14 |
|
Changes In Inventories Of FG,WIP And Stock-In Trade |
-8.66 |
-10 |
1.2 |
-1.29 |
-8.13 |
|
Employee Benefit Expenses |
90.72 |
98.24 |
107.55 |
115.04 |
127.88 |
|
Finance Costs |
12.19 |
9 |
5.48 |
2.48 |
1.66 |
|
Depreciation And Amortization Expenses |
27.28 |
27.07 |
31.13 |
33.19 |
35.33 |
|
Other Expenses |
156.79 |
171.37 |
176.92 |
167.4 |
172.8 |
|
Total Expenses |
1,162.43 |
1,232.28 |
1,364.26 |
1,346.35 |
1,422.10 |
|
Profit/Loss Before Exceptional, Extraordinary Items And Tax |
47.12 |
59.96 |
84.15 |
96.09 |
112.44 |
|
Exceptional Items |
-5.94 |
-4.2 |
-0.6 |
-0.6 |
-1.63 |
|
Profit/Loss Before Tax |
41.18 |
55.76 |
83.55 |
95.49 |
110.81 |
|
Tax Expenses-Continued Operations |
|||||
|
Current Tax |
8.42 |
11.9 |
20.79 |
20.47 |
23.64 |
|
Less: MAT Credit Entitlement |
1.07 |
0.61 |
0 |
0 |
0 |
|
Deferred Tax |
-2.29 |
-0.49 |
-1.45 |
0.49 |
3.91 |
|
Tax For Earlier Years |
-2.02 |
2.35 |
4.18 |
-0.71 |
1.64 |
|
Total Tax Expenses |
3.05 |
13.16 |
23.52 |
20.26 |
29.19 |
|
Profit/Loss After Tax And Before Extraordinary Items |
38.14 |
42.6 |
60.02 |
75.24 |
81.62 |
|
Profit/Loss From Continuing Operations |
38.14 |
42.6 |
60.02 |
75.24 |
81.62 |
|
Profit/Loss For The Period |
38.14 |
42.6 |
60.02 |
75.24 |
81.62 |
|
OTHER ADDITIONAL INFORMATION |
|||||
|
EARNINGS PER SHARE |
|||||
|
Basic EPS (Rs.) |
2.65 |
2.97 |
4.18 |
5.24 |
5.68 |
|
Diluted EPS (Rs.) |
2.65 |
2.97 |
4.18 |
5.24 |
5.68 |
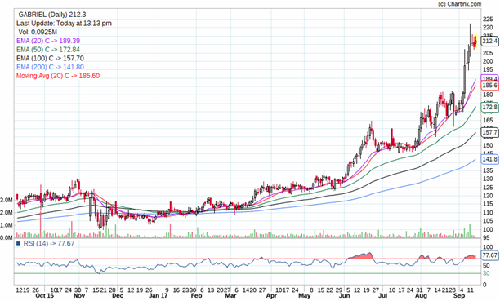
Stock Performance Chart
- Share :


Post a Comment
|
DISCLAIMER |
This report is only for the information of our customers. Recommendations, opinions, or suggestions are given with the understanding that readers acting on this information assume all risks involved. The information provided herein is not to be construed as an offer to buy or sell securities of any kind. ATS and/or its group companies do not as assume any responsibility or liability resulting from the use of such information.