Hero MotorCop Limited Research Report
|
Industry |
Market Price |
Recommendation |
Target |
Time Horizon |
|
Auto |
2286.30 |
Buy |
2690.84 |
12 months |
Q3 FY 2022 Review
Hero MotorCop Ltd. (HMCL) Q3’FY22 reported net revenue Of Rs.7,883 Cr, declining by 7% QoQ Compared to Rs. 8453 cr in Q2’FY22, led by de-growth in volume by 9%. The Company EBITDA stood at Rs. 960 cr in Q3’FY22 is declined by 10% as compared to Rs. 1066 Cr reported in Q2’FY22. EBIT and Net Profit reported Rs. 911 cr and Rs.686 cr in Q3’FY22 compared to Rs.1053 cr and Rs.794 In Q2’FY22 which has shown de-growth in QoQ by 7% & 13% respectively.
Hero MotorCop Limited - Investment Summary
|
CMP (₹) |
2269.30 |
|
52 Week H/L |
3090/2146.85 |
|
Market Cap (crores) |
45306 |
|
Face Value (₹) |
2.00 |
|
Promoter Holding (%) |
34.76 |
|
Non-Promoter Holding (%) |
65.25 |
|
Total (%) |
100.00 |
|
Book Value |
₹202.95 |
|
EPS TTM |
₹34.03 |
Hero MotorCop Limited - Overview
-
Hero Motorcop (HMCL) is the world’s largest 2-W manufacturer by volume, with a domestic market share at 34.5% today. Its popular model includes Splendor, Passion, Glamour etc.
-
Out of 34.5%, the market penetration of HMCL in rural areas is 53%; but only 48% of sales are generated from rural regions.
-
HMCL is virtually debt-free and maintains a healthy dividend payout ratio of more than 50% on an average every year.
-
EV development continues to progress through its investment and partnership with Ather Energy and Gogoro Inc, followed by a collaboration with Harley Davidson is also in progress for premium motorcycle segment.
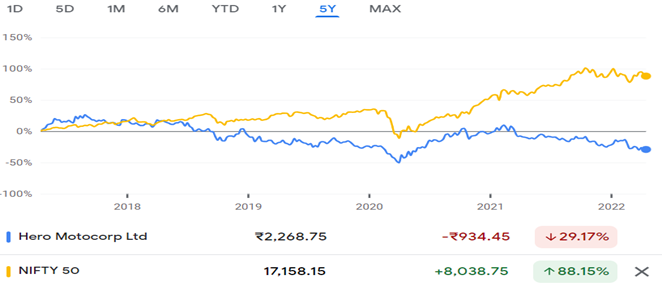
Hero MotorCop Limited - Relative Performance
|
Beta:0.93 |
Alpha:-22% |
Hero MotoCorp Limited - Quarterly Summary
|
Quarterly (INR in crores) |
Dec-21 |
Sep-21 |
Jun-21 |
Mar-21 |
Dec-20 |
|
Revenue from Operations |
7,883 |
8,453 |
5,487 |
8,685 |
9,775 |
|
Other income |
121 |
156 |
138 |
87 |
202 |
|
Total Income |
8,004 |
8,610 |
5,625 |
8,773 |
9,978 |
|
Total Expenditure |
7,087 |
7,550 |
5,135 |
7,637 |
8,531 |
|
EBIT |
917 |
1059 |
490 |
1135 |
1446 |
|
Finance cost |
6 |
6 |
6 |
6 |
4 |
|
EBT |
911 |
1053 |
484 |
1129 |
1442 |
|
Tax Expenses |
224 |
258 |
118 |
264 |
357 |
|
PAT |
686 |
794 |
365 |
364 |
1084 |
Business Overview
-
Hero MotoCorp Limited, formerly (Hero Honda), is an Indian multinational motorcycle and scooter manufacturer headquartered in New Delhi. The company is the largest two-wheeler manufacturer globally and also in India, where it has a market share of about 34.5% in the two-wheeler industry.
-
By December 2010, the board of directors of the Hero Honda Group had decided to terminate the joint venture between Hero Group of India and Honda of Japan in a phased manner. The Hero Group would buy out the 26% stake of the Honda in JV Hero Honda.
-
The company’s name was changed from Hero Honda Motors Limited to Hero MotoCorp Limited on 29 July 2011.•
-
In July 2013, HMC acquired 49.2% shareholding in Erik Buell Racing, a motorcycle sport company that produced street and racing motorcycles based in East Troy, Wisconsin, United States. EBR filed for bankruptcy in 2015,] and Hero MotoCorp proceeded to acquire certain assets for ₹18.2 crores.
-
HMCL business segments include:
-
Motorcycle Segments:
-
Xtreme 200S, Xtreme 160R.
-
Xpulse 200T, Xpulse 200 4V, Xpulse 200.
-
Splendor Ismart, Splendor+, New Super Splendor, Passion pro.
-
Glamour, New Glamour, Glamour XTec.
-
-
Scooter Segment:
-
Pleasure+ XTEC, New Maestro Edge 125, New Maestro Edge 110.
-
Destini 125 XTEC, Destini 125.
-
-
|
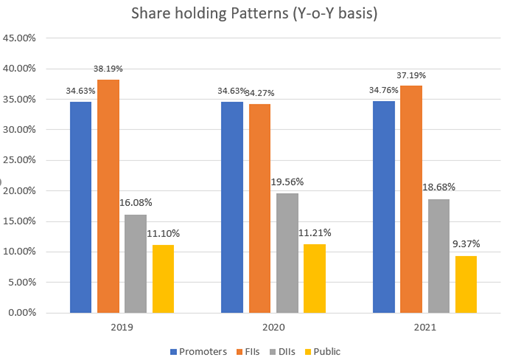
Share Holder Pattern (%) |
2019 |
2020 |
2021 |
|
Promoters |
34.63% |
34.63% |
34.76% |
|
FIIs |
38.19% |
34.27% |
37.19% |
|
DIIs |
16.08% |
19.56% |
18.68% |
|
Public |
11.10% |
11.21% |
9.37% |
Ratio Analysis:
|
|
Mar-18 |
Mar-19 |
Mar-20 |
Mar-21 |
|
Profitability Ratio |
|
|
|
|
|
EBITDA Margin |
17% |
16% |
16% |
15% |
|
EBIT Margin |
16% |
15% |
13% |
13% |
|
Pre-Tax Margin |
16% |
15% |
13% |
12% |
|
Net Profit Margin |
11% |
10% |
12% |
9% |
|
|
|
|
|
|
|
Return on Investment |
|
|
|
|
|
Return on Asset – ROA |
21% |
21% |
18% |
17% |
|
Return on Equity – ROE |
31% |
30% |
25% |
25% |
|
|
|
|
|
|
|
Liquidity Ratio |
|
|
|
|
|
Current ratio (x) |
1.81 |
2.00 |
1.90 |
2.02 |
|
Quick Ratio |
0.39 |
0.35 |
0.67 |
0.42 |
|
|
|
|
|
|
|
Turnover Ratio |
|
|
|
|
|
No .of Days of Receivables |
15.49 |
28.91 |
18.40 |
26.34 |
|
Working Capital Turnover |
7.43 |
8.65 |
6.86 |
6.47 |
|
Average Day’s Sales |
92.12 |
94.96 |
82.15 |
86.35 |
|
Asset Turnover |
2.16 |
2.15 |
1.87 |
1.52 |
|
|
|
|
|
|
|
Solvency Ratio |
|
|
|
|
|
Debt to Equity |
0.003 |
0.006 |
0.014 |
0.011 |
Hero MotorCop Limited - Profit and Loss Statement (Consolidated)
|
|
Mar-18 |
Mar-19 |
Mar-20 |
Mar-21 |
|
Revenue |
33,100 |
33,972 |
29,255 |
30,959 |
|
Other income |
523 |
686 |
730 |
557 |
|
Total Revenue |
33,624 |
34658 |
29,985 |
31,517 |
|
Cost of Goods Sold |
21,885 |
23,444 |
19,830 |
21,743 |
|
Gross Profit |
11,738 |
11,214 |
10,154 |
9,773 |
|
Excise Duty |
642.57 |
1.41 |
1.35 |
- |
|
Employee benefit expense |
1,583 |
1,778 |
1,889 |
1,951 |
|
Other Expenses |
3,663 |
3,729 |
3,472 |
3,165 |
|
EBITDA |
5,848 |
5,705 |
4,791 |
4,657 |
|
Depreciation and amortisation expenses |
574 |
624 |
845 |
715 |
|
EBIT |
5,273 |
5,043 |
3,899 |
3,895 |
|
Finance costs |
30 |
37 |
46 |
46 |
|
EBT Before exceptional item |
5,242 |
5,043 |
3,899 |
3,895 |
|
Share net profit/(loss) from associates item and tax |
49 |
60 |
34 |
46 |
|
Gain on dilution of interest in an associate |
|
|
|
|
|
EBT before exceptional items |
5,292 |
5,104 |
3,933 |
3,849 |
|
Exceptional items |
|
|
|
677 |
|
Profit before tax |
5,292 |
5,104 |
3933 |
4,611 |
|
Income Tax Expense |
1,569 |
1,637 |
951 |
913 |
|
Profit after Tax |
3,722 |
3,466 |
3,659 |
2,936 |
|
EPS |
|
|
|
|
|
Basic |
186 |
172 |
182 |
149 |
|
Diluted |
186 |
172 |
182 |
149 |
|
Number of shares |
|
|
|
|
|
Basic |
20 |
20 |
20 |
20 |
|
Diluted |
20 |
20 |
20 |
20 |
Hero MotorCop Limited - Cash Flow Statement
|
|
Mar-18 |
Mar-19 |
Mar-20 |
Mar-21 |
|
Net Profit Before Tax |
3722 |
3466 |
3659 |
2936 |
|
Net Cash from Operating Activities |
4017 |
1032 |
5518 |
4110 |
|
Net Cash Used for Investing Activities |
-1858 |
1297 |
-2819 |
-2289 |
|
Net Cash From (Used For) Financing Activities |
-2102 |
-2252 |
-2601 |
-1851 |
|
Net Increase in Cash and Cash Equivalents |
56 |
77 |
97 |
30 |
|
Cash And Cash Equivalents at The Beginning of The Year |
74 |
130 |
208 |
305 |
|
Cash And Cash Equivalents at The End of Year |
130 |
208 |
305 |
274 |
Hero MotorCop Limited - Balance Sheet (Consolidated)
|
Mar-18 Mar-19 Mar-20 Mar-21 |
||||
|
Assets |
|
|
|
|
|
Non-Current Assets: |
|
|
|
|
|
Property, Plant & Equipment |
4,771 |
4,792 |
5,786 |
5,550 |
|
Capital WIP |
239 |
384 |
204 |
236 |
|
Right of Use of Assets |
|
|
518 |
511 |
|
Intangible Assets |
189 |
159 |
167 |
318 |
|
Other Intangible Assets |
367 |
406 |
402 |
27,930 |
|
Intangible Assets under development |
116 |
187 |
186 |
258 |
|
Equity accounted investment in associates |
1,159 |
1,705 |
2,098 |
2,407 |
Hero MotorCop Limited - Financial Assets
|
Investments |
918 |
1,234 |
1,551 |
1,948 |
|
Loans |
45 |
60 |
67 |
52 |
|
Other Financial Assets |
|
33 |
|
|
|
Non-Current Assets (Net) |
|
|
|
|
|
Deferred Tax Assets (Net) |
394 |
855 |
321 |
378 |
|
Other Non-Current Assets |
559 |
676 |
121 |
62 |
|
Total Non-Current Assets |
8,394 |
10,091 |
11,024 |
11,725 |
|
Current Assets |
|
|
|
|
|
Inventories |
962 |
1,249 |
1,282 |
1,789 |
|
Financial Assets |
|
|
|
|
|
Investments |
5,591 |
3,173 |
4,709 |
6,225 |
|
Loans |
28 |
25 |
23 |
239 |
|
Trade Receivables |
1,426 |
2,745 |
1,511 |
2,274 |
|
Cash And Cash Equivalents |
130 |
208 |
305 |
274 |
|
Bank Balances Other Than Cash and Cash Equivalents |
106 |
95 |
130 |
121 |
|
Other |
543 |
654 |
364 |
365 |
|
Other Current Assets |
212 |
261 |
322 |
279 |
|
Total Assets |
17,396 |
18,504 |
19,674 |
23,096 |
|
|
|
|
|
|
|
Equities & Liabilities |
|
|
|
|
|
Equity |
|
|
|
|
|
Equity Share Capital |
39 |
39 |
39 |
39 |
|
Other Equity |
11,931 |
13,080 |
14,366 |
15,376 |
|
Equity Attributable to Owners of The Company |
11,971 |
13,120 |
14,406 |
15,416 |
|
Non-Controlling Interests |
93 |
116 |
140 |
143 |
|
Total Equity |
12,064 |
13,236 |
14,546 |
15,559 |
|
Liabilities |
|
|
|
|
|
Non-Current Liabilities |
|
|
|
|
|
Financial Liabilities |
|
|
|
|
|
Borrowing |
149 |
124 |
44 |
45 |
|
Provisions |
119 |
120 |
123 |
175 |
|
Other financial liabilities |
- |
- |
- |
146 |
|
Deferred Tax Liabilities |
581 |
612 |
472 |
452 |
|
Lease liabilities |
- |
- |
207 |
213 |
|
Total Non-Current Liabilities |
850 |
858 |
848 |
1,031 |
|
Current Liabilities |
|
|
|
|
|
Financial Liabilities |
|
|
|
|
|
Borrowings |
75 |
183 |
165 |
285 |
|
Trade Payables |
3,375 |
3,438 |
3,127 |
5,264 |
|
Dues to Micro and Small Enterprises |
- |
- |
- |
67 |
|
Others financial liabilities |
208 |
226 |
260 |
179 |
|
Lease liabilities |
- |
- |
32 |
29 |
|
Other Current Liabilities |
764 |
500 |
531 |
570 |
|
Provisions |
60 |
59 |
159 |
175 |
|
Total Current Liabilities |
4,481 |
4,409 |
4,279 |
6,504 |
|
Total Equity and Liabilities |
17,396 |
18,504 |
19,674 |
23,096 |
Industry Overview
-
Aggregate revenues in our OEM coverage are expected to grow by 10% Q-o-Q, led by volume and price hikes.
-
Commodity inflation is greatest concern viz aluminium, lead and copper increased by 57%,18% and 16%.
-
The Russia-Ukraine war situation will impact margins over the next quarter as well.
-
The non-performing 2W segment is currently impacted by rural distress and higher ownership cost amidst soaring fuel prices. However, the company expects sales volume in rural areas would witness an increase, as expectations are high for Rabi harvest, monsoons and the upcoming wedding season.
Concall Overview
-
The key highlight of the concall was volume decline in Q3’FY22, and the reason were:
-
COVID second wave.
-
Weak demand in the festive season.
-
-
HMCL management expected a strong bounce back in demand due to:
-
Economic Resiliency,
-
Opening of Schools and College and
-
Healthy Rabi Crop Season.
-
-
Hero FinCorp has recently raised Rs.2000 Cr, which will help them to double Its AUM from Rs.26000cr, and management also noted that retail financing has improved.
-
HMCL has declared an interim dividend of Rs. 60 per share.
-
With the new two new motorcycle launches, Xtreme 160 R and the popular Xpulse 4 company expects good sales of these two new launches.
-
JV with Gogoro will be solely for HMCL.
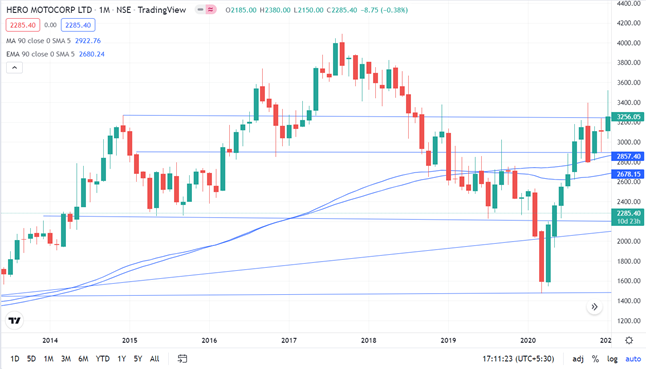
Hero MotorCop Limited - Technical Analysis
-
Stock is trading below EMA 90 and MA 90 indicators, with a strong support level of ₹ 2285 and a resistance level at ₹2857.
-
The stock can consolidate at the current level, so one accumulate at current market price .
Recommendation Rationale
-
HMCL net revenue will grow at a CAGR of 7% with strong economic growth and recovery in sales volume in the upcoming Quarter, followed by a partnership with Ather Energy, Gogoro INC and Harley Davidson will help dominate the EV segment & provide premium bikes.
-
The Company EBITDA & Net income will be resilient in the coming quarter, and its financial health will remain robust.
-
The company is virtually debt-free: healthy dividend payout ratio (>50%).
-
We believe HMCL operating leverage benefits, price hikes and cost-saving under the company.
-
Leap-ll programme would result in margin improvement.
-
The strong branding, pricing power, cost-saving program, experienced management, and extensive distribution Network will help the company maintain its market stake.
-
We maintain a BUY recommendation with a target price of Rs.2690.84, implying an 18% upside, with a reasonable valuation, While Alpha for this stock has under-performed as compared to benchmark Nifty50, HMCL is expected to strong rebound in volume in FY23, as normalization of the economy and strong recovery in Rural areas.
Valuation & Outlook
-
Partnership with Ather Energy, Gogoro INC and Harley Davidson will help to grow in EV Market and premium bike segments.
-
HMCL has increased the price of Rs. 1000 in Q3FY22 and Rs.500 in Jan 22, would offset immense Material cost pressure.
-
FY-2022 results could get impacted due to the increasing inflation, and its impact can be even seen in Q1FY2023.
-
HMCL Net revenue is expected to grow at a CAGR of 7%, and Export is expected to recover, EBITDA will grow at a CAGR of 14% during Financial year FY22E-FY26E, so margin will remain resilient. We have taken data for the last five years (2017-2021) and forecasted revenue for FY 2022-2026. Revenue growth is assumed to be 4.39%.
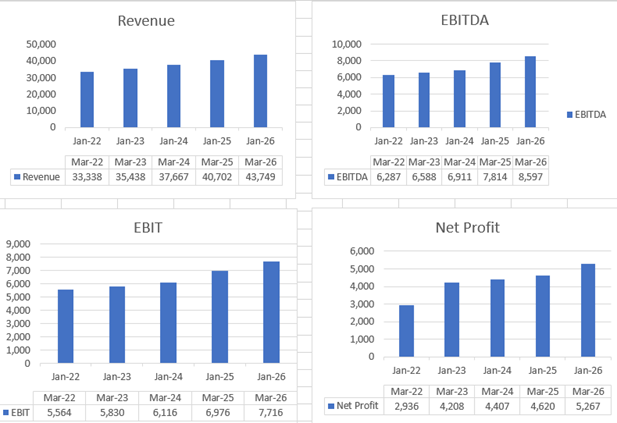
Estimated Financials
|
|
Mar-22 |
Mar-23 |
Mar-24 |
Mar-25 |
Mar-26 |
|
|
2022-E |
2023-E |
2024-E |
2025-E |
2026-E |
|
Revenue |
33,338 |
35,438 |
37,667 |
40,702 |
43,749 |
|
EBITDA |
6,287 |
6,588 |
6,911 |
7,814 |
8,597 |
|
EBIT |
5,564 |
5,830 |
6,116 |
6,976 |
7,716 |
|
Net Profit |
2,936 |
4,208 |
4,407 |
4,620 |
5,267 |
|
EPS |
211 |
221 |
231 |
264 |
292 |
|
P/E Ratio |
10.80 |
10.31 |
9.84 |
8.63 |
7.68 |
|
ROE(%) |
18% |
23% |
22% |
21% |
21% |
|
ROA(%) |
13% |
16% |
15% |
15% |
15% |
|
Current Ratios |
1.75 |
2.37 |
2.03 |
2.63 |
2.21 |
|
Debt/Equity (X) |
0.018 |
0.016 |
0.015 |
0.013 |
0.012 |
Disclaimer: This report is only for the information of our customers Recommendations, opinions, or suggestions are given with the understanding that readers acting on this information assume all risks involved. The information provided herein is not to be construed as an offer to buy or sell securities of any kind.
- Share :


Post a Comment
|
DISCLAIMER |
This report is only for the information of our customers. Recommendations, opinions, or suggestions are given with the understanding that readers acting on this information assume all risks involved. The information provided herein is not to be construed as an offer to buy or sell securities of any kind. ATS and/or its group companies do not as assume any responsibility or liability resulting from the use of such information.