Hindustan Petroleum Corporation Limited Research Report
|
Industry |
Market Price |
Recommendation |
Target |
Time Horizon |
|
Oil and Gas |
237.60 |
295 |
Buy |
1 Year |
Q4 FY 2022 Review
Hindustan Petroleum Corporation Limited reported net revenue of ₹1,05,003.85 crores for the quarter ended March 31, 2022, compared to ₹84,965.89 crores for March 31, 2021. EBIT and Profit After Tax were ₹2,276.12 crores and ₹2018.45 crores for the quarter ended 31 March 2022, as compared to ₹4,261.98 crores and ₹3,060.70 crores during the corresponding quarter of the previous year.
Hindustan Petroleum Corporation Limited - Investment Summary
|
CMP (₹) |
237.60 |
|
52 Week H/L |
355/206 |
|
Market Cap (crores) |
34,166 |
|
Face Value (₹) |
10.00 |
|
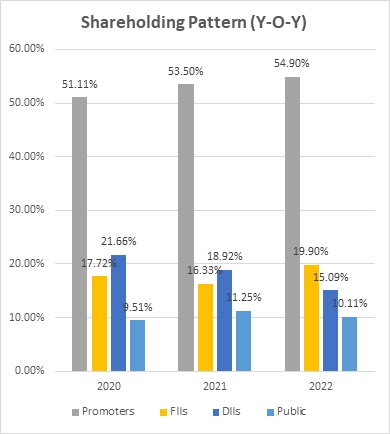
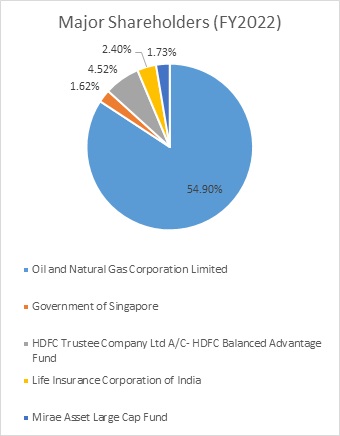
Promoter Holding (%) |
54.90 |
|
Non-Promoter Holding (%) |
45.10 |
|
Total (%) |
100.00 |
|
Book Value |
₹292 |
|
EPS TTM |
₹51.36 |
Hindustan Petroleum Corporation Limited – Overview
-
Hindustan Petroleum Corporation Ltd is primarily involved in the refining of crude oil and marketing petroleum products, the production of hydrocarbons, and the management of E&P blocks.
-
HPCL is the country's largest base oil producer, capable of producing Group I, Group II, and Group III base oils.
-
HPCL has a refining capacity share of 10.8%, and owns 21% of India’s petroleum product pipelines.
-
The company has been assigned AAA/Stable (Reaffirmed) credit rating on a long-term bank facility.
Beta: 0.84 |
Alpha: -7.50 |
Risk Reward Ratio: 1.41 |
The margin of Safety: 19% |
Hindustan Petroleum Corporation Limited - Quarterly Summary
|
Quarterly (INR in lakhs) |
Mar-22 |
Dec-21 |
Sep-21 |
Jun-21 |
Mar-21 |
|
Revenue from Operations |
1,05,350.49 |
1,03,488.75 |
87,654 |
77,634 |
85,264.77 |
|
|
|||||
|
Other income |
1183.35 |
477.75 |
431 |
347 |
490 |
|
Total Income |
1,06,534 |
1,03,966.5 |
88,085.42 |
77,980 |
85,754.76 |
|
|
|||||
|
Total Expenditure |
1,04,257.72 |
1,02,671.29 |
85,587.42 |
75,366.59 |
81,492.78 |
|
EBIT |
2,276 |
1,295 |
2,498 |
2,614 |
4,262 |
|
|
|||||
|
Finance cost |
335 |
244 |
159 |
259 |
225 |
|
EBT before exceptional Items |
1,941 |
1,051 |
2,339 |
2,354 |
4,037 |
|
|
|||||
|
Share in P&L of Joint Ventures |
562 |
578 |
18 |
300 |
32 |
|
PBT |
2,503 |
1,629 |
2,356 |
2,655 |
4,070 |
|
|
|||||
|
Tax Expenses |
484.77 |
276 |
437.56 |
650.64 |
1,009.05 |
|
PAT |
2,018 |
1,353 |
1,919 |
2,004 |
3,061 |
Business
-
HPCL is a petroleum oil refining and marketing conglomerate. It has significant oil marketing operations and is India's third-largest oil refining and marketing company.
-
The company has a total refining capacity of 21.5 MMTPA, comprised of Coastal refineries in Mumbai and Vishakhapatnam.
-
HPCL is setting up a grass-root Greenfield refinery-cum-petrochemical complex with a 9 MTPA in Barmer through HPCL Rajasthan Refinery Ltd, a JV with the Government of Rajasthan.
-
Through a joint venture with Singapore-based Mittal Energy Investments Pvt Ltd, the company also operates an 11.3 MMTPA refinery in Bathinda, Punjab.
-
HPCL Refinery Capacity
Total Capacity
21.5 MMTPA
Mumbai
7.5 MMTPA
Vishakhapatnam
8.3 MMTPA
Bhatinda
5.65 MMTPA
-
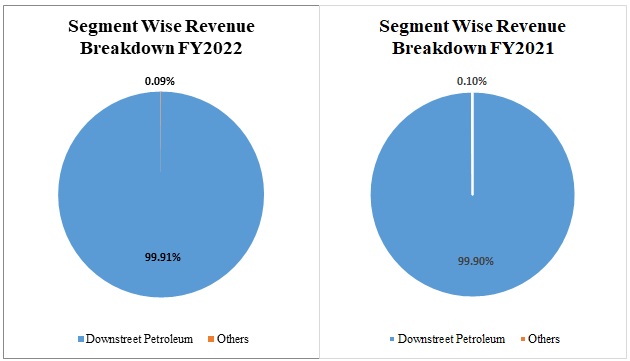
Out of the total revenue generated, 99.91% has been generated from Downstream Petroleum activities, whereas 0.09% has been generated from other activities in FY 2022, which is at par when compared to FY 2021.
-
As of 2022, the company has 20,183 retail outlets, 6,249 LPG Distribution, 6 Lube blending plants, and 275 Lube distributers.
-
As of March 2022, the company has achieved market sales of 39.14 MMT and a refining throughput of 13.97 MMT (Metric Tonne).
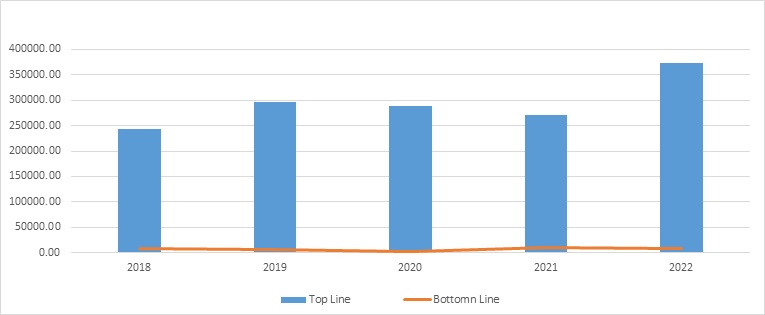
Hindustan Petroleum Corporation Limited - Revenue Trend
Topline and Bottomline trend (crores)
Ratio Analysis
|
|
Mar-18 |
Mar-19 |
Mar-20 |
Mar-21 |
Mar-22 |
|
Profitability Ratio |
|
|
|
|
|
|
Gross Profit |
79.60% |
77.00% |
79.76% |
84.50% |
82.07% |
|
EBITDA Margin |
5.01% |
4.37% |
2.55% |
6.89% |
3.39% |
|
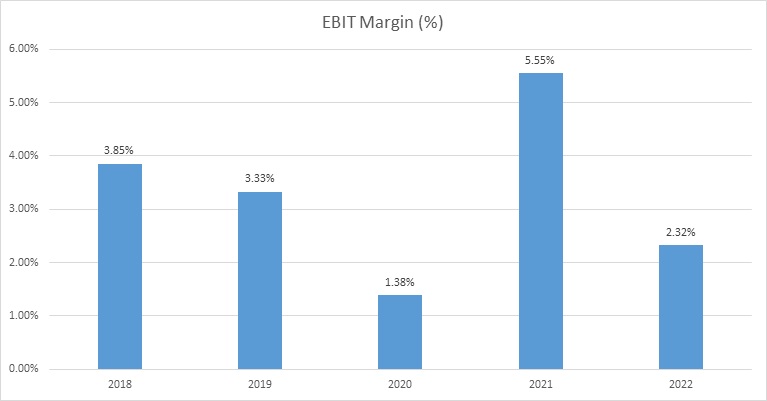
EBIT Margin |
3.85% |
3.33% |
1.38% |
5.55% |
2.32% |
|
Pre-Tax Margin |
4.14% |
3.38% |
0.48% |
5.25% |
2.44% |
|
Net Profit Margin |
2.96% |
2.25% |
0.92% |
3.94% |
1.95% |
|
|
|
|
|
|
|
|
Return on Investment |
|
|
|
|
|
|
Return on Asset – ROA |
|
6.79% |
2.35% |
8.49% |
5.05% |
|
Return on Capital Employed – ROCE |
|
21% |
7% |
23% |
11% |
|
Return on Equity – ROE |
|
23.92% |
8.60% |
30.88% |
18.35% |
|
|
|
|
|
|
|
|
Liquidity Ratio |
|
|
|
|
|
|
Current ratio (x) |
0.77 |
0.76 |
0.66 |
0.71 |
0.70 |
|
Quick Ratio |
0.377 |
0.403 |
0.320 |
0.247 |
0.198 |
|
|
|
|
|
|
|
|
Turnover Ratio |
|
|
|
|
|
|
Receivables Turnover |
|
6.91 |
6.09 |
7.29 |
6.44 |
|
Inventory Turnover |
|
102.10 |
121.15 |
196.90 |
168.70 |
|
Payables Turnover |
|
86.04 |
87.15 |
114.84 |
112.99 |
|
Asset Turnover |
|
2.57 |
2.16 |
2.59 |
#DIV/0! |
|
|
|
|
|
|
|
|
Solvency Ratio |
|
|
|
|
|
|
Debt to Equity |
0.38 |
0.40 |
0.75 |
0.66 |
0.78 |
|
Interest Coverage Ratio |
12.6 |
3.5 |
15.59 |
8.71 |
8.71 |
Hindustan Petroleum Corporation Limited - Financial Overview
Profit and Loss Statement (₹ in crores)
|
Mar-18 |
Mar-19 |
Mar-20 |
Mar-21 |
Mar-22 |
|
|
Revenue |
2,44,262.34 |
2,97,222 |
2,87,742.05 |
2,70,577 |
3,74,126 |
|
Other income |
1,527.88 |
1,453.12 |
1,681.62 |
2,643.73 |
2,438.92 |
|
Total Revenue |
2,45,790.22 |
2,98,675 |
2,89,423 |
2,73,221 |
3,76,565 |
|
Cost of Material Consumed |
51,365.48 |
69,808.7 |
59,906.49 |
44,572.77 |
69,536.18 |
|
Gross Profit |
1,94,424.74 |
2,28,866 |
2,29,517.18 |
2,28,648 |
3,07,029 |
|
Purchases of Stock-in-Trade |
1,42,455.74 |
1,80,570 |
1,87,234 |
1,64,500 |
2,53,220 |
|
Changes in Inventories of Finished Goods, Stock-in-Trade and Work-in-Progress |
666 |
-2,224.2 |
-354.51 |
-8,518.53 |
-625.88 |
|
Excise Duty |
24,752.47 |
21,731.6 |
18,650.52 |
37,329.51 |
24,213.81 |
|
Employees Benefits Expenses |
2,892.57 |
2,971.24 |
3,224.06 |
3,219.42 |
3,017.35 |
|
Other Expenses |
11,417.13 |
12,837.1 |
13,418.87 |
13,470.67 |
14,520.53 |
|
EBITDA |
12,240.83 |
12,980.4 |
7,344.11 |
18,647.09 |
12,683.25 |
|
Depreciation, Amortisation, and Impairment |
2,834.40 |
3,085.30 |
3,369.87 |
3,625.47 |
4,000.36 |
|
EBIT |
9,406.43 |
9,895.11 |
3,974.24 |
15,021.62 |
8,682.89 |
|
Finance cost |
617.88 |
785.64 |
1,138.85 |
963.28 |
997.32 |
|
EBT before Exceptional Items |
8,788.55 |
9,109.47 |
2,835.39 |
14,058.34 |
7,685.57 |
|
Share in Profit of Joint Ventures and Associates |
1,321.59 |
929.73 |
-458.17 |
138.66 |
1,458.05 |
|
Exceptional items |
-1,002.93 |
||||
|
EBT |
10,110.14 |
10,039.2 |
1,374.29 |
14,197.00 |
9,143.62 |
|
tax expenses |
2,891.86 |
3,348.57 |
-1,264.44 |
3,534.11 |
1,849.39 |
|
PAT before Non-Controlling Interest and non-perpetual Securities |
7,218.28 |
6,690.63 |
2,638.73 |
10,662.89 |
7,294.23 |
|
EPS |
|||||
|
Basic |
47.37 |
43.90 |
17.32 |
70.56 |
51.42 |
|
Diluted |
47.37 |
43.90 |
17.32 |
70.56 |
51.42 |
|
Number of shares |
|||||
|
Basic |
152.38 |
152.39 |
152.38 |
151.11 |
141.85 |
|
Diluted |
152.38 |
152.39 |
152.38 |
151.11 |
141.85 |
Cash Flow Statement (₹ in crores)
|
|
Mar-18 |
Mar-19 |
Mar-20 |
Mar-21 |
Mar-22 |
|
Net Profit Before Tax |
10,110.14 |
10,039.20 |
1,374.29 |
14,197.00 |
9,143.62 |
|
Net Cash from Operating Activities |
11,037.21 |
8,554.03 |
5,469.24 |
17,829.26 |
15,810.23 |
|
Net Cash Used for Investing Activities |
-7,397.96 |
-11,381.74 |
-14,167.89 |
-12,278.59 |
-13,744.84 |
|
Net Cash From (Used For) Financing Activities |
-4,422.96 |
2,598.21 |
8,451.96 |
-4,709.19 |
-2,066.24 |
|
Net Increase in Cash and Cash Equivalents |
-783.71 |
-229.50 |
-246.69 |
841.48 |
-0.85 |
|
Cash And Cash Equivalents at The Beginning of The Year |
-1,652.23 |
-2,435.94 |
-2,665.44 |
-2,912.13 |
-2,070.65 |
|
Cash And Cash Equivalents at The End of the Year |
-2,435.94 |
-2,665.44 |
-2,912.13 |
-2,070.65 |
-2,071.50 |
Balance Sheet (₹ in crores)
|
Mar-18 |
Mar-19 |
Mar-20 |
Mar-21 |
Mar-22 |
|
|
ASSETS |
|||||
|
Non-Current Assets |
|||||
|
Property, Plant & Equipment |
38,225.68 |
41,168.63 |
48,391.57 |
49,950.58 |
56,982.17 |
|
Capital Work-in-Progress |
3,989.02 |
9,495.91 |
17,047.34 |
25,128.63 |
28,645.09 |
|
Goodwill on Consolidation |
16.69 |
16.69 |
16.69 |
321.62 |
321.62 |
|
Other Intangible Assets |
452.77 |
456.18 |
543.52 |
639.71 |
822.31 |
|
Intangible Assets under development |
21.51 |
22.82 |
122.42 |
207.4 |
262.15 |
|
Investment in Joint Ventures and Associates |
7,306.57 |
8,715.69 |
8,820.82 |
9,333.88 |
12,840.27 |
|
Financial Assets: |
|||||
|
Other Investments |
576.05 |
498 |
229.93 |
341.96 |
655.56 |
|
Loans |
712 |
1,141.43 |
1,409.48 |
846.24 |
925.89 |
|
Other Financial Assets |
2.67 |
1.67 |
6.29 |
149.36 |
145.55 |
|
Other non-current assets |
1,835.71 |
2,339.46 |
2,702.07 |
3,069.43 |
3,277.73 |
|
Total Non-Current Assets |
53,138.67 |
63,856.48 |
79,290.13 |
89,988.81 |
1,04,878.34 |
|
Current Assets |
|||||
|
Inventories |
18,612.23 |
20,443.62 |
19,325.99 |
28,763.90 |
35,514.71 |
|
Financial Assets: |
|||||
|
Investments |
4,999.38 |
5,083.76 |
5,344.86 |
5417.58 |
5,371.52 |
|
Trade Receivables |
5,587.02 |
5,667.79 |
3,934.19 |
6,869.99 |
6,340.31 |
|
Cash and cash equivalents |
121.52 |
198.74 |
204.76 |
480.38 |
233.85 |
|
Bank balances other than cash and cash equivalents |
1,168.13 |
19.76 |
18.36 |
94.54 |
24.12 |
|
Loans |
331.04 |
850.83 |
409.86 |
126.3 |
155.18 |
|
Other Financial Assets |
5,382.96 |
10,540.11 |
7,970.43 |
1,794.45 |
1,508.00 |
|
Other Current Assets |
327.31 |
677.15 |
401.24 |
625.23 |
541.65 |
|
Total Current Assets |
36,529.59 |
43,481.76 |
37,609.69 |
44,172.37 |
49,689.34 |
|
Assets Classified as Held For Sale |
3.49 |
8.24 |
10.07 |
12.67 |
60.51 |
|
Total Assets |
89,671.75 |
1,07,346.48 |
1,16,909.89 |
1,34,173.85 |
1,54,628.19 |
|
EQUITIES & LIABILITIES |
|||||
|
Equity |
|||||
|
Equity share capital |
1,524.21 |
1,524.21 |
1,524.21 |
1,452.41 |
1,418.94 |
|
Other equity- |
24,008.23 |
28,876.45 |
29,456.41 |
36,628.45 |
39,985.27 |
|
Equity attributable to owners of the company |
25,532.44 |
30,400.66 |
30,980.62 |
38,080.86 |
41,404.21 |
|
Total Equity |
25,532.44 |
30,400.66 |
30,980.62 |
38,080.86 |
41,404.21 |
|
Liabilities |
|||||
|
Non-Current Liabilities |
|||||
|
Financial Liabilities |
|||||
|
Borrowings |
9,655.94 |
12,127.80 |
23,109.63 |
25,049.19 |
32,115.28 |
|
Lease Liabilities |
2,715.23 |
3,150.74 |
|||
|
Other financial liabilities |
0.47 |
0.51 |
0.70 |
32.63 |
53.25 |
|
Provisions |
79.27 |
58.41 |
54.62 |
36.8 |
50.73 |
|
Deferred Tax Liabilities |
6,804.82 |
7,396.25 |
5,491.44 |
5,462.21 |
5,957.71 |
|
other non-current liabilities |
35.85 |
152.95 |
224.83 |
382.48 |
456.7 |
|
Total Non-Current Liabilities |
16,576.35 |
19,735.92 |
28,881.22 |
33,678.54 |
41,784.41 |
|
Current Liabilities |
|||||
|
Financial Liabilities |
|||||
|
Borrowings |
10,879.42 |
13,908.68 |
16,276.12 |
15,634.65 |
12,863.45 |
|
Lease Liabilities |
309.66 |
368.28 |
|||
|
Trade Payables |
15,779.96 |
17,133.37 |
11,472.55 |
16,576.04 |
26,477.33 |
|
Other Financial Liabilities |
14,567.21 |
19,534.61 |
23,385.91 |
20,988.94 |
22,538.89 |
|
Provisions |
2,436.26 |
2,082.18 |
2,630.56 |
2,847.07 |
2,486.70 |
|
Other Current Liabilities |
3,603.95 |
3,719.79 |
2,915.94 |
5,706.37 |
6,437.49 |
|
Current tax liabilities (Net) |
296.16 |
831.27 |
366.97 |
351.72 |
267.43 |
|
Total Current Liabilities |
47,562.96 |
57,209.90 |
57,048.05 |
62,414.45 |
71,439.57 |
|
Total Equity and Liabilities |
89,671.75 |
1,07,346.48 |
1,16,909.89 |
1,34,173.85 |
1,54,628.19 |
Industry Overview
-
Oil refining and marketing are essential for India's economic development. The domestic market for key petroleum products such as motor spirits, high-speed diesel, superior kerosene oil (SKO), and liquefied petroleum gas is dominated by oil marketing companies (OMCs) (LPG).
-
Crude oil prices have been volatile in recent years. Prices fell sharply to around USD 20 per barrel (bbl.) near the end of March 2020, then recovered to pre-pandemic levels, averaging around USD 64 per bbl. by the end of fiscal 2021. The ongoing geopolitical tensions have pushed crude oil prices above $100/bbl once more.
-
India's current refining capacity is 249 MMTPA, with 23 refineries -19 in the public sector, three in the private sector, and one in a joint venture. With a capacity of 80.5 MMTPA, Indian Oil Corporation (IOC) is the largest domestic refiner.
-
India's oil demand is expected to double, reaching 11 million barrels per day by 2045
-
Diesel demand in India is expected to double to 163 MT by 2029-30, with diesel and gasoline accounting for 58% of total oil demand in India by 2045.
-
By 2040, gas consumption is expected to reach 143.08 BCM. The government intends to invest $2.86 billion in upstream oil and gas production by 2022 in order to double natural gas production to 60 BCM and drill more than 120 exploration wells.
-
According to the International Energy Agency (IEA), India's medium-term natural gas consumption outlook remains positive due to expanding infrastructure and supportive environmental policies. Industrial consumers are expected to account for 40% of net demand growth in India. Residential, transportation, and energy sectors are also expected to drive demand.
-
The Department for Promotion of Industry and Internal Trade (DPIIT) approved an order in July 2021, allowing 100% FDIs under the automatic route for oil and gas PSUs.
Hindustan Petroleum Corporation Limited - Technical Analysis
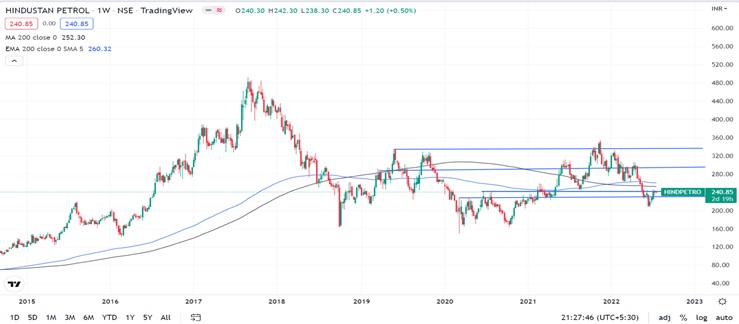
-
Stock is trading near EMA 200 and MA 200 indicators, with a strong support level of ₹230 and a resistance level at ₹336.
-
One can accumulate this share at the current price.
Recommendation Rationale:
-
For the FY22, Hindustan Petroleum Corporation Limited’s revenue increased to ₹3,74,126 crores, compared to the previous year at ₹2,70,577. It also registered a net Profit After Tax of ₹7,294.23 crores compared to the last year at ₹10,662.89 crores.
-
Given its role in India's economic development, HPCL remains strategically important to the Government of India (GoI). HPCL's strategic importance and the expectation of continued support from the Government of India and its parent company, Oil and Natural Gas Corporation (ONGC), ensure the smooth supply of resources.
-
The company has generated positive EPS of ₹70 and ₹51 in the last couple of years.
-
For the past few years, the company has reported above-capacity utilization levels of refineries of more than 100%.
-
From FY21 to FY23, the company has aggressive CAPEX plans worth 39,000 crores INR, including equity investments of 7,200 crores in JVs.
-
Its major CAPEX projects are as follows:
-
Modernization and expansion of its refineries in Mumbai and Visakhapatnam. It intends to increase the capacity of the Mumbai refinery to 9.5 MMTPA and the Visakhapatnam refinery to 15 MMTPA.
-
Rajasthan refinery/petrochemical complex (74% stake).
-
Gujarat LNG terminal (50% stake).
-
-
HPCL has installed a captive solar power capacity of 11.4 MWp across various locations to increase renewable energy consumption, bringing total solar power capacity to 43.95 MWp.
-
Oil and Natural Gas Corporation Ltd purchased a 51% stake in HPCL from the Government of India in January 2018 for 37,000 crores.
Valuation
-
The company’s revenue has increased at a CAGR of 11.25% from FY 2019-to 2022.
-
For 2022, the company’s ROE and ROCE were 18.35% and 11%.
-
Q1FY2023 results could get impacted due to the fluctuating oil prices amid the war tension and the increase in the inflation level.
-
Based on the performance of the company in FY22, we expect the company could post higher revenue for the current financial (2023), corresponding to the previous year.
-
We have taken data for the last five years (2018-2022) and forecasted revenue for FY 2023-2027. Revenue growth is assumed to be 7%.
Estimated Income Statement (₹ in crores):
|
|
Mar-23 |
Mar-24 |
Mar-25 |
Mar-26 |
Mar-27 |
|
|
2023-E |
2024-E |
2025-E |
2026-E |
2027-E |
|
Revenue |
4,02,803.58 |
4,30,875.44 |
4,60,909.85 |
4,93,044.13 |
5,27,425.22 |
|
COGS |
74,564.08 |
76,652.13 |
84,190.34 |
89,728.96 |
95,433.89 |
|
Gross Profit |
3,28,239.50 |
3,54,223.31 |
3,76,719.52 |
4,03,315.17 |
4,31,991.34 |
|
Employee Expenses |
3,995.82 |
3,865.05 |
4,355.21 |
4,542.58 |
4,923.42 |
|
Other Expenses |
3,02,023.34 |
3,20,781.28 |
3,49,490.05 |
3,69,946.82 |
3,96,558.99 |
|
EBITDA |
22,220.33 |
29,576.99 |
22,874.26 |
28,825.77 |
30,508.92 |
|
Depreciation |
4,658.09 |
5,539.34 |
6,443.15 |
7,373.85 |
8,335.90 |
|
EBIT |
17,562.24 |
24,037.65 |
16,431.11 |
21,451.92 |
22,173.02 |
|
Financial Cost |
2,017.21 |
2,760.97 |
1,887.28 |
2,463.98 |
2,546.80 |
|
EBT |
15,545.04 |
21,276.67 |
14,543.83 |
18,987.94 |
19,626.22 |
|
Tax expenses |
3,144.14 |
4,303.42 |
2,941.64 |
3,840.50 |
3,969.60 |
|
PAT |
12,400.89 |
16,973.25 |
11,602.19 |
15,147.44 |
15,656.62 |
-
We initiate coverage on Hindustan Petroleum Corporation Limited with a “BUY” and a 1-year Target Price of 295.
Disclaimer: This report is only for the information of our customer Recommendations, opinions, or suggestions are given with the understanding that readers acting on this information assume all risks involved. The information provided herein is not to be construed as an offer to buy or sell securities of any kind.
- Share :


Post a Comment
|
DISCLAIMER |
This report is only for the information of our customers. Recommendations, opinions, or suggestions are given with the understanding that readers acting on this information assume all risks involved. The information provided herein is not to be construed as an offer to buy or sell securities of any kind. ATS and/or its group companies do not as assume any responsibility or liability resulting from the use of such information.