ICICI BANK LIMITED
ICICI Bank Limited - Company Profile
ICICI Bank Limited was incorporated in 1955 and has its registered office in Baroda, Gujarat and its corporate office in Mumbai, India. ICICI along with its subsidiaries is engaged in providing a wide range of banking and financial services in retail banking, wholesale banking and treasury operations.
ICICI has operations in 19 countries, including India and as of March 31, 2014, it had a branch network of 3,753 branches, the largest among private sector banks in the country, and an ATM network of 11,315 as compared to 10,481 at March 31, 2013.
For FY 2014, ICICI’s net interest margins stood at a healthy 3.33 % (3.11 % for FY 2013). For the same period, net NPA’s stood at 0.82 % (0.64% for FY 2013) which is slightly higher from the industry average of for private banks.
ICICI Bank's Board members include eminent individuals with a wealth of experience in international business, management consulting, banking and financial services.
ICICI Bank has maintained its CASA account ratio at 42.9 % for FY 2015
ICICI Bank Limited - STOCK INFORMATION
|
STOCK PRICE |
319.35 |
|
TARGER PRICE |
315-305-285 |
|
SECTOR |
BANKS |
|
SYMBOL (AT NSE) |
ICICIBANK |
|
ISIN |
INE090A01021 |
|
FACE VALUE (IN RS.) |
2.00 |
|
BSE CODE |
532174 |
ICICI Bank Limited - STOCK FUNDAMENTALS
|
MARKET CAP |
185000.58 |
|
BOOK VALUE |
126.28 |
|
EPS - (TTM) (IN RS. CR.) |
18.81 |
|
P/E |
16.96 |
|
INDUSTRY P/E |
23.88 |
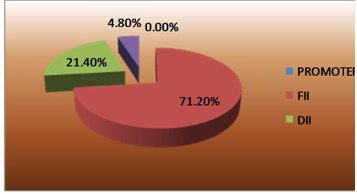
SHAREHOLDING PATTERN
RESULTS (Quarterly )(Rs CR.)
|
|
DEC' 14 |
SEP' 14 |
JUN' 14 |
MAR 14 |
DEC' 13 |
|
Sales |
12,435.21 |
12,150.56 |
11,766.9 |
11,489.2 |
11,454.95 |
|
Operat- ing profit |
8,589.18 |
8,603.95 |
8,215.84 |
7,896.35 |
8,143.28 |
|
Interest |
7,623.55 |
7,493.92 |
7,275.01 |
7,132.73 |
7,199.89 |
|
Gross profit |
5,036.99 |
4,697.91 |
4,516.72 |
4,453.49 |
4,439.04 |
|
EPS (Rs) |
4.99 |
4.68 |
4.59 |
4.59 |
4.39 |
ICICI Bank Limited - TECHNICAL VIEW

ICICI BANK LTD is looking weak on charts. We advise to sell around 335-325 with stoploss of 345 for the targets of 315-305 -285 levels. RSI is also showing downside momentum in it on daily charts.
|
SYMBOL |
VALUE |
ACTION |
|
RSI(14) |
28.830 |
SELL |
|
STOCH(9,6) |
22.302 |
SELL |
|
STOCHRSI(14) |
0.000 |
OVER SOLD |
|
MACD(12,26) |
-3.940 |
SELL |
|
ADX(14) |
58.958 |
SELL |
|
WILLIAMS %R |
-92.723 |
OVERSOLD |
|
CCI(14) |
-115.3773 |
SELL |
|
ATR(14) |
3.2036 |
HIGH VOLATILITY |
|
HIGH/LOWS(14) |
-8.6429 |
SELL |
|
ULTIMATE OSCILLATOR |
34.259 |
SEL |
|
ROC |
-6.349 |
SELL |
|
BULL/BEAR POWER()13 |
-12.8620 |
SELL |
|
BUY: 0 SELL:9 NEUTRAL: 2 |
SUMMARY : STRONG SELL |
Our Other Recommendation for Next Week
|
SCRIP |
ACTION |
CMP |
ENTRY |
SL |
TGT |
TIME FRAME |
|
JUBILANT FOOD |
BUY |
1592.85 |
1580-1590 |
1550 |
1620-1650 |
ONE WEEK |
|
IRB |
BUY |
241.1 |
235-240 |
230 |
245-250 |
ONE WEEK |
|
AUROPHARMA |
SELL |
1158.6 |
1180-1200 |
1220 |
1150-1120 |
ONE WEEK |
|
REL CAPITAL |
SELL |
440.05 |
445-450 |
465 |
435-420 |
ONE WEEK |
|
REL INFRA |
SELL |
437.4 |
440-450 |
459 |
430-410 |
ONE WEEK |
Performance of Previous Week
|
SCRIP |
LOT |
ACTION |
ENTRY |
SL |
TGT |
P&L |
REMARK |
CLOSE/LOW/HIGH |
|
PFC |
1000 |
SELL |
275-280 |
290 |
265-255 |
-10000.00 |
SL TRG |
276.20 / 290.65 |
|
VOLTAS |
1000 |
BUY |
285-290 |
278 |
296-302 |
-7000.00 |
SL TRG |
275.15 / 272.60 |
|
DLF |
2000 |
BUY |
155-158 |
152 |
162-165 |
14000.00 |
BOTH TGT HIT |
160.50 / 167.75 |
|
RECL |
1000 |
SELL |
335-340 |
352 |
325-310 |
-12000.00 |
SL TRG |
335.35 / 354.20 |
|
LIC HOUSING |
1000 |
SELL |
445-442 |
452 |
435-420 |
-7000.00 |
SL TRG |
460.55 / 475.70 |
|
BATA INDIA |
250 |
SELL |
1180-1200 |
1230 |
1150-1120 |
12500.00 |
FIRST TGT HIT |
1173.55 / 1147.65 |
|
NET PROFIT |
|
|
|
|
|
-9500.00 |
|
|
- Share :


Post a Comment
|
DISCLAIMER |
This report is only for the information of our customers. Recommendations, opinions, or suggestions are given with the understanding that readers acting on this information assume all risks involved. The information provided herein is not to be construed as an offer to buy or sell securities of any kind. ATS and/or its group companies do not as assume any responsibility or liability resulting from the use of such information.