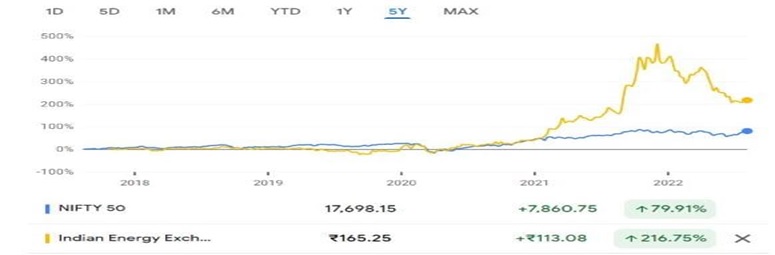
Indian Energy Exchange Limited Research Report
|
Industry |
Market Price |
Recommendation |
Target |
Time Horizon |
|
Energy |
160 |
210 |
Buy |
1 Year |
Q1 FY 2023 Review
Indian Energy Exchange Limited reported net revenue of ₹9,835.19 Lakhs for the quarter ended June 30, 2022, compared to ₹9,102.96 Lakhs for June 30, 2021. EBIT and Profit After Tax were ₹9,186.24 Lakhs and ₹6,912.86 Lakhs for the quarter ended 30 June 2022, as compared to ₹8,243.46 Lakhs and ₹6,210.45 Lakhs during the corresponding quarter of the previous year.
Indian Energy Exchange Limited - Investment Summary
|
CMP (₹) |
160 |
|
52 Week H/L |
318.6/128.37 |
|
Market Cap (crores) |
14,678 |
|
Face Value (₹) |
01 |
|
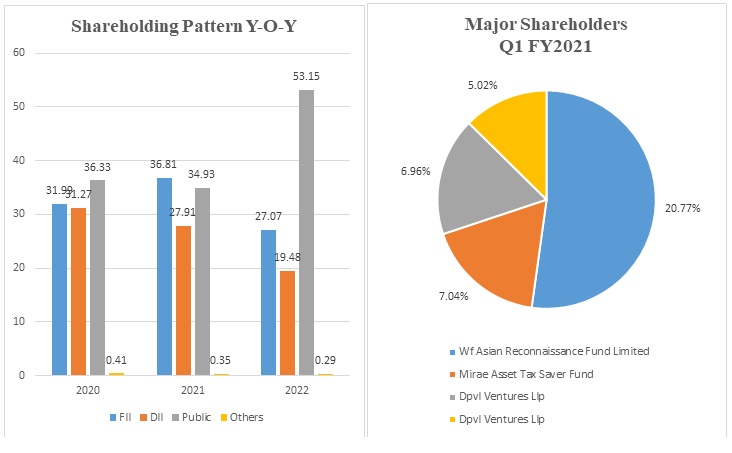
Promoter Holding (%) |
0.00 |
|
Non-Promoter Holding (%) |
100 |
|
Total (%) |
100.00 |
|
Book Value |
₹7.83 |
|
EPS TTM |
₹3.52 |
Indian Energy Exchange Limited - Overview
-
Indian Energy Exchange Limited (IEX) is India’s pioneering and premier power trading platform. The exchange provides an automated platform for the physical delivery of electricity.
-
IEX commands a market share of ~90% in the power exchange market.
-
IEX went into business in 2008 following the enactment of the Electricity Act, 2003, which permitted open access in terms of inter-state transmission, followed by the National Electricity Policy and a conducive framework put in place by CERC.
Beta: 0.88 |
Alpha: 37.07 |
Risk Reward Ratio: 1.33 |
The margin of Safety: 22% |
Indian Energy Exchange Limited - Quarterly Summary
|
Quarterly (INR in lakhs) |
Jun-22 |
Mar-22 |
Dec-21 |
Sep-21 |
Jun-21 |
|
Revenue from Operations |
9,835.19 |
11,208.35 |
11,754.22 |
11,037.98 |
9,102.96 |
|
|
|
|
|
|
|
|
Other income |
1,504.29 |
1,635.73 |
1,323.68 |
1,192.44 |
1,184.82 |
|
Total Income |
11,339.48 |
12,844.08 |
13,077.90 |
12,230.42 |
10,287.78 |
|
|
|
|
|
|
|
|
Total Expenditure |
2,153.24 |
2,129.79 |
2,313.98 |
1,972.66 |
2,044.32 |
|
EBIT |
9,186 |
10,714 |
10,764 |
10,258 |
8,243 |
|
|
|
|
|
|
|
|
Exceptional Items |
54.23 |
742.04 |
|
|
|
|
PBT before exceptional Items |
9,240 |
11,456 |
10,764 |
10,258 |
8,243 |
|
Finance cost |
54.59 |
45.97 |
49.53 |
47.04 |
54.95 |
|
PBT |
9,186 |
11,410 |
10,714 |
10,211 |
8,189 |
|
|
|
|
|
|
|
|
Tax Expenses |
2,273.02 |
2,569.65 |
2,640.91 |
2,471.78 |
1,978.06 |
|
PAT |
6,913 |
8,841 |
8,073 |
7,739 |
6,210 |
Business
-
IEX is India's first and largest energy exchange, providing a nationwide, automated trading platform for physical electricity delivery.
-
The exchange platform enables efficient price discovery and increases the accessibility and transparency of India's power market, while also improving trade execution speed and efficiency.
-
IEX has a robust ecosystem of over 6,800 participants spread across 29 states and 5 union territories, including 55 distribution utilities and 500 conventional generators.
-
It also has a strong customer base of 4400+ commercial and industrial customers from industries such as metal, food processing, textile, cement, ceramic, chemicals, automobiles, information technology industries, institutional, housing, real estate, and commercial entities.
-
Product segments:
-
Day Ahead Market (DAM) - IEX allows its participants to transact electricity in 15-minute blocks a day before delivery. Bids are submitted electronically by buyers and sellers.
-
Term Ahead Market (TAM) range for buying and selling electricity for up to 11 days. It allows participants to buy electricity on the same day through intra-day contracts
-
Renewable Energy Certificate (REC) - The Rec market facilitates environmental attribute transactions. Renewable Energy (RE) generators can choose to obtain RECs in exchange for the green attributes of their generation.
-
Energy Saving certificates (ESCERTS) - ESCerts are tradable certificates issued by the Bureau of Energy Efficiency under the Perform, Achieve, Trade Scheme, a market-based mechanism designed to incentivize energy efficiency in large energy-intensive industries.
-
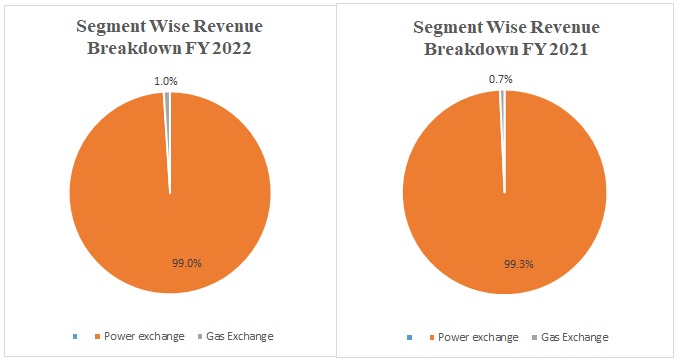
Out of the total revenue generated, 98.99% has been generated from power exchange whereas 1.01% has been generated from gas exchange in FY 2022, compared to 99.28% and 0.72% in FY 2021.
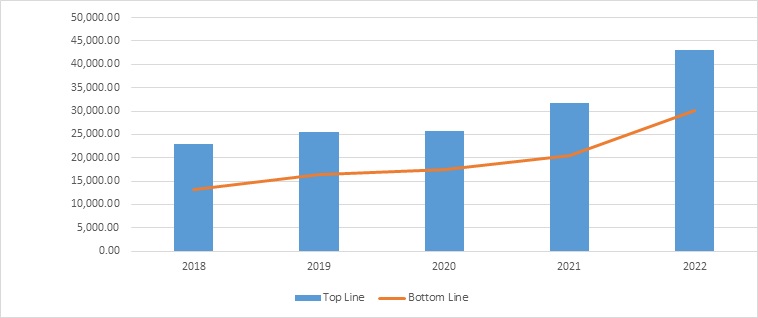
Indian Energy Exchange Limited - Revenue Trend
Topline and Bottomline trend (crores)
Indian Energy Exchange Limited - Ratio Analysis
|
|
Mar-18 |
Mar-19 |
Mar-20 |
Mar-21 |
Mar-22 |
|
Profitability Ratio |
|
|
|
|
|
|
EBITDA Margin |
91.34% |
95.60% |
94.28% |
90.93% |
96.75% |
|
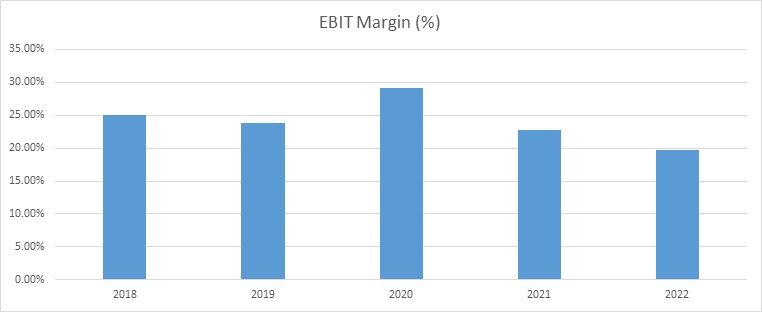
EBIT Margin |
86.88% |
91.50% |
88.35% |
85.73% |
92.75% |
|
Net Profit Margin |
57.14% |
64.96% |
68.34% |
64.63% |
69.88% |
|
|
|
|
|
|
|
|
Return on Investment |
|
|
|
|
|
|
Return on Asset – ROA |
|
26% |
26% |
25% |
22% |
|
Return on Capital Employed – ROCE |
|
66.17% |
54.61% |
52.67% |
59.43% |
|
Return on Equity – ROE |
|
50.47% |
46.35% |
43.53% |
47.84% |
|
|
|
|
|
|
|
|
Liquidity Ratio |
|
|
|
|
|
|
Current ratio (x) |
1.37 |
1.27 |
1.46 |
1.93 |
1.54 |
|
Quick Ratio |
1.37 |
1.27 |
1.46 |
1.93 |
1.54 |
|
|
|
|
|
|
|
|
Turnover Ratio |
|
|
|
|
|
|
Receivables Turnover |
|
33.11 |
32.70 |
1.94 |
38.35 |
|
Asset Turnover |
|
0.40 |
0.37 |
0.38 |
0.32 |
|
|
|
|
|
|
|
Indian Energy Exchange Limited - Financial Overview
Indian Energy Exchange Limited - Profit and Loss Statement (₹ in Lakhs)
|
|
Mar-18 |
Mar-19 |
Mar-20 |
Mar-21 |
Mar-22 |
|
Revenue from Operations |
23,044.80 |
25,407.68 |
25,713.11 |
31,785.06 |
43,103.51 |
|
Other income |
2,562.34 |
4,008.18 |
4,026.95 |
3,838.04 |
5,336.67 |
|
Total Revenue |
25,607.14 |
29,415.86 |
29,740.06 |
35,623.10 |
48,440.18 |
|
Employees Benefits Expenses |
2,407.69 |
2,483.19 |
3,323.14 |
4,438.10 |
4,175.63 |
|
Other Expenses |
2,149.94 |
2,642.34 |
2,174.14 |
2,283.58 |
2,562.35 |
|
EBITDA |
21,049.51 |
24,290.33 |
24,242.78 |
28,901.42 |
41,702.20 |
|
Depreciation, Amortisation and Impairment |
1,027.34 |
1,042.41 |
1,524.29 |
1,651.01 |
1,722.77 |
|
EBIT |
20,022.17 |
23,247.92 |
22,718.49 |
27,250.41 |
39,979.43 |
|
Finance cost |
22.66 |
73.42 |
156.56 |
205.48 |
197.49 |
|
EBT |
19,999.51 |
23,174.50 |
22,561.93 |
27,044.93 |
39,781.94 |
|
Tax expenses |
6,830.99 |
6,670.83 |
4,990.14 |
6,501.81 |
9,660.40 |
|
PAT |
13,168.52 |
16,503.67 |
17,571.79 |
20,543.12 |
30,121.54 |
|
EPS |
|||||
|
Basic |
4.46 |
5.47 |
5.89 |
6.88 |
3.35 |
|
Diluted |
4.41 |
5.46 |
5.89 |
6.88 |
3.35 |
|
|
|
|
|
|
|
|
Number of shares |
|||||
|
Basic |
2,952 |
3,017 |
2,983 |
2,984 |
8987 |
|
Diluted |
2989 |
3020 |
2984 |
2985 |
8987 |
Indian Energy Exchange Limited - Cash Flow Statement (₹ in Lakhs)
|
|
Mar-18 |
Mar-19 |
Mar-20 |
Mar-21 |
Mar-22 |
|
Net Profit Before Tax |
19,999.51 |
23,174.50 |
22,561.93 |
27,044.93 |
40,523.98 |
|
Net Cash from Operating Activities |
18,299.69 |
19,785.49 |
17,506.97 |
37,125.71 |
86,557.18 |
|
Net Cash Used for Investing Activities |
-3,342.45 |
-6,212.03 |
-252.44 |
-19,605.25 |
-44,841.93 |
|
Net Cash From (Used For) Financing Activities |
-12,626.79 |
-7,843.69 |
-16,144.84 |
-7,712.24 |
-13,577.25 |
|
Net Increase in Cash and Cash Equivalents |
-2,853.73 |
-228.80 |
-3,795.62 |
3,318.79 |
17,812.88 |
|
Cash And Cash Equivalents at The Beginning of The Year |
8,164.04 |
5,310.31 |
5,081.51 |
1,285.89 |
4,604.68 |
|
Cash And Cash Equivalents at The End of the Year |
5,310.31 |
5,081.51 |
1,285.89 |
4,604.68 |
22,417.56 |
Indian Energy Exchange Limited - Balance Sheet (₹ in Lakhs)
|
2018 |
2019 |
2020 |
2021 |
2022 |
|
|
ASSETS:- |
|||||
|
Non Current Assets: |
|||||
|
Property, Plant & Equipment |
722.92 |
716.42 |
849.16 |
1429.67 |
1203.27 |
|
Capital work-in progress |
28.77 |
35 |
2.55 |
16.79 |
|
|
Right-of-use assets |
1331.21 |
1037.07 |
821.03 |
||
|
Other intangible assets |
11176.01 |
10420.9 |
9717.91 |
9680.01 |
8962.74 |
|
Intangible assets under development |
24.27 |
89.9 |
380.64 |
647.66 |
488.11 |
|
Financial Assets |
|||||
|
Investments |
7755.55 |
20221.87 |
19674.94 |
11216.19 |
10608.82 |
|
Loans |
138 |
170.88 |
46.08 |
||
|
Other financial assets- bank deposits |
202.5 |
321.39 |
130.52 |
||
|
Deferred tax assets (net) |
340.26 |
||||
|
Non-current tax assets (net) |
101.74 |
98.84 |
21.16 |
75.7 |
55.85 |
|
Other non-current assets |
126.89 |
63.81 |
39.19 |
62.68 |
24.63 |
|
Total Non Current Assets |
20074.15 |
31817.62 |
32265.34 |
24827.42 |
22294.97 |
|
Current Assets |
|||||
|
Financial Assets: |
|||||
|
Investments |
19091.16 |
27243.52 |
31182.12 |
60064.81 |
114202.63 |
|
Trade Receivables |
21.59 |
4588.65 |
18.54 |
319.55 |
8737.11 |
|
Cash and cash equivalent |
5310.31 |
5081.51 |
1285.88 |
4604.67 |
22417.55 |
|
Bank balances other than cash and cash equivalent |
6126.07 |
1680.02 |
1478.24 |
5782.1 |
846.31 |
|
Loans |
2.94 |
3.24 |
208.16 |
||
|
Other financial assets- Other recoverable |
6700.99 |
13.12 |
29.79 |
207.03 |
324.72 |
|
Other current assets |
99.29 |
128.53 |
257.7 |
2710.33 |
795.95 |
|
Total Current Assets |
37352.35 |
38738.59 |
34460.43 |
73688.49 |
147324.27 |
|
Total Assets |
57426.5 |
70556.21 |
66725.77 |
98515.91 |
169619.24 |
|
EQUITIES & LIABILITIES |
|||||
|
Equity |
|||||
|
Equity share capital |
3016 |
3019.19 |
2983.24 |
2985.04 |
8977.88 |
|
Instruments entirely equity in nature |
|||||
|
Other equity |
25356.39 |
34007.71 |
35811.92 |
49626.01 |
61363.11 |
|
Equity Attributable to the Owners |
28372.39 |
37026.9 |
38795.16 |
52611.05 |
70340.99 |
|
Non controlling Interest |
2968.99 |
||||
|
Total Equity |
28372.39 |
37026.9 |
38795.16 |
55580.04 |
70340.99 |
|
Liabilities: |
|||||
|
Non Current Liabilities |
|||||
|
Financial Liabilities |
|||||
|
Lease Liabalities |
1169.62 |
1000.86 |
799.54 |
||
|
Other financial liabilities |
128.28 |
171.6 |
191.57 |
146.35 |
94.62 |
|
Provisions |
262.8 |
365.23 |
570.88 |
749.63 |
779.42 |
|
Deferred tax liabilities (net) |
1467.51 |
2441.28 |
2442.97 |
2698.2 |
2225.11 |
|
Other non-current liabilities |
14.29 |
16.9 |
17.57 |
115.55 |
9.34 |
|
Total Non Current Liabilities |
1872.88 |
2995.01 |
4392.61 |
4710.59 |
3908.03 |
|
Current Liabilities |
|||||
|
Financial Liabilities |
|||||
|
Lease Liabilities |
221.34 |
172.29 |
201.32 |
||
|
Trade payables |
8462.98 |
13382.63 |
7657.25 |
16590.47 |
63516.6 |
|
Other financial liabilities |
16559.7 |
15355.67 |
13720.38 |
19058.73 |
29243.72 |
|
Current tax liabilities (net) |
522.9 |
272.63 |
264.53 |
422.78 |
342.42 |
|
Provisions |
16.95 |
35.74 |
8.93 |
11.2 |
45.75 |
|
Other current liabilities |
1618.7 |
1487.63 |
1665.57 |
1969.81 |
2020.41 |
|
Total Current Liabilities |
27181.23 |
30534.3 |
23538 |
38225.28 |
95370.22 |
|
Total Equity and Liabilities |
57426.5 |
70556.21 |
66725.77 |
98515.91 |
169619.24 |
Industry Overview
-
India is the world's third-largest producer and second-largest consumer of electricity, with 395.07GW installed capacity as of January 2022.
-
Increased industrial activity will drive up energy demand, while a growing population, increased electrification, and per-capita usage will provide additional support.
-
17 of the 20 fastest-growing cities in the world are in India. As a result, the per capita consumption of electricity in India has doubled since the year 2000 and the momentum is expected to continue till 2025 and beyond.
-
The government earmarked ₹19,500 crore (the US $2.57 billion) in the Union Budget 2022-23 for a PLI scheme to stimulate the manufacturing of high-efficiency solar modules.
-
In terms of demand growth, electricity demand growth slowed down in the financial year 2020 due to the impact of COVID-19 and associated lockdowns. The demand growth however rebounded post the easing of restrictions. YOY growth of electricity consumption is 7.8% for the financial year 2022.
-
India is now a power-sufficient country, with peak demand at 203 GW and installed capacity of 399 GW as of 31 March 2022, with thermal capacity accounting for 59% of total capacity.
-
Electricity consumption is an important indicator of a country's level of development. It is an essential component of a country's overall development and is critical for accelerated economic growth. It is an urgent need of the day to provide dependable and high-quality power in an efficient manner.
-
All regional grids are synchronously connected for a smooth flow of power resulting in “One Nation – One Grid – One Frequency”. At present, the interregional transmission capacity of the National Grid is more than 112 GW which has grown by over 15% CAGR over the past 8 years.
-
The distribution network also needs to be upgraded and augmented on a regular basis, which is being done by the distribution companies. The Central Government is also assisting states in the creation/argumentation of distribution infrastructure through various schemes such as the Deen Dayal Upadhyaya Gram Jyoti Yojana (DDUGJY) and the Integrated Power Development Scheme (IPDS), allowing them to meet the goal of providing uninterrupted power supply to all consumers.
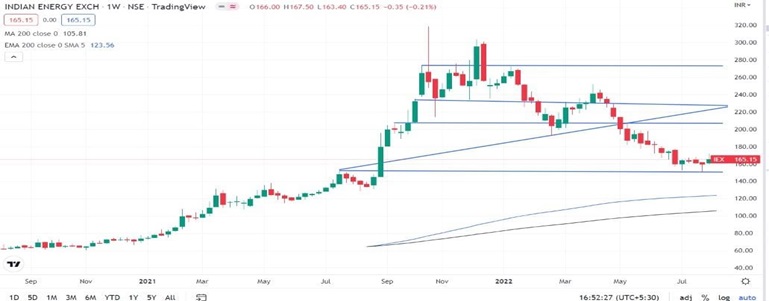
Indian Energy Exchange Limited - Technical Analysis
-
Stock is trading above EMA 200 and MA 200 indicators, with a strong support level of ₹152 and a resistance level at ₹233.
-
One can accumulate this share at the current price.
Recommendation Rationale:
-
For the FY22, Indian Energy Exchange Limited’s revenue increased to ₹43,103.51 Lakhs, compared to the previous year of ₹31,785.06 Lakhs. It also registered a net Profit After Tax of ₹30,121.54 Lakhs compared to the last year at ₹20,543.12 Lakhs.
-
IEX enjoys monopoly status in the industry. There are two energy exchanges in India, IEX and PXIL where electricity is traded and IEX enjoys a market share of more than 95%.
-
The company has generated positive EPS of ₹3.35 and ₹6.88 in the last couple of years.
-
The company has a debt-free balance sheet with cash & investments to the tune of 33,820 Lakhs.
-
On June 27, 2022, IEX successfully launched the much-anticipated Longer Duration Contracts up to 90 days on the
-
Exchange, bolstering its presence in the short-term market.
-
In addition, the company launched Hindustan Power Exchange, which will increase competition and volume in the short to medium term due to promotional offers.
-
The Exchange is now preparing to enter new markets such as Ancillary Markets, Capacity Markets, and Gross Bidding Contracts, and is optimistic about getting started as soon as possible.
Valuation
-
The company’s revenue has increased at a CAGR of 35.61% from FY 2019-to 2022.
-
For 2022, the company’s ROE and ROCE were 47.84% and 59.43%.
-
Q1FY2023 results got impacted due to the global crisis amid the war tension and the increase in the inflation level.
-
Based on the company's performance in FY22, we anticipate higher revenue for the current fiscal year (2023) compared to the previous year.
-
We used data from the previous five years (2018-2022) to forecast revenue for fiscal years 2023-2027. Revenue growth of 15% is assumed.
Indian Energy Exchange Limited - Estimated Income Statement (₹ in Lakhs):
|
|
Mar-23 |
Mar-24 |
Mar-25 |
Mar-26 |
Mar-27 |
|
|
2023-E |
2024-E |
2025-E |
2026-E |
2027-E |
|
Revenue |
55,012.44 |
62,556.66 |
71,218.37 |
81,164.89 |
92,588.67 |
|
Employee Expenses |
5,861.61 |
6,131.56 |
7,401.64 |
8,310.44 |
9,672.84 |
|
Other Expenses |
3,253.98 |
3,565.39 |
4,201.80 |
4,773.65 |
5,523.29 |
|
EBITDA |
45,896.85 |
52,859.71 |
59,614.93 |
68,080.80 |
77,392.55 |
|
Depreciation |
4,658.09 |
4,659.09 |
4,660.09 |
4,661.09 |
4,662.09 |
|
EBIT |
44,301.20 |
51,297.59 |
58,051.07 |
66,480.58 |
75,721.23 |
|
Financial Cost |
218.84 |
253.40 |
286.76 |
328.40 |
374.05 |
|
EBT |
44,082.36 |
51,044.19 |
57,764.31 |
66,152.18 |
75,347.18 |
|
Tax expenses |
10,704.69 |
12,395.26 |
14,027.13 |
16,063.99 |
18,296.84 |
|
PAT |
33,377.67 |
38,648.94 |
43,737.18 |
50,088.20 |
57,050.34 |
-
We initiate coverage on Indian Energy Exchange Limited with a “BUY” and a 1-year Target Price of 210.
Disclaimer: This report is only for the information of our customer Recommendations, opinions, or suggestions are given with the understanding that readers acting on this information assume all risks involved. The information provided herein is not to be construed as an offer to buy or sell securities of any kind.
- Share :


Post a Comment
|
DISCLAIMER |
This report is only for the information of our customers. Recommendations, opinions, or suggestions are given with the understanding that readers acting on this information assume all risks involved. The information provided herein is not to be construed as an offer to buy or sell securities of any kind. ATS and/or its group companies do not as assume any responsibility or liability resulting from the use of such information.