INTELLECT DESIGN ARENA
Intellect Design Arena Ltd is engaged in the financial software development. The Company provides services to Global Consumer Banking, Central Banking, Risk & Treasury Management, Global Transaction Banking and Insurance.
|
Key Parameters |
|
|
BSE Code |
538835 |
|
NSE Code |
INTELLECT |
|
Reuters Code |
INEE.NS |
|
INCEPTION |
|
|
IPO |
2015 |
|
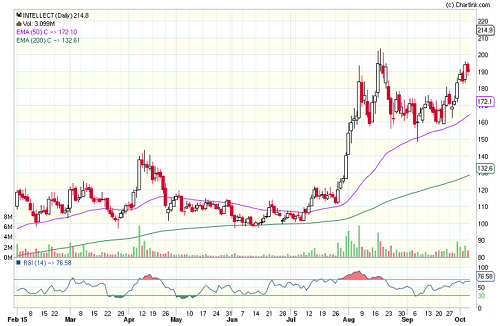
CMP (as on 23/09/2015) |
185 |
|
Stock Beta |
1.7 |
|
52 Week H/L |
69.25 / 217.90 |
|
Market Cap (Cr) |
1859 |
|
Equity Capital (Rs cr) |
50.10 |
|
Face Value (Rs) |
5.00 |
|
Average Volume |
23,12,458 |
|
|
|
|
Shareholding Pattern (%) |
|
|
Promoters |
32.13 |
|
Non Institutions |
25.14 |
|
Public |
33.97 |
|
Grand Total |
100.00 |
Intellect Design Arena Ltd - Potential Catalysts
-
Improvement in execution, stabilization of margins, peaking of working capital cycle, and cash flow improvement
-
Strong franchise will help offset some of its leverage creep
-
New Technology and apps to banking and corporations.
Intellect Design Arena Ltd - Recommendation
With Superior project management skills, focus on measuring and monitoring quality and its planned expansion Intellect Design Arena Ltd will be able to grow over the next few years. We recommend BUY on the stock at CMP of Rs. 185 to target of Rs. 242.
Intellect Design Arena Ltd - Financial Summary
|
Quarterly Income Statement |
201412 |
201503 |
201506 |
201509 E |
|
Revenue |
170.43 |
168.36 |
197.47 |
250.16 |
|
EBIDTA |
-10.65 |
-25.45 |
-6.51 |
33.24 |
|
EBIT |
-15.35 |
-30.05 |
-11.48 |
26.43 |
|
Adjusted PAT |
-16.41 |
-29.66 |
-11.12 |
17.45 |
|
EPS |
-1.64 |
-2.97 |
-1.11 |
1.74 |
|
EBIDTA Margin |
- |
- |
- |
13.62% |
|
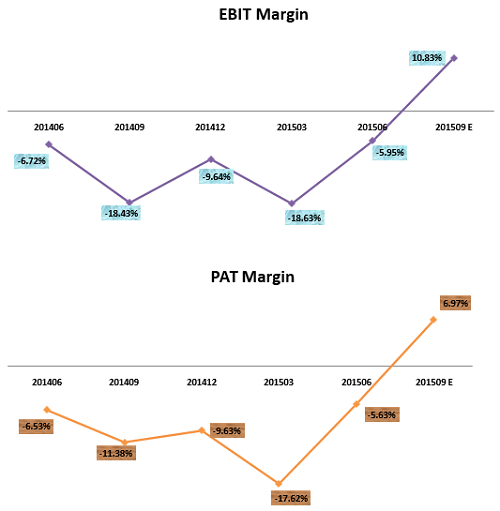
EBIT Margin |
- |
- |
- |
10.83% |
|
PAT Margin |
- |
- |
- |
6.97% |
BUSINESS DISCRIPTION
Intellect Design Arena Limited is an India-based company, which is engaged in providing financial technology for banking, insurance and other financial services. Its products portfolio includes global consumer banking, central banking, risk and treasury management, global transaction banking, and insurance. Intellect's global consumer banking (GCB) focuses on consumer banking, including retail banking, private banking, capital markets and asset management.
The Company's central banking provides banking solution for central banks. Its risk and treasury management (RTM) is a performance platform that covers the trade cycle. Its global transaction banking (GTB) is a global transaction banking platform. The Company's Intellect SEEC provides insurance software with a portfolio covering distribution, underwriting and claims. The Company is also engaged in the business of software development.
MANAGEMENT & GOVERNANCE
|
Name |
Designation |
|
Venkatarathnam Balaraman |
Director |
|
Ashok Jhunjhunwala |
Director |
|
Arun Jain |
Managing Director |
|
ANIL KUMAR VERMA |
Executive Director |
|
Aruna Krishnamurthy Rao |
Director |
|
Naresh Vudali Venkata |
Company Secretary |
|
Executives Name |
Designation |
|
Naresh Vudali Venkata |
Company Secretary |
|
Subramaniam Swaminathan |
Chief Financial Officer |
Shareholding pattern as on 30thJune, 2015
|
EQUITY - FUND HOLDINGS (in %) |
2014-Dec |
2015-Jun |
2015-Mar |
|
Promoters |
32.2 |
32.02 |
32.13 |
|
Institutional investors |
25.75 |
25.44 |
25.14 |
|
Public |
28.39 |
33.84 |
33.97 |
|
Others |
13.66 |
8.7 |
8.76 |
EQUITY - FUND HOLDINGS (in %)
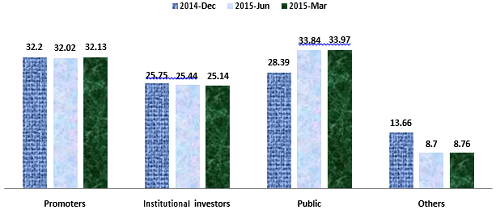
Rakesh Jhunjhunwala also hike its stake in Intellect Design Arena Ltd to 6% from 3.75% in September quarter.
INDUSTRY OUTLOOK
Enterprise software is in the midst of a revolution. Today, everyone's a power user. 2014 was all about the “consumerization” of enterprise software -- software companies redefining the user experience to make technology more closely resemble consumer applications. This will continue in this year as developers move away from a purely utilitarian approach to creating software that’s more intuitive, more user-friendly and able to cater to users’ changing needs.
TRENDS IN DEMAND ENVIRONMENT Enterprise Software
-
Gartner estimate the $310bn spend in 2015 growing to $396bn in 2019
-
IT Services – Applications Services (Implementation) worth $158bn in 2015, growing to $177bn in 2019
-
Digitalization – $170bn market growth from 2014-2019. $36bn in digital consulting and implementation, $13bn in digital consulting
-
Increased investment – CEOs intend to raise investment in IT and Digital Capabilities more than any other aspect of their business in 2015.
Increase in global technology spending and opportunities created through adoption of disruptive technologies are expected to propel growth in FY2015. NASSCOM expects the industry to clock export revenues of USD 84-87 billion maintaining a growth rate of 12-14 per cent. Domestic revenues will also grow at a rate of 13-15 per cent and are expected to reach INR 1180-1200 bn.
INVESTMENT RATIONALE
The company’s scale, diversity and strong franchise will help offset some of its leverage creep, as will its strong innovation program, cost-cutting initiatives and good growth prospects in international markets
Digital Proposition gains acceptance in Global Marketplace
-
Acceptance of Intellect Products in advanced markets such as North America and Europe
-
13 new wins including 2 large Digital Transformation Deals (North America, APAC)
-
Banking Veterans, Andrew England (Formerly MD, Head of Transaction Banking, Llyods) and Anand Pande (Formerly with RBS) leading digital transformation engagements in Strategic Accounts.
Revenue grew 34% YoY, stood at Rs 193 Cr
-
4 Line of Business with independent leadership for driving more predictable growth
-
LoBs serve Consumer Banking, Transaction Banking, Risk & Treasury Management and Insurance
-
Revenue crosses $30 million mark
Global Transaction Banking (iGTB)
-
Unique App based new age face of Corporate Banking
-
Acceptance of payments solutions in North America
-
Leadership for integrated GTB in Middle East. Expansion in Asia
-
Number of countries: 85
-
Customers in America and Europe: 14
-
Customers in The Middle East: 13
Global Consumer Banking (iGCB)
-
Unique Omnichannel Retail Banking Exchange using App based technologies. Single solution encompassiong Online, Mobile, Branch Banking and call center
-
Comprehensive lending platforms for SMEs with integrating Origination, Loan processing and Collections
-
Traction in Central Banking platform
-
Installations: 132
-
Countries: 36
-
Customers: 102
Risk & Treasury Management (iRTM)
-
Next generation One Treasury product. Single solution connecting front office, mid office, back office across all assets classes with integrated risk management
-
Comprehensive Basel III Liquidity Risk Management (LRM) prduct. Launch “One LRM” in Sept, 2015.
-
Countries: 18
-
Customers: 46
Insurance (Intellect SEEC)
-
Digital underwriting using Social Media, Big Data and Artificial Intelligence
-
Exclusive partnership with Outside IQ to deliver the most advanced Risk Discovery tool in the Insurance Industry
-
Large deal won in North America for Digital Distribution
-
Countries: 27
Expect improvement in execution, stabilization of margins, peaking of working capital cycle, and cash flow improvement
Gross Margin sustained at over 50% level over last 12 quarters
-
R&D cost contained within $20 million annually
-
S & M at 19.18% of revenues in Q1 vs 32.35% in Q4 FY15
USD 2.5 million in the last quarter, which spilled over contributed. Otherwise it would have been more straight growth of 10-15 percent quarter-on-quarters (Q-o-Q). Now, it becomes 20 percent growth Q-o-Q. That is where it has helped this quarter to be sharply better than last quarter.
We think the focus is market leadership than margin building for the next three years. At this juncture operating margin metrics is most important. It has maintained more than 50 percent operating metrics. It improved by 300 bps in last quarter to this quarter where the operating margins used to be 48.5 percent or 51 percent level. That is where you should put your eye on, rest of the things are constant.
Management says “ The first quarter has been a good start to this financial year. In the first year of independent operations since the demerger from Polaris and public listing, we focused on designing the business model for predictable, profitable growth. We made the right investments to position us to ride the Digital wave and partner banks, financial institutions and insurance companies for their digital transformation programs. We are building four robust business, providing the digital edge to Consumer banking, Transaction banking, Risk & Treasury and Insurance. We have equipped the business with the right leadership capacity to drive product leadership. The acceptance of our New- age products in advanced markets such as North America and Europe, as well as winning two significant digital transformation deals in North America and APAC is extremely encouraging.”
“We are on track to meet our guidance of revenue growth of 22% to 26% this year. There has been a significant reduction in losses from Rs. 29 crore in the previous quarter to Rs. 11 crore in quarter one. We are managing investments in digital platforms and market opportunities for sustained growth.”
Revenue Distribution - 49% from Advanced Markets
|
Q1 FY16 |
|
|
US |
19% |
|
Europe |
30% |
|
India |
16% |
|
Rest of the World |
35% |
|
Q1 FY15 |
|
|
US |
17% |
|
Europe |
31% |
|
India |
14% |
|
Rest of the World |
39% |
Revenue DistribuMon - 35% from License & AMC
|
Q1 FY16 LTM |
|
|
License + AMC |
35% |
|
Implementation |
65% |
|
Q1 FY15 LTM |
|
|
License + AMC |
33% |
|
Implementation |
67% |
VALUATION
Intellect Design Arena Ltd is currently trading at 185 per share with a market capitalization of 1859 Crores. It has total debt of about 9 Cr. It has total cash and bank balance of 106 Cr.
We value Intellect Design Arena Ltd using DCF at price target of 242 for FY16 with expected growth rate at 21.6% per annum. For valuation we assume that over the period company will keep capital structure unaltered and tax rate unchanged.
|
|
Rolta India |
Mindtree |
KPIT Tech. |
Cyient |
Zensar Tech. |
|
LTP |
107.15 |
1403.25 |
116.7 |
625.65 |
986.2 |
|
(in Cr.) |
201503 |
201503 |
201503 |
201503 |
201503 |
|
View in (Million) |
|
|
|
|
|
|
Sales |
3679.46 |
3561.9 |
2989.92 |
2735.93 |
2655.78 |
|
PAT |
245.17 |
536.3 |
236.99 |
335.93 |
264.63 |
|
Equity |
161.33 |
83.7 |
37.61 |
56.18 |
44.33 |
|
OPM % |
35.93 |
22.25 |
11.98 |
19.1 |
15.76 |
|
NPM % |
6.66 |
15.06 |
7.93 |
12.28 |
9.96 |
|
EPS |
14.59 |
60.6 |
12.37 |
28.36 |
57.58 |
|
PE |
10.69 |
20.36 |
15.62 |
16.84 |
10.75 |
|
P/BV |
2.09 |
5.43 |
2.86 |
3.07 |
2.46 |
|
P/EPS |
3.02 |
17.12 |
11.49 |
13.33 |
9.29 |
|
BV |
77.77 |
240.43 |
68.88 |
164.12 |
261.01 |
CONCUSSION AND RECOMMENDATION
With Superior project management skills, focus on measuring and monitoring quality and its planned expansion INTELLECT will be able to grow over the next few years. We recommend BUY on the stock at CMP of Rs. 185 to target of Rs. 242.
RISKS AND CONCERNS
-
Critical “Enterprise Sales” leading to longer Sales Cycle.
-
Designing a predictable revenue model
FINANCIALS
Intellect Design Arena Ltd. key Products/Revenue Segments include Software Products which contributed Rs 453.10 Cr to Sales Value (100.00% of Total Sales), for the year ending 31-Mar-2015.
For the quarter ended 30-Jun-2015, the company has reported a Standalone sales of Rs. 120.94 Cr., down -2.53% from last quarter Sales of Rs. 124.08 Cr. and up 12.98% from last year same quarter Sales of Rs. 107.05 Cr. Company has reported net profit after tax of Rs. -4.23 Cr. in latest quarter.
CRISIL has assigned its 'CRISIL A2' rating to the Rs.1.8 billion short-term non-convertible debenture (NCD) programme of Intellect Design Arena Ltd (IDAL). The rating reflects IDAL's healthy financial risk profile, driven by strong net worth, marginal debt and ample liquidity. The ratings also factor in the company's successful track record in development and delivery of software products, and its experienced management and strong client base. These rating strengths are partially offset by IDAL's modest scale of operations, subdued operating profitability, and high dependence on a single vertical'the banking, financial services, and insurance (BFSI) domain.
IDAL's financial risk profile is driven by its a strong net worth of Rs.6.48 billion, marginal debt, and cash and bank balance of Rs.2.73 billion as on December 31, 2014. The company has nil long-term debt.CRISIL understands that a part of the cash surplus available with the company has been apportioned for redemption of the rated NCD, which will be redeemed within three months of allotment.
During 2014-15 (refers to financial year, April 1 to March 31), the products business undertaking of Polaris Consulting Service Ltd (Polaris; formerly Polaris Financial Technology Ltd) was demerged and transferred to and vested in IDAL. As per the scheme of arrangement and demerger, each shareholder in Polaris received one share of IDAL for a share of Polaris. IDAL's shareholders were given option to exit wherein they can choose to receive fully secured, redeemable NCDs of face value Rs.42 in lieu of each equity share held by them. CRISIL notes that each share of IDAL is currently trading at Rs.115 (as on January 28, 2015). In case the shareholders opt for the NCDs, CRISIL believes that the cash surplus available will more than sufficient for the redemption of the proposed short-term NCDs of Rs.1.8 billion.
IDAL's scale of operations remains modest, with revenue of Rs.2.8 billion for the six months ended September 30, 2014. The company has a high dependence of revenue from the BFSI vertical which renders its revenue growth volatile and susceptible to cyclicality in the global financial sector. However, this is partially offset by IDAL's diverse client base and geographical diversification. Currently, the product business has been reporting losses at earnings before interest, tax, depreciation and amortisation (EBITDA) level, after factoring in the research and development (R&D) expenditure (which is expensed by the company). The EBITDA, before R&D expense, is also moderate at about 10 per cent as sales and marketing (S&M) expenditure remain high to support the growth strategy. CRISIL believes that IDAL's ability to leverage its product base and strong clientele to drive revenue and profitability will be key rating sensitivity factors.
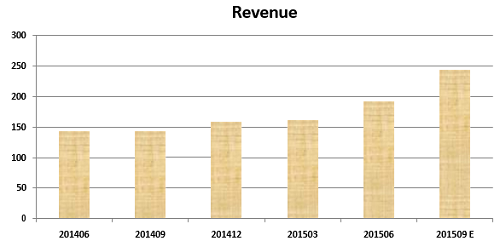
|
Quarterly Income Statement |
201406 |
201409 |
201412 |
201503 |
201506 |
201509 E |
|
Net Sales |
143.62 |
143.83 |
159.22 |
161.26 |
192.93 |
244.01 |
|
Other Income |
6.83 |
8.4 |
10.39 |
7.11 |
4.55 |
6.15 |
|
Total Income |
150.45 |
152.24 |
170.43 |
168.36 |
197.47 |
250.16 |
|
Total Expenditure |
154.91 |
174.23 |
181.08 |
193.81 |
203.98 |
216.918 |
|
EBIDTA |
-4.46 |
-21.99 |
-10.65 |
-25.45 |
-6.51 |
33.24 |
|
Depreciation |
5.19 |
4.52 |
4.7 |
4.6 |
4.97 |
6.81 |
|
EBIT |
-9.65 |
-26.51 |
-15.35 |
-30.05 |
-11.48 |
26.43 |
|
Interest |
0.14 |
0.2 |
0.24 |
0.23 |
0.25 |
0.00 |
|
PBT |
-9.79 |
-26.71 |
-15.59 |
-30.28 |
-11.73 |
26.43 |
|
Tax |
0.04 |
0.38 |
0.82 |
0.51 |
-0.07 |
8.99 |
|
Deferred Tax |
- |
- |
- |
- |
- |
0.00 |
|
Adjusted Profit After Tax |
-9.83 |
-27.09 |
-16.41 |
-30.79 |
-11.66 |
17.45 |
|
Minority Interest After NP |
- |
- |
- |
0.01 |
- |
0.00 |
|
Profit/Loss of Associate Company |
- |
- |
- |
1.14 |
0.54 |
0.00 |
|
Adjusted Profit After Extra-ordinary item |
-9.83 |
-17.32 |
-16.41 |
-29.66 |
-11.12 |
17.45 |
|
|
||||||
|
Outstanding Shares |
|
|
|
|
100510000 |
100510000 |
|
EPS |
-0.99 |
-2.72 |
-1.64 |
-2.97 |
-1.11 |
1.74 |
|
|
||||||
|
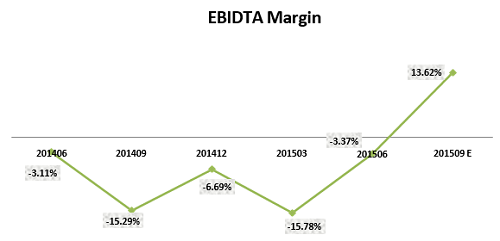
EBIDTA Margin |
- |
- |
- |
- |
- |
13.62% |
|
EBIT Margin |
- |
- |
- |
- |
- |
10.83% |
|
PAT Margin |
- |
- |
- |
- |
- |
6.97% |
- Share :


Post a Comment
|
DISCLAIMER |
This report is only for the information of our customers. Recommendations, opinions, or suggestions are given with the understanding that readers acting on this information assume all risks involved. The information provided herein is not to be construed as an offer to buy or sell securities of any kind. ATS and/or its group companies do not as assume any responsibility or liability resulting from the use of such information.