JBF Industries
JBF Industries Limited - Background
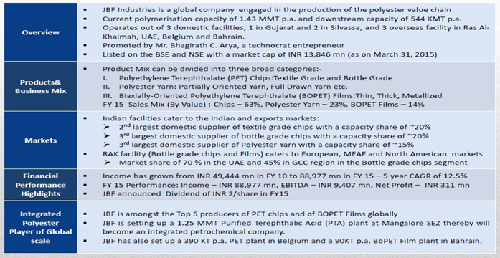
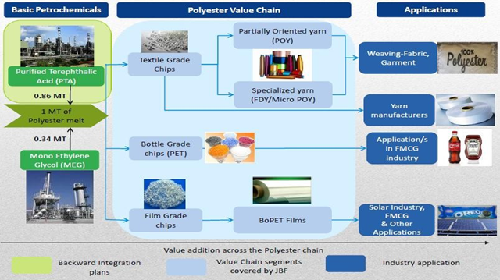
JBF Industries Limited is an India-based company, which manufactures polyester chips, polyester yarn and processed yarn from polyester chips. The company is focused on the polyester part of the textile value chain and has backward integrated into manufacturing Partially Oriented Yarn (POY), Polyester (BOPET) Film and also various types of Bottle grade, Film grade and Textile grade Polyester chips. Currently operates with three domestic production capacities one in Gujarat and two in Silvassa and three overseas facilities in Ras Al-Khaimah, UAE, Belgium, and Bahrain. It has client base spread across multiple geographies in European, African, Middle East and Indian Markets. It also offers fully draw yarn, polyester textured yarn and sewing thread. It has manufacturing facilities in India and the United Arab Emirates.
|
Key Parameters |
|
|
BSE Code |
514034 |
|
NSE Code |
JBFIND |
|
Reuters Code |
JBFI.ND |
|
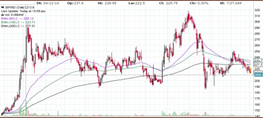
CMP (as on 03/11/2015) |
213.55 |
|
Stock Beta |
1.08 |
|
52 Week H/L |
318.40/147.08 |
|
Market Cap (Cr) |
1398.40 |
|
Equity Capital (Rs cr) |
80.41 |
|
Face Value (Rs) |
10 |
|
Average Volume |
427279 |
|
|
|
|
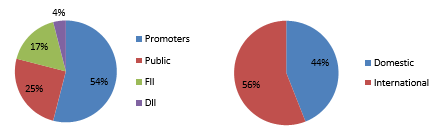
Shareholding Pattern (%) |
|
|
Promoters |
54 |
|
Non Institutions |
46 |
|
Grand Total |
100 |
JBF Industries Limited - Investment Rationale
-
Increase in demand to aid growth
-
Aggressive capex plans
-
Reduction in cost of production
-
Backward integration to aid margins
-
Tax benefits
JBF Industries Limited - Risks and Concerns
-
Competition from unorganized sector
-
Forex fluctuations
-
Varying manufacturing cost
Conclusion & Recommendation
JBF Industries Limited being a prominent player in both domestic and international polyester chips and yarn market with its high quality products and wide market reach in both India and abroad. With the favorable market outlook and available market opportunities, we expect JBF to perform considerable well in the medium term and long term
At the current market price of Rs.213.55 the stock is trading at ~5x FY17E EPS. Investors could buy the stock at CMP and add on dips to around Rs.190 o Rs.188 levels (~4x FY17E EPS) for our sequential targets of Rs.259 and Rs.316 (~6 xs to ~7x FY17E EPS).
JBF Industries Limited - Financial Summary
|
Particulars (Rs. in Crs) |
FY13 |
FY14 |
FY15 |
FY16E |
FY17E |
|
Net Sales |
7449.67 |
8559.6 |
8869.79 |
12062.91 |
16164.31 |
|
Operating Profit |
693.67 |
706.56 |
940.75 |
1450.83 |
2104.8 |
|
PAT |
113.48 |
5.71 |
31.09 |
133.15 |
355.67 |
|
EPS (Rs.) |
14.11 |
0.71 |
3.87 |
16.56 |
44.23 |
|
PE |
15.14 |
300.94 |
55.27 |
12.91 |
4.83 |
JBF Industries Limited - Company Profile
Company Overview
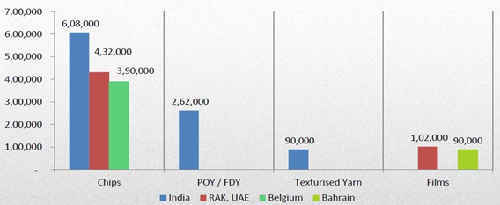
Production capacities (FY15)
Shareholding Pattern
Business Value Chain
Investment Rationale
Increase in demand to aid growth
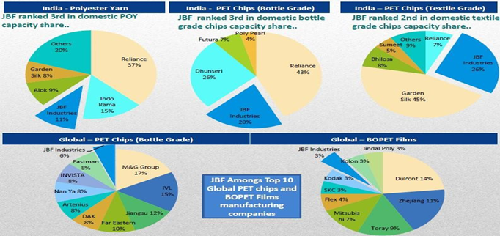
JBF Industries Limited is one of the leading global Polyester value chain companies. The company is amongst the Top 5 Domestic market leaders in Textile grade chips, Bottle grade chips and Partially Oriented Yarn. Internationally also, JBF Industries Ltd is amongst the Top 10 manufacturers of Bottle grade chips and Polyester Films. The increase in demand for the polestar yarns and polestar chips can help the company to make better capacity utilization of the current facilities and the undergoing capex plans. The increase in demand for the products in United States and European Union countries can further add to the growth opportunities of the company as major part of the company’s revenue comes from sales outside India. Favorable demographics with young population, increase in disposable income and increase in demand for textiles, packed foods and breweries will supplement the growth of the company
Aggressive capex plans
JBF Industries Limited has planned capex of $1 billion (Rs 6,500 crore) - of which US$200mn each for film/chip plants and US$600mn for its Purified Terepthalic Acid (PTA) plant. As demand for plastic products goes up, JBF is expected to be one of the few companies which would benefit. Its 90,000- tonne film plant in Bahrain and 390,000-tonne chip plant in Belgium went on stream from third quarter of the last fiscal. Its 1.25 MT PTA plant at Mangalore will be commissioned in December 20. These capex initiatives are expected to make a considerable impact on the revenues and profits of the company by the second half of FY2016. JBF could generate it $4bn of revenue by FY17 from currently $1.7bn (non adjusted inter-segmental revenues). Significant cost savings will help improve EBITDA margin to ~13-14% by FY17. The management is also of the view that the strategic capacity additions will also help in significant save on working capital (lower inventory by 5-7 days and also receivables days).
Reduction in cost of production
With the fall in crude oil prices, its working capital requirement will reduce significantly, which will ease the high debt equity ratio and also reduce interest costs to that extent. Raw material costs accounted for 70~% of FY15 net sales. The costs of most of the raw materials like pure terephthalic acid or PTA (69.8% of raw material consumption) and mono ethylene glycol or MEG (25.6%l) are linked to crude oil prices. Therefore, the fall in Indian crude oil price and favorable price forecast of crude will boost gross margin of the company and is expected to maintain healthy margins in the foreseeable period of time.
Backward integration to aid margins
After commencement PTA plant JBF Industries Limited would become the only PTA integrated Polyester Company in India other than Reliance Industries Ltd. JBF’s current total PTA requirement is more than 800,000 MT p.a. JBF’s Mangalore PTA plant would be able to meet all of JBF’s internal PTA requirement. Excess capacity will be sold in the open market. This backward integration will help stabilize raw material requirement of JBF Industries Ltd which has requirement of 800KTPA of PTA for its existing capacities. And the company maintains an average of 10-15 days of inventory, this would reduce to less than 5 days Imports to JBF RAK and India take ~3-4 weeks delivery time currently, which would reduce to 3-5 days to RAK and 1-2 days to India. JBF is expected to save ~ $40-$50 per ton in freight for its RAK facility, due to reduction in logistical costs that it incurs currently by procuring it in UAE and sending it to South East Asia to convert it into PTA and JBF India's operation is expected to save ~$15-$20 per ton on logistical costs of PTA imports. Significantly lower capital and operating costs compared to conventional PTA plants Relies on proprietary technology to deliver 75% lower water discharge, 65% lower GHG emissions, and 95% lower solid waste generation than conventional PTA plants.
Tax benefits
Ras Al-Khaimah, facility in UAE for PET Chips and BOPET Films is located in Tax free and no export duty zone. It will help to tap growth potential of the MEAF and GCC markets, which are the fastest growing PET markets in the world with more than 10% growth YoY. First mover advantage in the Middle East region has helped secure preferred supplier contracts for bottle grade chips Expansion into higher value added products like Thick films and Metallised films. As a result, ~75% of revenues will be tax free and will witness full effect in P&L from FY17 onwards, as all the additional capacity will be up by Mid-FY16.This will add revenue and profit margins of the company as it have higher exchange rates with no tax burden associated tax.
Clients to acts as quasi partners
JBF’s clientele includes CocoCola, Welspun Industries, has a long standing relationship with the company, which will act as quasi partners to the company. The increase in demand or growth for its clients in Textiles, Food and breweries, Film or Yarn will add to the revenues and growth prospects of the company.
Industry Profile
Polyethylene Terephthalate (PET) is a plastic polymer produced by reacting two raw materials, Purified Terephthalic Acid (PTA) & Monoethylene Glycol (MEG), whereas Polybutylene Terephthalate (PBT) is manufactured from PTA and BDO (1, 4-butanediol). These resins are used for manufacturing plastic and plastic components, which have wide applications in bottling, textile, electronics and automobile industry. India's PET market continues to be dominated by PET bottles, followed by PET films, sheets and chips, and the trend is expected to continue over the next five years. PET bottles are being increasing used for packaging of bottled drinking water, carbonated soft drinks, edible oils, juices, alcoholic beverages, etc.
On the other hand, PBT resin market in India continues to be commanded by electrical and electronics industry. Technological advancements in the electrical and electronics industry coupled with emergence and growing adoption of innovative electrical solutions like CFLs and LEDs over the last few years is further boosting PBT resin sales in the country. Apart from electrical and electronics industry, Optical Fibre Cables (OFC) and automobile industry are other major end users of PBT resin industry.
The PET & PBT resins market in India is expected to surpass USD1.9 billion in 2015. India PET market is highly consolidated with Reliance Industries Limited (RIL), JBF Industries Limited and Dhunseri Petrochem Limited accounting for over 90% of the market share. Over the last few years, these PET majors in India have been increasing their focus on backward integration to increase their profit margins and address concerns associated with irregular supply of raw materials. In contrast, the country's PBT market is highly fragmented with non-branded players accounting for a significant market share. Few of the major PBT players operating in the country include Toray BASF, SABIC, SRF, DuPont and Laxness.
After tough competition from cotton last year, the manmade yarn and fabric industry is expected to grow at a higher rate of five to seven per cent in 2015-16, on the back of stable crude oil prices. However, it is the domestic market that will see the larger growth, as Indian synthetic yarn and fabric performance has not been one of the best internationally. While companies in the segment are not expecting much from exports, the domestic market might bring back some sheen. While normal growth of five to seven per cent is anticipated, if the economy does well, this could go up to double-digit growth. In 2014-15, demand for most manmade filament & fibre was subdued due to a decline in prices of cotton yarn. Also, says a report, the levy in July 2014 of anti-dumping duty on import of purified terephthalic acid (PTA), a major input, further hit domestic production of polyester filament yarn. Unlike the seasonality for cotton, synthetic textile products can be produced through the year. Also, there is expected to be more consumer demand for woven and non-woven synthetic textiles, and the industry anticipates equal growth in the synthetic yarn and fabric market in both segments
Demand recovery for manmade filament, fibre, yarn and fabric in 2015-16 is likely to be backed by an increase in off take by apparel manufacturers. The apparel segment consumes a little more than half of the total synthetic fibre produced by the industry. Manufacturers of home textiles and technical textiles are also expected to increase the usage of synthetic fibres during the year. Also, with crude oil prices expected to remain stable, PTA and mono-ethylene glycol prices are likely to come down, too, leading to a decline in polyester prices by eight to 12 per cent this year. Domestic and international prices of both the polyester raw materials had plunged in the latter half of 2014-15, led by a steep decline in crude oil prices. So, polyester prices had corrected sharply during the period. This year, however, crude oil prices are expected to remain stable. Also, market demand for polyester is likely to rise by five to seven per cent.
It is to be recognized that the textile industry in India contributes about 14% to Industrial production, 6% to GDP, and 17% by way of exports earnings and employs 35 Million workforce. As per the vision documents of the government, domestic production should grow by about 5 times and exports by about 7 times by 2025. Such targets set up a pattern for high growth within the industry and industry can take lead under the drive of “Make in India” campaign.
Major players and market share
For various reasons the man made fire industry in India has been stifled with high excise as compared to the competing fibres. The world average continues to be 60% for non cotton items and 40% for cotton items. However, in India it is the other way – 40% for non cotton items and 60% for cotton items. In order that our industry be given due recognition and importance, several representation have been made to the Government for reducing the excise duty structure and providing other stimulus, in order that the industries in India can compete well both at the national front as well as the export front. The industry is optimistic that the government will give due relief in taxation to the needs of the industry and will provide adequate stimulus to achieve the ambitious target set for the year 2025. Several representations have also been made that the industry should move towards fibre neutral excise duty regime, more or less on same lines with competing countries in so far as excise is concerned. The local industries are also striving to come up with strategic developments and technological improvements throughout the polyester chain, either by introduction of world scale plants with latest technologies as well as coming up with diversified and specialized products. Various applications can be evolved for industrial usage and nontraditional usage such as sportswear and specialized wear usages. Lot of developments have also taken place for development of specialty fibres for example coloured yarn, diversified cross sectional yarn, high dye affinity yarn etc. All these improvements would lead\ to high growth and profitability within the industry.
Risks and Concerns
Competition from unorganized sector
There are large number unorganized players in delivering products at different standards. JBF is exposed to high completion from these players both in domestic and international markets.
Changes in manufacturing cost
JBF Industries Limited purchases the raw materials from different vendors from different countries, so the company’s profit margins is exposed to the changes in the raw material prices.
Forex fluctuations
As considerable amount of the company’s total revenue comes from export to different counties, JBF is exposed to changes in the currency exchange rates. As it can make huge impact on the company’s overall revenue and margins.
Financials
QoQ Analysis
|
|
1stQtr 201506 |
1st Qtr 201406 |
VAR % |
1stQtr 201506 |
4thQtr 201503 |
VAR % |
|
Gross Sales |
2270.18 |
2085.98 |
8.8 |
2270.18 |
2141.69 |
6.0 |
|
Net Sales |
2270.18 |
2085.98 |
8.8 |
2270.18 |
2141.69 |
6.0 |
|
Other Operating Income |
2.25 |
3.01 |
-25.2 |
2.25 |
1.7 |
32.3 |
|
Other Income |
1.79 |
0.67 |
167.2 |
1.79 |
2.76 |
-35.1 |
|
Total Income |
2274.22 |
2089.66 |
8.8 |
2274.22 |
2146.15 |
6.0 |
|
Total Expenditure |
2032.31 |
1881.16 |
8 |
2032.31 |
1912.97 |
6.2 |
|
PBIDT |
241.91 |
208.5 |
16 |
241.91 |
233.18 |
3.7 |
|
Interest |
120.97 |
94.64 |
27.8 |
120.97 |
191.28 |
-36.8 |
|
PBDT |
120.94 |
113.86 |
6.2 |
120.94 |
41.9 |
188.6 |
|
Depreciation |
87.22 |
64.9 |
34.4 |
87.22 |
79.62 |
9.5 |
|
PBT |
33.72 |
48.96 |
-31.1 |
33.72 |
-37.72 |
-189.4 |
|
Tax |
10.69 |
21.07 |
-49.3 |
10.69 |
16.34 |
-34.6 |
|
Reported Profit After Tax |
23.03 |
27.89 |
-17.4 |
23.03 |
-54.06 |
-142.6 |
|
NP afr Minority Interest & P/L Asso.Co. |
23.03 |
27.89 |
-17.4 |
23.03 |
-54.06 |
-142.6 |
|
PBIDTM(%) |
10.66 |
10 |
6.6 |
10.66 |
10.89 |
-2.1 |
|
PBDTM(%) |
5.33 |
5.46 |
-2.4 |
5.33 |
1.96 |
171.9 |
|
PATM(%) |
1.01 |
1.34 |
-24.6 |
1.01 |
-2.52 |
-140.1 |
Profit and Loss Account as per rough estimates
|
|
FY13 |
FY14 |
FY15 |
FY16E |
FY17E |
|
Gross Sales |
7449.67 |
8559.6 |
8869.79 |
12062.91 |
16164.31 |
|
Net Sales |
7449.67 |
8559.6 |
8869.79 |
12062.91 |
16164.31 |
|
Other Operating Income |
6.15 |
8.13 |
9.68 |
9.63 |
8.80 |
|
Other Income |
3.41 |
31.33 |
18.26 |
17.74 |
17.68 |
|
Total Income |
7459.23 |
8599.06 |
8897.73 |
12090.28 |
16190.78 |
|
Total Expenditure |
6765.56 |
7892.5 |
7956.98 |
10639.45 |
14085.98 |
|
PBIDT |
693.67 |
706.56 |
940.75 |
1450.83 |
2104.80 |
|
Interest |
342.89 |
441.53 |
544.56 |
650.88 |
586.26 |
|
PBDT |
350.78 |
265.03 |
396.19 |
799.95 |
1518.54 |
|
Depreciation |
200.24 |
245.05 |
306.78 |
419.53 |
502.34 |
|
PBT |
150.54 |
19.98 |
89.41 |
380.42 |
1016.24 |
|
Tax |
37.06 |
14.27 |
58.32 |
247.27 |
660.53 |
|
Reported Profit After Tax |
113.48 |
5.71 |
31.09 |
133.51 |
355.67 |
|
Net Profit after Minority Interest & P/L Asso.Co. |
113.48 |
5.71 |
31.09 |
146.71 |
366.07 |
Balance Sheet (as per rough estimates)
|
|
FY13 |
FY14 |
FY15 |
FY16E |
FY17E |
|
SOURCES OF FUNDS: |
|
|
|
|
|
|
Share Capital |
182.98 |
80.23 |
80.41 |
80.41 |
80.41 |
|
Reserves & Surplus |
1687.32 |
1804.5 |
1755.06 |
1883.27 |
2230.87 |
|
Loan Funds |
3638.96 |
5950.99 |
8231.7 |
9298.30 |
9019.35 |
|
Deferred Tax Liability |
158.11 |
170.53 |
224.2 |
226.81 |
262.91 |
|
Other Liabilities |
27.12 |
75.46 |
59.68 |
87.23 |
107.45 |
|
Total Liabilities |
5694.49 |
8081.71 |
10351.05 |
11694.54 |
11815.95 |
|
APPLICATION OF FUNDS: |
|
|
|
|
|
|
Fixed Assets |
3882.99 |
6237.23 |
8465.09 |
9988.81 |
10688.02 |
|
Intangible Assets |
95.13 |
104.82 |
109.21 |
95.21 |
98.6 |
|
Loans |
0 |
0 |
0 |
0 |
0 |
|
Investments |
51.66 |
3.25 |
2.59 |
2.92 |
3.25 |
|
Current Assets, Loans & Advances |
3165.17 |
3174.48 |
3630.85 |
3834.84 |
3397.48 |
|
Inventories |
923.07 |
1043.96 |
1055.04 |
1655.04 |
1269.42 |
|
Sundry Debtors |
1034.82 |
1150.65 |
1450.79 |
1073.32 |
1072.09 |
|
Cash & Bank Balance |
596.76 |
487.04 |
473.46 |
607.761 |
514.93 |
|
Other Current Assets |
26.41 |
16.04 |
11.29 |
14.41 |
15.96 |
|
Loans & Advances |
584.11 |
476.79 |
640.27 |
484.31 |
525.08 |
|
Current Liabilities & Provisions |
1970.85 |
2101.04 |
2080.86 |
2362.66 |
2598.80 |
|
Current Liabilities |
1917.05 |
2028.4 |
1981.21 |
2279.45 |
2509.65 |
|
Provisions |
53.8 |
72.64 |
99.65 |
83.22 |
89.15 |
|
Net Current Assets |
1194.32 |
1073.44 |
1549.99 |
1472.18 |
798.68 |
|
Other Assets |
470.39 |
662.97 |
224.17 |
230.63 |
227.4 |
|
Total Assets |
5694.49 |
8081.71 |
10351.05 |
11694.54 |
11815.95 |
Conclusion and Recommendation
We are positive on JBF over the long term and hence recommend a BUY at CMP of RS.213.55 and further add on declines between Rs.190 to Rs.188 for a target of Rs.259 to Rs.316 with stop loss maintained at Rs.184.
- Share :


Post a Comment
|
DISCLAIMER |
This report is only for the information of our customers. Recommendations, opinions, or suggestions are given with the understanding that readers acting on this information assume all risks involved. The information provided herein is not to be construed as an offer to buy or sell securities of any kind. ATS and/or its group companies do not as assume any responsibility or liability resulting from the use of such information.