JM Financial Limited Research Report
|
Industry |
Market Price |
Recommendation |
Target |
Time Horizon |
|
Investment Service |
62.65 |
Buy |
90 |
1.5-Year |
JM Financial Limited - Q4 FY 2022 Review
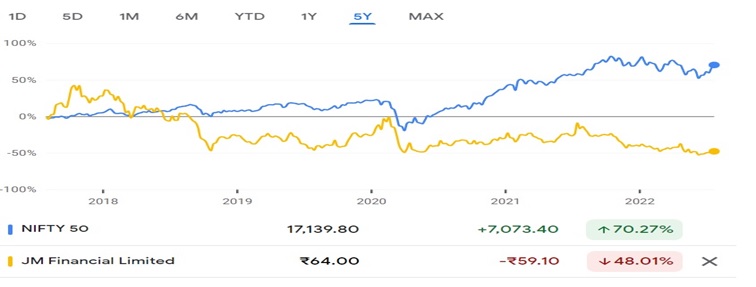
JM Financial Limited reported net revenue of ₹791.25 crores for the quarter ended June 31, 2022, compared to ₹985.81 crores for Ju 31, 2021. Profit After Tax was ₹198.26 crores for the quarter ended June 31, 2022, as compared to ₹274.47 crores during the corresponding quarter of the previous year, respectively.
JM Financial Limited - Investment Summary
|
CMP (₹) |
62.65 |
|
52 Week H/L |
111.85/57.10 |
|
Market Cap (crores) |
5,981 |
|
Face Value (₹) |
1.00 |
|
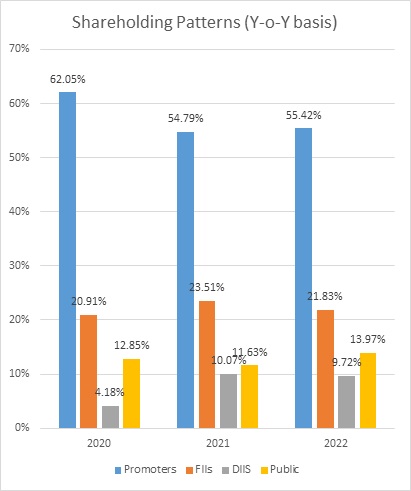
Promoter Holding (%) |
55.41 |
|
Non-Promoter Holding (%) |
44.59 |
|
Total (%) |
100.00 |
|
Book Value |
₹111 |
|
EPS TTM |
₹8.09 |
JM Financial Limited - Overview
-
JM Financial Limited is an integrated and diversified financial services group.
-
The company allotted 3,82,803 equity shares under the employees’ stock option scheme as on 21 July 2022.
-
The company has 112 branches across thirteen states and two union territories, across 185 cities in India.
-
CRISIL has assigned AA stable and A1+ credit rating for long-term and short-term debt facilities.
Beta: 1.27 |
Alpha: -9.15 |
Risk Reward Ratio: 1.83 |
Margin of Safety: 30% |
JM Financial Limited - Quarterly Summary
|
Quarterly (INR in crores) |
Jun-22 |
Mar-22 |
Dec-21 |
Sep-22 |
Jun-21 |
|
Interest Income |
463.4 |
422.26 |
490.9 |
505.11 |
432.65 |
|
Fees and Commission Income |
164.33 |
185.66 |
220.03 |
200.62 |
210.65 |
|
Brokerage income |
69.12 |
86.7 |
81.7 |
80.36 |
81.78 |
|
Net Gain on Fair Value Changes |
65.79 |
82.03 |
126.18 |
144.31 |
236.07 |
|
Net Gain on Derecognition on Financial Instruments Carried at Amortised Cost |
0 |
2.46 |
0.05 |
0 |
0 |
|
Other Operating Income |
28.61 |
30.33 |
33.48 |
31.84 |
24.66 |
|
Revenue from Operations |
791.25 |
809.44 |
952.34 |
962.24 |
985.81 |
|
|
|
|
|
|
|
|
Other Income |
14.47 |
29.58 |
12.55 |
7.25 |
6.74 |
|
Total income |
805.72 |
839.02 |
964.89 |
969.49 |
992.55 |
|
|
|
|
|
|
|
|
Finance costs |
260.74 |
249.95 |
283.4 |
287.39 |
260.99 |
|
Net Loss on Fair Value Changes |
0.04 |
0 |
0 |
2.46 |
0 |
|
Impairment on Financial Instrument |
32.27 |
50.43 |
75.43 |
113.87 |
108.63 |
|
Employee Benefit Expense |
147.76 |
97.44 |
142.72 |
145.4 |
162.25 |
|
Depreciation and Amortisation Expense |
9.56 |
9.64 |
9.29 |
9.41 |
9.44 |
|
Other Expenses |
96.18 |
110.17 |
104.9 |
93.65 |
90.84 |
|
EBT |
259.17 |
321.39 |
349.15 |
317.31 |
360.4 |
|
|
|
|
|
|
|
|
Tax Expenses |
60.19 |
92.48 |
87.97 |
89.29 |
85.93 |
|
PAT Before Non-Controlling Interest Share in Profit of Associates |
198.26 |
228.91 |
261.18 |
228.02 |
274.47 |
|
|
|
|
|
|
|
|
Share in Profit of Associates |
0.12 |
-0.71 |
0.14 |
0.28 |
0.31 |
|
PAT before Non-Controlling Interest |
198.38 |
228.2 |
261.32 |
228.3 |
274.78 |
|
|
|
|
|
|
|
|
Non-Controlling Interest |
28.37 |
49.61 |
44.11 |
53.87 |
71.64 |
|
Net Profit |
170.01 |
178.59 |
217.21 |
174.43 |
203.14 |
Business
-
JM Financial was incorporated on January 30, 1986, under the name of JM shares & Stock Brokers (JMSSB).
-
JM Financial was started as a private limited company as an arm of JM Financial & Investment Consultancy Service.
-
The company went public in the year 1988.
-
During the year 2004, the company changed its name from JM shares & Stock Brokers to JM Financial Limited.
-
The company had a Joint venture with Morgan Stanley in the year 1998 to provide investment banking and other financial services in India and outside India. The joint venture was terminated in the year 2007.
-
In FY 2015-16, the company received a license for housing finance from National Housing Bank (NHB).
-
The company raised ₹650 crores and ₹770 crores from QIPs in FY 2018 and FY 2020.
-
JM Financial provides various financial services and its business segment consists of
-
Investment Banking (IB)
-
The company has evolved over a period of time into a leading diversified service firm.
-
They have a wide range of product offerings that caters to several customer segments.
-
The IB segment caters to institutional, corporates, government, and ultra-high net worth clients and includes investment banking, institutional equities and research, private equity funds, fixed income, syndication, and finance.
-
-
Mortgage Lending
-
The company’s mortgage lending segment includes:
-
Wholesale Mortgage
-
The wholesale mortgage includes commercial real estate developers.
-
-
-
Retail Mortgage
-
The retail mortgage includes housing financing business, loan against property (LAP), and educational institution lending (EIL).
-
-
-
Alternative and Distressed Credit
-
It comprises the asset reconstruction business and alternative credit funds.
-
-
Asset Management, Wealth Management, and Securities Management (AWS Platform)
-
It provides an integrated investment platform to individual clients and comprises wealth management business, broking, PMS, and mutual fund.
-
-
-
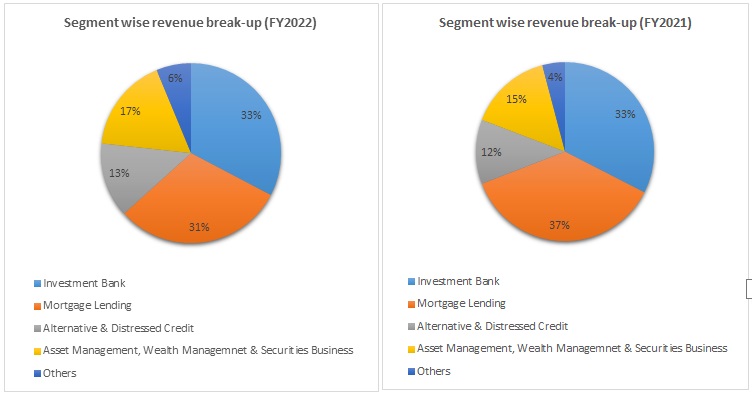
Out of the total revenue, 33% has been generated from Investment Bank, 31% from Mortgage Lending, 17% from Asset Management, Wealth Management & Securities Management, 13% from Alternatives & Distressed Credit, and 6% from Others in FY 2022 compared to 33%, 37%, 15%, 12%, and 4% in FY 2021, respectively.
-
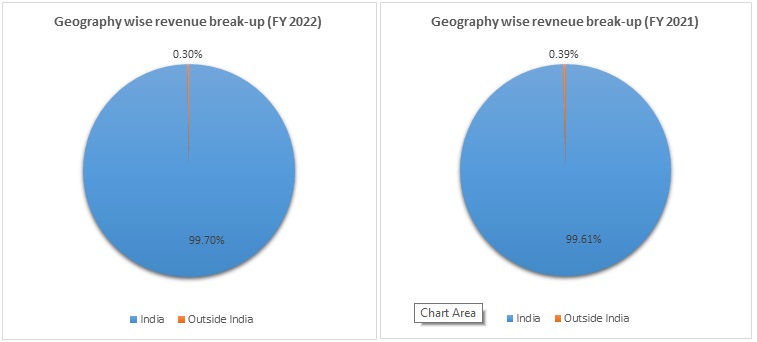
Out of total revenue, 99.70% of revenue is received from India and 0.30% from outside India in FY 2022, compared to 99.61% and 0.389% in FY 2021.
JM Financial Limited - Ratio Analysis
|
|
Mar-18 |
Mar-19 |
Mar-20 |
Mar-21 |
Mar-22 |
|
Interest Coverage Ratio |
2.02 |
1.62 |
1.76 |
1.99 |
2.27 |
|
Cost to Net Total Income |
31.93% |
32.49% |
32.35% |
32.59% |
31.10% |
|
Net Profit Margin |
25.35% |
23.92% |
22.53% |
25.05% |
26.37% |
|
Current Ratio |
1.25 |
1.27 |
1.92 |
1.91 |
2.06 |
|
Debt Equity Ratio |
2.54 |
1.94 |
1,47 |
1.29 |
1.29 |
|
Net Debt Equity Ratio |
2.29 |
1.70 |
1.04 |
0.73 |
0.94 |
|
ROA |
4.06% |
3.42% |
3.47% |
3.77% |
4.24% |
|
ROE |
16.53% |
11.88% |
10.24% |
9.17% |
10.58% |
Financial Overview
Profit and Loss Statement (₹ in crores)
|
|
Mar-18 |
Mar-19 |
Mar-20 |
Mar-21 |
Mar-22 |
|
Interest Income |
1,898.91 |
2,364.94 |
2,281.27 |
1,908.54 |
1,850.71 |
|
Fees and Commission Income |
698.58 |
576.83 |
646.26 |
628.53 |
816.96 |
|
Brokerage income |
218.83 |
190.21 |
202.70 |
256.61 |
330.54 |
|
Net Gain on Fair Value Changes |
- |
223.25 |
175.53 |
311.91 |
588.59 |
|
Net Gain on Derecognition on Financial Instruments Carried at Amortised Cost |
26.08 |
1.79 |
18.02 |
6.60 |
0.05 |
|
Other Operating Income |
207.91 |
122.13 |
108.25 |
85.28 |
120.31 |
|
Revenue from Operations |
3,050.31 |
3,479.15 |
3,432.03 |
3,197.47 |
3,707.16 |
|
|
|||||
|
Other Income |
46.29 |
20.34 |
21.52 |
29.16 |
56.12 |
|
Total income |
3,096.60 |
3,499.49 |
3,453.55 |
3,226.63 |
3,763.28 |
|
|
|||||
|
Finance costs |
1,138.99 |
1,446.21 |
1,385.86 |
1,110.87 |
1,081.73 |
|
Net Loss on Fair Value Changes |
63.66 |
- |
- |
- |
- |
|
Impairment on Financial Instrument |
33.59 |
35.12 |
233.72 |
256.76 |
348.36 |
|
Employee Benefit Expense |
391.01 |
421.61 |
395.41 |
440.83 |
547.81 |
|
Depreciation and Amortisation Expense |
26.17 |
27.11 |
41.04 |
39.75 |
37.78 |
|
Other Expenses |
278.34 |
286.65 |
304.00 |
311.57 |
399.56 |
|
EBT |
1,164.84 |
1,282.79 |
1,093.52 |
1,066.85 |
1,348.04 |
|
|
|||||
|
Tax Expenses |
381.77 |
446.31 |
315.98 |
260.79 |
355.67 |
|
PAT Before Non-Controlling Interest Share in Profit of Associates |
783.07 |
836.48 |
777.54 |
806.06 |
992.37 |
|
|
|||||
|
Share in Profit of Associates |
1.79 |
0.57 |
0.41 |
2.11 |
0.02 |
|
PAT before Non-Controlling Interest |
784.86 |
837.05 |
777.95 |
808.17 |
992.39 |
|
|
|||||
|
Non-Controlling Interest |
184.00 |
264.87 |
232.97 |
218.03 |
219.23 |
|
Net Profit |
600.86 |
572.18 |
544.98 |
590.14 |
773.16 |
|
|
|||||
|
EPS |
|||||
|
Basic |
7.48 |
6.82 |
6.48 |
6.34 |
8.11 |
|
Diluted |
7.44 |
6.79 |
6.45 |
6.32 |
8.09 |
|
|
|||||
|
Number of Shares |
|||||
|
Basic |
80.29 |
83.95 |
84.09 |
93.03 |
95.36 |
|
Diluted |
80.80 |
84.33 |
84.43 |
93.31 |
95.54 |
Cash Flow Statement (₹ in crores)
|
|
Mar-18 |
Mar-19 |
Mar-20 |
Mar-21 |
Mar-22 |
|
Net Profit Before Tax |
1,164.84 |
1,282.79 |
1,093.52 |
1,066.85 |
1,348.04 |
|
Net Cash from Operating Activities |
-3,584.18 |
773.27 |
3,164.13 |
969.28 |
-3,203.03 |
|
Net Cash Used for Investing Activities |
-708.04 |
-148.41 |
-901.41 |
-2,248.75 |
2,615.80 |
|
Net Cash From (Used For) Financing Activities |
4,539.69 |
-522.17 |
-2,204.53 |
1,295.95 |
1,023.79 |
|
Net Increase in Cash and Cash Equivalents |
247 |
103 |
58 |
16 |
437 |
|
Cash And Cash Equivalents at The Beginning of the Year |
402 |
649 |
752 |
810 |
826 |
|
Cash And Cash Equivalents at The End of the Year |
649 |
752 |
810 |
826 |
1,263 |
JM Financial Limited - Balance Sheet (₹ in crores)
|
|
Mar-18 |
Mar-19 |
Mar-20 |
Mar-21 |
Mar-22 |
|
ASSETS: |
|
|
|
|
|
|
Financial Assets: |
|
|
|
|
|
|
Cash and Cash Equivalents |
649.08 |
751.77 |
809.90 |
826.38 |
1,262.94 |
|
Bank Balances Other than Cash and Cash Equivalents |
877.87 |
530.47 |
519.50 |
1,248.57 |
1,296.93 |
|
Derivative Financial Instruments |
- |
- |
1.26 |
5.06 |
- |
|
Trade Receivables |
854.68 |
685.05 |
324.25 |
508.62 |
499.09 |
|
Loans |
14,931.11 |
14,336.93 |
11,900.13 |
11,222.71 |
15,071.52 |
|
Investments |
2,388.45 |
2,933.34 |
4,014.45 |
5,801.65 |
3,639.29 |
|
Other Financial Assets |
1,813.02 |
2,686.53 |
2,382.32 |
2,977.55 |
3,016.18 |
|
Total Financial Assets |
21,514.21 |
21,924.09 |
19,951.81 |
22,590.54 |
24,785.95 |
|
|
|
|
|
|
|
|
Non-Current Assets: |
|
|
|
|
|
|
Current Tax Assets |
236.39 |
255.63 |
295.89 |
299.73 |
336.70 |
|
Deferred Tax Assets |
- |
- |
- |
164.48 |
240.94 |
|
PPE |
364.26 |
359.12 |
387.40 |
361.88 |
352.92 |
|
Capital Work-in-Progress |
2.90 |
1.35 |
0.69 |
0.86 |
3.05 |
|
Other Intangible Assets |
10.37 |
11.99 |
10.14 |
8.54 |
8.35 |
|
Goodwill on Consolidation |
52.44 |
52.44 |
52.44 |
52.44 |
52.44 |
|
Other Non-Financial Assets |
25.72 |
35.47 |
47.15 |
36.38 |
34.15 |
|
Total Non-Financial Assets |
692.08 |
716.00 |
793.71 |
924.31 |
1,028.55 |
|
|
|
|
|
|
|
|
Total Assets |
22,206.29 |
22,640.09 |
20,745.52 |
23,514.85 |
25,814.50 |
|
|
|
|
|
|
|
|
Liabilities and Equity |
|
|
|
|
|
|
Liabilities: |
|
|
|
|
|
|
Financial Liabilities: |
|
|
|
|
|
|
Derivatives Financial Instruments |
- |
- |
1.22 |
4.82 |
- |
|
Trade Payables: |
|
|
|
|
|
|
Total Outstanding dues of Micro Enterprise and Small Enterprises |
0.45 |
0.28 |
0.98 |
0.49 |
1.64 |
|
Other Creditors |
344.83 |
416.82 |
438.87 |
763.44 |
844.31 |
|
Debt Securities |
10,491.07 |
9,722.83 |
8,235.26 |
8,493.03 |
9,651.16 |
|
Borrowings (Other Than Debt Securities) |
4,496.50 |
4,268.28 |
3,520.41 |
3,873.18 |
3,806.60 |
|
Lease Liabilities |
- |
- |
- |
38.98 |
40.28 |
|
Other Financial Liabilities |
197.75 |
345.80 |
271.55 |
395.27 |
442.92 |
|
Total Financial Liabilities |
15,530.60 |
14,754.01 |
12,468.29 |
13,569.21 |
14,786.91 |
|
|
|
|
|
|
|
|
Non-Financial Liabilities: |
|
|
|
|
|
|
Current Tax Liabilities |
- |
- |
- |
3.20 |
3.59 |
|
Provisions |
37.14 |
42.20 |
47.88 |
50.68 |
48.45 |
|
Deferred Tax Liabilities |
89.53 |
43.76 |
27.21 |
136.68 |
153.10 |
|
Other Non-Financial Liabilities |
76.62 |
33.98 |
67.71 |
79.03 |
196.81 |
|
Total Non-Financial Liabilities |
203.29 |
119.94 |
142.80 |
269.59 |
401.95 |
|
|
|
|
|
|
|
|
Equity: |
|
|
|
|
|
|
Equity Share Capital |
83.79 |
83.99 |
84.12 |
95.27 |
95.41 |
|
Other Equity |
4,470.85 |
5,047.70 |
5,554.65 |
6,904.63 |
7,590.80 |
|
Equity Attributable to Owners of the Company |
4,554.64 |
5,131.69 |
5,638.77 |
6,999.90 |
7,686.21 |
|
|
|
|
|
|
|
|
Non-Controlling Interest |
1,394.72 |
2,150.40 |
2,406.89 |
2,604.82 |
2,819.57 |
|
Non-Controlling Interests of Security receipts Holder under Distressed Credit Business |
523.04 |
484.05 |
88.77 |
71.33 |
119.86 |
|
Total Equity |
6,472.40 |
7,766.14 |
8,134.43 |
9,676.05 |
10,625.64 |
|
|
|
|
|
|
|
|
Total Liabilities and Equity |
22,206.29 |
22,640.09 |
20,745.52 |
23,514.85 |
25,814.50 |
Industry Overview
-
India has a diversified sector undergoing repaid expansion, both in terms of strong growth of existing financial services firm and new entities entering the market.
-
The country’s financial services consist of the capital market, insurance sector, and non-banking financial services.
-
In FY 2021, US$ 4.25 million was raised across 55 initial public offerings (IPOs).
-
The number of Ultra High-Net-Worth Individuals (UHNWI) is estimated to increase from 6,884 in FY 2021 to 11,198 in FY 2025. India’s UHNHW is likely to expand by 63% in the next five years.
-
India is expected to have 6.11 lakh HNWIs in 2025.
-
As of June 2022, AUM managed by the mutual fund stood at ₹35.64 trillion and the total number of accounts (or folios as per mutual fund parlance) stood at 13.47 crores.
-
Indian mutual funds have currently 5.55 crores SIP accounts and the SIP amount stood at ₹1,24,566 crores in FY 2022.
-
The Government of India had taken various steps to deepen reforms in the capital market, including simplification of the IPO process, which allows Qualified Foreign Investors (QFIs) to access the Indian bond market.
-
According to Goldman Sachs, investors have been pouring money into India’s stock market, which is likely to reach more than 5 trillion US dollars, surpassing the UK, and could become the fifth largest stock market worldwide by FY 2024.
-
India Sensitive 30 (Sensex) closed at 53,018.9 points in June 2022, compared with 55,566.4 points at the previous year's month end. The data has reached an all-time high of 59,306.9 points in October 2021.
-
The number of Demat accounts increased by 63% to 89.7 million in FY 2022.
-
Non-Life insurers report an 11% growth in premiums at ₹2.2 trillion in FY 2022.
-
The Gross Loan Portfolio (GLP) of the microfinance section in India rose by 10% to ₹2.25 trillion in FY 2022, compared to 2.59 trillion in the previous year.
-
Indian ratings have raised its outlook on the microfinance sector to ‘Neutral’ from ‘Negative’ for FY 2023. Securitization volumes originated largely by NBFC and housing finance companies have grown by 43% to ₹1.25 lakh crores of assets in FY 2022, compared to ₹0.87 crores seen in FY 2021.
-
The growth in FY 2022 was on account of a quick recovery in economic activities after the second pandemic wave in Q1 and limited disruption seen during the third wave.
Concall Overview (Q4FY2022)
-
Pre-Provision profit increased by 28% to ₹1,696.40 crores in FY2022.
-
The gross NPA and NNPA of the lending business were 4.3% & 2.7%, and SMA-2 stood at 3.1% on a consolidated basis as of 31 March 2022.
-
The board of directors approved the demerger of private wealth and PMS business, which is part of JM Financial Services Limited into JM Financial Limited.
-
In the AMC business, the company is aiming to touch the scale of ₹25,000 crore AUM in the next 2-3 years (the current AUM is ₹2319 crores).
-
In the Mortgage lending segment, the company aims to achieve a book size of ₹15,000 crores by FY 2024. The ₹15,000 crores asset book will be split into ₹12,000 crores for wholesale assets and ₹3,000 crores for retail assets.
-
During the year company raised ₹3,818 crores through long-term borrowings.
JM Financial Limited - Technical Analysis
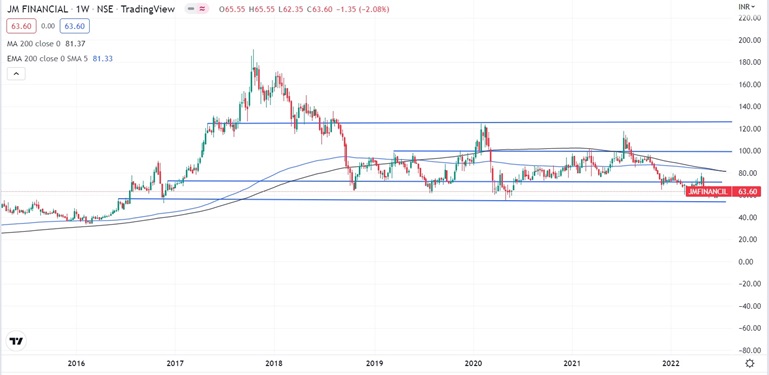
-
Stock is trading below EMA 200 and MA 200 indicators, with a support level of ₹72. and a resistance level of ₹100.
-
One can accumulate this stock at current levels.
Recommendation Rationale
-
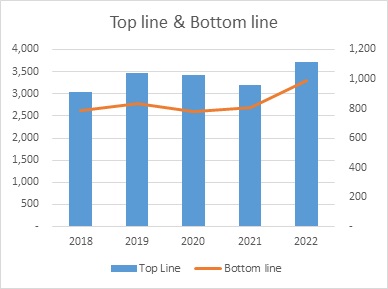
JM Financial Limited’s revenue and Net profit increased by 16% & 23% to ₹3,707.6 crores, and 992.39 crores, compared to the previous year.
-
The group has developed a strong franchise in key operating segments such as investment bank, platform AWS, distressed credit, and mortgage lending. This is aided by the track record and reputation of its experienced management and healthy clients.
-
The company has a strong network of borrowers with whom they have long relationships and has never faced any asset quality issues.
-
A diversified business profile over the past few years has helped the company to mitigate the risk and has given stability to its earnings profile.
-
The company has strengthened its investment bank segment primarily through fixed income capabilities, improving synergies, and product capabilities.
-
Asset quality in the wholesale business remains vulnerable due to the challenging funding environment had significantly increased the refinancing risk, especially for real-estate players, but JM group has managed its portfolio well and has faced fewer slippages. The group has maintained healthy capitalization which protects against asset side risk.
-
Experienced management, diversified business profile, strong liquidity position, and good relationship with clients will help the company expand its business.
Valuation
-
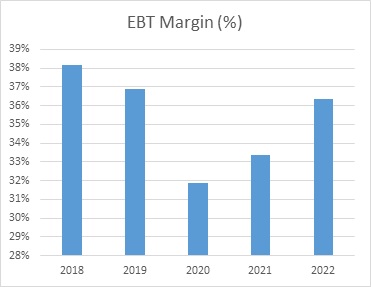
The company’s revenue has increased with a CAGR of 5% from FY2018-FY2022.
-
Net profit has increased with a CAGR of 6% from FY2018-FY2022.
-
The company’s ROA and ROE are 4.24% and 10.58%.
-
The improving market condition, easing of the covid-19 pandemic, and improving sentiments in the real estate sector will help the company to improve its revenue further.
-
Based on the company’s current performance in FY2022, we expect the company could post higher revenue for the next FY2023, corresponding to the previous year.
-
In the Mortgage lending segment, the company aims to achieve a book size of ₹15,000 crores by FY 2024.
-
We have taken data for the last five years (2018-2022) and forecasted revenue for FY 2023-2027. Revenue growth is assumed to be 8%.
JM Financial Limited - Estimated Income Statement (₹ in crores)
|
Mar-23 |
Mar-24 |
Mar-25 |
Mar-26 |
Mar-27 |
|
|
|
2023-E |
2024-E |
2025-E |
2026-E |
2027-E |
|
Interest Income |
1,943.25 |
2,040.41 |
2,142.43 |
2,249.55 |
2,362.03 |
|
Fees and Commission Income |
923.91 |
1,044.85 |
1,181.63 |
1,336.32 |
1,511.25 |
|
Brokerage income |
398.82 |
481.21 |
580.61 |
700.55 |
845.27 |
|
Net Gain on Fair Value Changes |
618.02 |
648.92 |
681.37 |
715.43 |
751.21 |
|
Net Gain on Derecognition on Financial Instruments Carried at Amortised Cost |
0.05 |
0.06 |
0.06 |
0.06 |
0.06 |
|
Other Operating Income |
126.33 |
132.64 |
139.27 |
146.24 |
153.55 |
|
Revenue from Operations |
4,010.37 |
4,348.09 |
4,725.37 |
5,148.16 |
5,623.37 |
|
|
|||||
|
Other Income |
58.93 |
61.87 |
64.97 |
68.21 |
71.62 |
|
Total income |
4,069.30 |
4,409.96 |
4,790.34 |
5,216.37 |
5,695.00 |
|
|
|||||
|
Finance costs |
1,172.41 |
1,270.70 |
1,377.22 |
1,492.68 |
1,617.81 |
|
Net Loss on Fair Value Changes |
- |
- |
- |
- |
- |
|
Impairment on Financial Instrument |
349.44 |
378.87 |
411.75 |
448.59 |
489.99 |
|
Employee Benefit Expense |
572.76 |
620.99 |
674.88 |
735.26 |
803.13 |
|
Depreciation and Amortisation Expense |
45.36 |
49.18 |
53.45 |
58.23 |
63.61 |
|
Other Expenses |
411.51 |
446.16 |
484.88 |
528.26 |
577.02 |
|
EBT |
1,517.81 |
1,644.05 |
1,788.17 |
1,953.36 |
2,143.43 |
|
|
|||||
|
Tax Expenses |
400.46 |
433.77 |
471.79 |
515.38 |
565.53 |
|
PAT Before Non-Controlling Interest Share in Profit of Associates |
1,117.34 |
1,210.28 |
1,316.37 |
1,437.98 |
1,577.90 |
|
|
|||||
|
Share in Profit of Associates |
- |
- |
- |
- |
- |
|
PAT before Non-Controlling Interest |
1,117.34 |
1,210.28 |
1,316.37 |
1,437.98 |
1,577.90 |
|
|
|||||
|
Non-Controlling Interest |
246.83 |
267.36 |
290.80 |
317.67 |
348.58 |
|
Net Profit |
870.51 |
942.92 |
1,025.57 |
1,120.31 |
1,229.33 |
-
We initiate coverage on JM Financial Limited with a “Buy” and a 1.5-year Target Price of ₹ 90.
Disclaimer: This report is only for the information of our customers Recommendations, opinions, or suggestions are given with the understanding that readers acting on this information assume all risks involved. The information provided herein is not to be construed as an offer to buy or sell securities of any kind.
- Share :


Post a Comment
|
DISCLAIMER |
This report is only for the information of our customers. Recommendations, opinions, or suggestions are given with the understanding that readers acting on this information assume all risks involved. The information provided herein is not to be construed as an offer to buy or sell securities of any kind. ATS and/or its group companies do not as assume any responsibility or liability resulting from the use of such information.