JSPL Ltd.
Jindal Steel and Power Limited - Company Details
Jindal Steel and Power Limited (JSPL) is a company with a dominant presence in steel, power, mining and infrastructure sectors. Part of the US $ 18 billion OP Jindal Group this young, agile and responsive company is constantly expanding its capabilities to fuel its fairy tale journey that has seen it grow to a US $ 3.3 billion business conglomerate. Jindal Steel and Power Limited (JSPL) has committed investments exceeding US $ 30 billion in the future and has several business initiatives running simultaneously across continents.
From the widest flat products to a whole range of long products, Jindal Steel and Power Limited (JSPL) today sports a product portfolio that caters to markets across the steel value chain.
Jindal Steel and Power Limited (JSPL) operates the largest coal-based sponge iron plant in the world and has an installed capacity of 3 MTPA(million tonnes per annum) of steel at Raigarh in Chhattisgarh.
An enterprising spirit and the ability to discern future trends have been the driving force behind the company's remarkable growth story. The organisation is wedded to ideals like innovation and technological leadership and is backed by a highly driven and dedicated workforce of 15000 people.
Jindal Steel and Power Limited (JSPL) has been rated as the second highest value creator in the world by the Boston Consulting Group, the 11th fastest growing company in India by Business World and has figured in the Forbes Asia list of Fab 50 companies. It has also been named among the Best Blue Chip companies and rated as the Highest Wealth Creator by the Dalal Street Journal. Dun & Bradstreet has ranked it 4th in its list of companies that generated the highest total income in the iron and steel sector.
The current market capitalization stands at Rs 14,016.33 crore. The company has reported a consolidated sales of Rs 5,072.67 crore and a Net Profit of Rs 400.11 crore for the quarter ended Sep 2014.
Jindal Steel and Power Limited - Share Holding Pattern
|
Category |
No. of Shares |
Percentage |
|
Promoters |
490,183,870 |
53.58 |
|
Foreign Institutions |
182,341,208 |
19.93 |
|
General Public |
82,801,493 |
9.05 |
|
Foreign Promoters |
68,808,566 |
7.52 |
|
Other Companies |
38,899,026 |
4.25 |
|
Financial Institutions |
22,685,739 |
2.48 |
|
NBFC and Mutual Funds |
10,764,358 |
1.18 |
|
Foreign - Others |
10,020,657 |
1.10 |
|
Foreign - NRI |
7,931,854 |
0.87 |
|
Others |
433,549 |
0.05 |
|
Foreign Industries |
33,480 |
0.00 |
Jindal Steel and Power Limited - Financial Details
-
Market Cap (Rs Cr) – 14011.75
-
Company P/E – 10.08
-
Industry P/E – 10.41
-
Book Value (Rs) – 142.79
-
Dividend (%) – 150%
-
EPS (TTM) – 15.19
-
Dividend Yield (%) – 0.98%
-
Face Value (Rs) - 1
Industry Forecast
The Indian steel industry has achieved significant milestones in terms of growth in capacity, production and exports to become a major player in the global steel industry. Between FY2008 and FY2013, India’s steel production has grown at a compound annual growth rate (CAGR) of about 7 percent Indian steel companies Industry revenues (top four companies) grew close to 4x, while operating profits grew by approximately 5x during the past decade.
The Indian steel industry is divided into primary and secondary sectors. The primary sector comprises a few large integrated steel providers producing billets, slabs and hot rolled coils, among others. The secondary sector comprises small units focused on the production of value added products such as cold rolled coils, galvanized coils, angles, columns, beams and other re-rollers, and sponge iron units. Both sectors cater to different market segments. On the basis of ownership, the Indian steel industry is broadly divided into private and public sector enterprises. The private sector dominates production accounting for almost 78 percent of the finished steel output while the public sector has higher capacity utilizations. The demand for longs is expected to increase by 19 million ton (MT) at a CAGR of 9 percent and for flats by 16 MT at a CAGR of 8 percent between FY2012 and FY2017.
Incumbents and challengers have announced 71 million ton per annum (MTPA) of steel capacity addition between FY2012 and FY2017 through both brownfield and greenfield routes. However, there is considerable uncertainty on the actual capacity addition as many projects are yet to achieve financial closure due to delays or lack of regulatory clearances. Based on our bottom-up assessment of the announced capacity additions, projects aggregating to 35 MTPA of crude steel capacity have already achieved financial closure. Hence, we expect a minimum aggregate capacity of 122 MTPA to be commissioned by FY2017.
Balance Sheet
|
|
Mar '14 |
Mar '13 |
Mar '12 |
Mar '11 |
Mar '10 |
|
Sources Of Funds |
|
|
|
|
|
|
Total Share Capital |
91.49 |
93.48 |
93.48 |
93.43 |
93.12 |
|
Equity Share Capital |
91.49 |
93.48 |
93.48 |
93.43 |
93.12 |
|
Reserves |
12,972.84 |
12,254.59 |
10,751.93 |
8,595.91 |
6,652.88 |
|
Networth |
13,064.33 |
12,348.07 |
10,845.41 |
8,689.34 |
6,746.00 |
|
Secured Loans |
12,707.31 |
11,577.42 |
6,848.09 |
5,085.01 |
4,235.16 |
|
Unsecured Loans |
9,959.60 |
7,923.52 |
7,524.37 |
6,356.69 |
4,148.10 |
|
Total Debt |
22,666.91 |
19,500.94 |
14,372.46 |
11,441.70 |
8,383.26 |
|
Total Liabilities |
35,731.24 |
31,849.01 |
25,217.87 |
20,131.04 |
15,129.26 |
|
Application Of Funds |
|
|
|
|
|
|
Gross Block |
24,150.58 |
18,821.38 |
15,163.15 |
12,757.46 |
8,814.21 |
|
Less: Accum. Depreciation |
5,891.25 |
4,665.19 |
3,614.14 |
2,757.04 |
2,110.15 |
|
Net Block |
18,259.33 |
14,156.19 |
11,549.01 |
10,000.42 |
6,704.06 |
|
Capital Work in Progress |
11,663.17 |
11,483.94 |
10,493.96 |
7,081.06 |
7,225.21 |
|
Investments |
1,350.52 |
1,330.72 |
1,412.17 |
1,210.01 |
1,067.11 |
|
Inventories |
3,936.25 |
3,598.52 |
3,051.31 |
2,204.12 |
1,328.50 |
|
Sundry Debtors |
1,460.96 |
1,426.13 |
905.06 |
737.12 |
622.36 |
|
Cash and Bank Balance |
762.00 |
36.77 |
30.94 |
43.71 |
49.49 |
|
Total Current Assets |
6,159.21 |
5,061.42 |
3,987.31 |
2,984.95 |
2,000.35 |
|
Loans and Advances |
8,717.43 |
7,777.66 |
6,115.66 |
5,111.03 |
3,164.54 |
|
Total CA, Loans & Advances |
14,876.64 |
12,839.08 |
10,102.97 |
8,095.98 |
5,175.50 |
|
Current Liabilities |
7,132.86 |
4,988.13 |
5,868.89 |
4,360.09 |
3,701.93 |
|
Provisions |
3,285.56 |
2,972.79 |
2,471.35 |
1,896.34 |
1,343.71 |
|
Total CL & Provisions |
10,418.42 |
7,960.92 |
8,340.24 |
6,256.43 |
5,045.64 |
|
Net Current Assets |
4,458.22 |
4,878.16 |
1,762.73 |
1,839.55 |
129.86 |
|
Total Assets |
35,731.24 |
31,849.01 |
25,217.87 |
20,131.04 |
15,129.26 |
Profit and Loss Account
|
|
Mar '14 |
Mar '13 |
Mar '12 |
Mar '11 |
Mar '10 |
|
Income |
|
|
|
|
|
|
Sales Turnover |
14,544.02 |
14,954.70 |
13,333.95 |
9,574.17 |
7,895.58 |
|
Excise Duty |
0.00 |
0.00 |
0.00 |
0.00 |
548.14 |
|
Net Sales |
14,544.02 |
14,954.70 |
13,333.95 |
9,574.17 |
7,347.44 |
|
Other Income |
146.85 |
159.28 |
184.48 |
143.16 |
192.87 |
|
Stock Adjustments |
-386.03 |
148.20 |
379.24 |
333.45 |
40.06 |
|
Total Income |
14,304.84 |
15,262.18 |
13,897.67 |
10,050.78 |
7,580.37 |
|
Expenditure |
|
|
|
|
|
|
Raw Materials |
6,377.26 |
6,928.54 |
6,439.76 |
4,042.60 |
3,219.44 |
|
Power & Fuel Cost |
926.75 |
939.38 |
838.37 |
568.47 |
391.80 |
|
Employee Cost |
552.32 |
447.89 |
385.44 |
277.78 |
219.72 |
|
Other Manufacturing Expenses |
752.41 |
0.00 |
0.00 |
0.00 |
446.60 |
|
Miscellaneous Expenses |
1,790.39 |
2,848.64 |
1,987.13 |
1,436.22 |
233.56 |
|
Total Expenses |
10,399.13 |
11,164.45 |
9,650.70 |
6,325.07 |
4,832.02 |
|
Operating Profit |
3,758.86 |
3,938.45 |
4,062.49 |
3,582.55 |
2,555.48 |
|
PBDIT |
3,905.71 |
4,097.73 |
4,246.97 |
3,725.71 |
2,748.35 |
|
Interest |
1,083.63 |
820.77 |
536.77 |
285.00 |
331.66 |
|
PBDT |
2,822.08 |
3,276.96 |
3,710.20 |
3,440.71 |
2,416.69 |
|
Depreciation |
1,221.44 |
1,048.46 |
867.19 |
687.77 |
512.16 |
|
Profit Before Tax |
1,600.64 |
2,228.50 |
2,843.01 |
2,752.94 |
1,904.53 |
|
PBT (Post Extra-ord Items) |
1,600.64 |
2,228.50 |
2,843.01 |
2,752.94 |
1,907.46 |
|
Tax |
308.69 |
635.95 |
732.36 |
688.82 |
427.78 |
|
Reported Net Profit |
1,291.95 |
1,592.55 |
2,110.65 |
2,064.12 |
1,479.68 |
|
Total Value Addition |
4,021.87 |
4,235.91 |
3,210.94 |
2,282.47 |
1,612.58 |
|
Equity Dividend |
137.23 |
149.57 |
149.46 |
140.19 |
116.52 |
|
Corporate Dividend Tax |
1.22 |
3.32 |
3.15 |
3.75 |
4.28 |
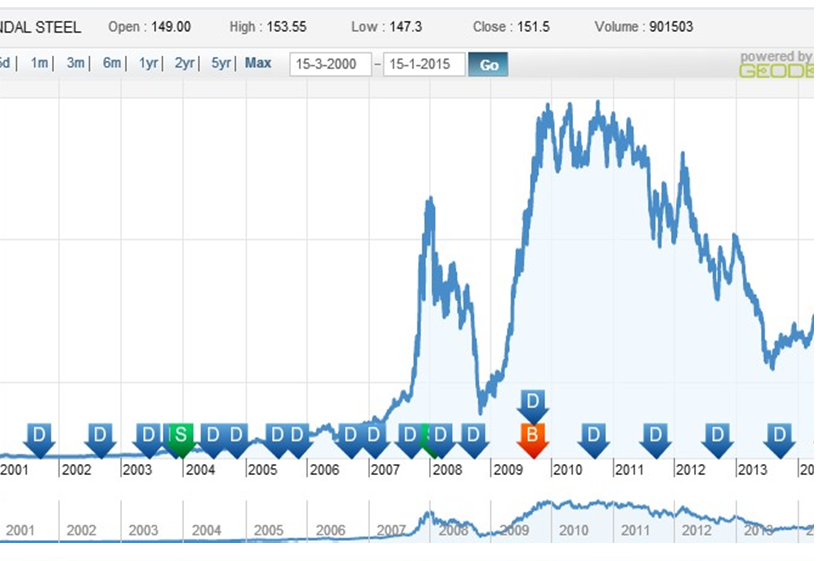
Dividend and Bonus History
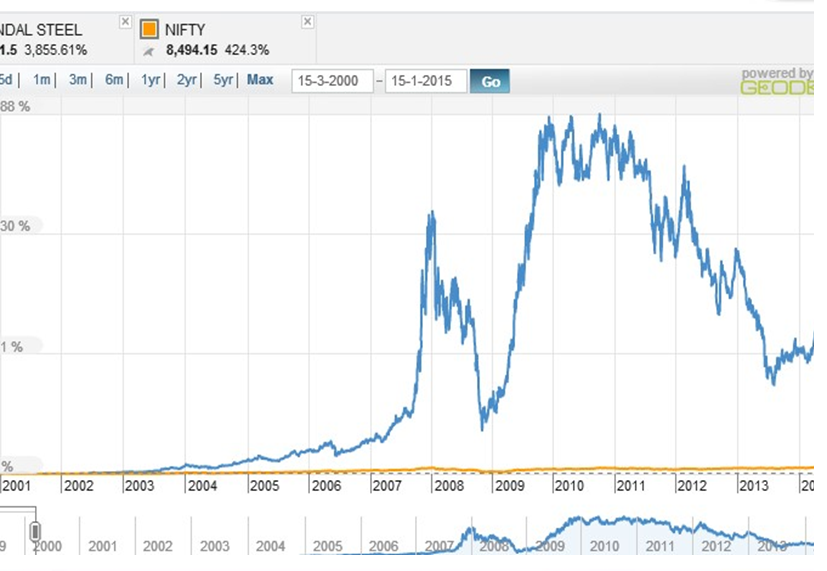
Index and Company Comparison
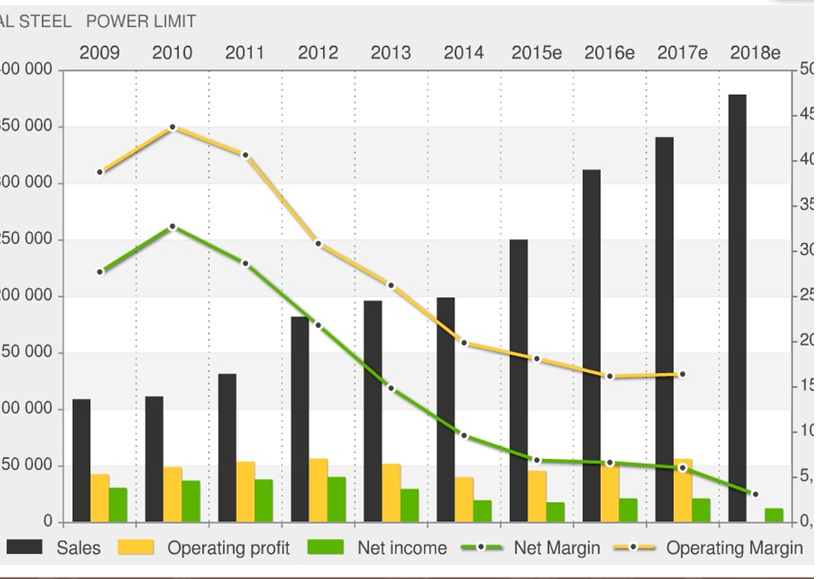
Company Forecast
Important Ratios
-
PBIT – 17.27 v/s 19.12
-
RoCE – 7.51 v/s 9.57
-
RoE – 10.17 v/s 13.73
-
Net Profit Margin – 8.79 v/s 10.53
-
Return on net worth – 9.88 v/s 12.89
-
Reserves – 12972.84 cr v/s 12254.59 cr
-
PAT – 1291.95 cr v/s 1592.55 cr
-
Total assets – 35731.24 cr v/s 31849.01 cr
-
Net sales – 14544.02 cr v/s 14954.7 cr
-
Book Value – 142.8 v/s 132.09
Simple Moving Average
|
Days |
BSE |
NSE |
|
30 |
148.06 |
148.10 |
|
50 |
148.93 |
148.97 |
|
150 |
219.52 |
219.55 |
|
200 |
234.01 |
234.03 |
Recommendations
Buy JSPL at current or lower market levels Reasons for the recommendations are :
-
Sound financial position of the company.
-
Availability of adequate manufacturing facility to meet demands.
-
Huge possibility of turnaround if they get back coal mine license.
-
Not much dip in company performance even in the industry slow down and adverse situations.
-
Highly reputed group of promoters.
-
Higher profit margins of its products.
-
Under performance of the stock price when compared with its peers.
-
Growth in economy will increase the demand for the products.
- Share :


Post a Comment
|
DISCLAIMER |
This report is only for the information of our customers. Recommendations, opinions, or suggestions are given with the understanding that readers acting on this information assume all risks involved. The information provided herein is not to be construed as an offer to buy or sell securities of any kind. ATS and/or its group companies do not as assume any responsibility or liability resulting from the use of such information.