Kansai Nerolac
Kansai Nerolac Paints Ltd is engaged in the manufacturing, distribution, and marketing of paints, emulsion, distempers for walls and ceilings, and paints for industrial and automotive use.
|
BSE |
500165 |
|
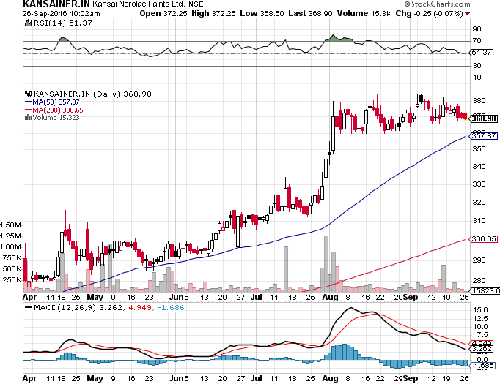
NSE |
KANSAINER |
|
REUTERS |
KANE.BO |
|
INCEPTION |
1920 |
|
IPO |
1990 |
|
INDUSTRY |
FURNISHING PAINTS |
|
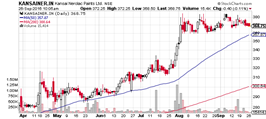
CMP (as on 6/11/2015) |
369 |
|
Stock Beta |
0.48 |
|
52 Week H/L |
23.80-384.45 |
|
Market Cap (Cr) |
19945 |
|
Equity Capital (cr) |
53.89 |
|
Face Value (Rs) |
1 |
|
Average Volume |
77,813 |
|
Shareholding Pattern (%) |
|
|
Promoters |
73.99 |
|
Non Institutions |
26.01 |
|
Grand Total |
100.00 |
Potential Catalysts
-
Rising demand in Urban India, attributable to increased purchasing power and changing consumer preferences.
-
Government’s sharp focus on infrastructure - Make in India, Housing for All, Smart Cities Mission, Sagarmala Project, Bharat Mala Project, Rurban Mission.
-
Improved economic growth and lower inflation levels resulted in increased consumption.
-
Recovery in automotive segments to increase paint consumption.
-
Expansion plants to increase total output capacity by 23%.
Kansai Nerolac Paints Ltd - Recommendation
With its substantial liquidity and financial strength along with long product life cycles, the company is well positioned to address challenges related to technology evolution through acquisitions and internal investments. Capacity expansion by 23%, expected PE expansion, revenue CAGR of 16% for FY17-FY21 will drive stock price in the future. We recommend BUY on the stock at CMP of Rs. 369 to target of Rs. 412.
Kansai Nerolac Paints Ltd - Financial Summary
|
|
2016 |
2017 E |
2018 E |
2019 E |
2020 E |
2021 E |
|
Total Income |
4716.88 |
4957 |
5727 |
6620 |
7621 |
8777 |
|
EBITDA |
564.92 |
769 |
866 |
978 |
1092 |
1217 |
|
Adjusted Net Profit |
470.82 |
568 |
633 |
708 |
783 |
864 |
|
EPS |
8.74 |
10.55 |
11.75 |
13.14 |
14.52 |
16.04 |
|
EBITDA Margin |
13.63% |
15.68% |
15.25% |
14.89% |
14.42% |
13.95% |
|
EBIT Margin |
25.81% |
14.99% |
14.43% |
13.95% |
13.38% |
12.82% |
|
PAT Margin |
9.98% |
11.47% |
11.06% |
10.70% |
10.27% |
9.85% |
|
Value of Kansai Nerolac |
17491.29 |
|
|
Terminal growth |
7.5% |
|
|
Value per share |
323 |
|
|
WATCH |
8.97% |
|
Kansai Nerolac Paints Ltd - BUSINESS DISCRIPTION
Goodlass Nerolac Paints Ltd.(GNPL), the Indian subsidiary of Japan based Kansai Paint Co. Ltd, is the second largest paint company in India with presence in decorative paints as well as industrial paints & marine paints, enamels, varnishes, coatings, resins etc. It is the second largest coating company in India. The company markets its products under the brand names Nerolac, Glossolite, Goody, Allscapes, Excel, in decoratives. The Company was established in 1920 as Gahagan Paints and Varnish Co. Ltd. at Lower Parel in Bombay. In 1930, three British companies merged to formulate Lead Industries Group Ltd. In 1933, Lead Industries Group Ltd. acquired entire share capital of Gahagan Paints in 1933 and thus, Goodlass Wall (India) Ltd. was born.
Subsequently, by 1946, Goodlass Wall (India) Ltd. was known as Goodlass Wall Pvt. Ltd. In 1957, Goodlass Wall Pvt. Ltd. grew popular as Goodlass Nerolac Paints (Pvt.) Ltd. Also, it went public in the same year and established itself as Goodlass Nerolac Paints Ltd. It came into the fold of Tata Forbes Group in 1976, as its foreign holdings were acquired by Forbes Gokak. It turned into Joint Venture company in 1986 as the foreign colloborator Japan based Kansai Paints picking 36% of equity capital of the company. With the acquisition of entire stake of Forbes Gokak and its associates by Kansai Paints it became the subsidiary of the latter in 1999. The stake of Kansai Paints in the company now stood at 64.52% of the total equity of the company. The company has five manufacturing facilities at kanpur, Ratnagiri, Ahmedabad, Perungudi, Rewari spread across India. The Company serves its customers through 66 Sales locations and five strategically located factories.
Technical Assistance Agreements of the company with renowned players in paint industry at international level puts the company in a strong position to offer products which meets stringent international specifications. It started in 1993 when the company tied-up with Kansai Paints of Japan (for manufacture of Sophisticated architectural Coatings) and Nihon Tokushu Torya Co. Ltd also of Japan(for body seal and under seal coatings). And the latest being the technical assistance agreement with Dupont Performance Coatings GmbH & Co. KG, Germany for know-how of manufacture of Anodic Electro-deposition Coatings System during the year 2000-01. The companys other Technical Assistance agreements include E.I. Dupont De Nemours & Co. Inc. of USA for automotive coatings; Oshima Kogyo Company Ltd., of Japan for heat resistant paints; Valspar Corporation of US for powder coatings; Drew Chemicals Corporation of US for water and fuel treatment chemicals and Ameron Inc. USA for high performance coatings.
The company has strong presence in automotive paints as it controls 45% of the organised Industrial paint segment. Its major clients include OEMs like Maruti Udyog, Bajaj Auto, TELCO and Mahindra & Mahindra. It was a pioneer in introducing electro-deposition (ED) technology for Maruti, capturing a sizeable share of the automotive paint market.The company has two wholly owned subsidiaries namely Saurashtra Paints and and GNP (Madras). The above subsidiary companies were amalgamated with the company from April,2002 with consent approval from both the states High courts.
It has the software package, computerised colour dispensing machine from Fluid Management Holland, Gyroshaker of 10-Litre capacity touch screen monitor, 136 column palette-share display unit and a Kirloskar Champion UPS 1 KVA. The system has an ability to supply over 1305 shades accurately, consistently and instantly in several products covering a variety of application viz doors, windows, walls, exteriors, gates, grills etc.
During 2001-02, the company has entered into a technical agreement with EFTEC Shroff (India) Ltd. for the manufacture and supply of Automotive Paint Shop Sealers and Underbody Compounds.
The Company is in the process of setting up a new manufacturing unit at Bawal,Haryana at an estimated cost of Rs.100 crores with an annual capacity of 20000 MT p.a. The above project is being financed through internal accruals. During 2004-05 the company has setup a new greenfield plant, with a capacity of 20400 MT, at Bawal, district Rewari of Haryana and this was commissioned on 19th March 2005.
During 2003-04, the capacity at the Jainpur was increased by 24% for water based paints, by setting a new facility. Consequent to the approval of the High Court of Madras and Bombay the amalagmation of Chemguard Coatings Ltd with the company was completed on 1st September 2005.
During 2005-2006, the company made an investment in a Malaysian Company, a joint venture company between the company and Kansai Paint Co Ltd., Japan (Kansai), where the company will hold 55% stake and 45% Stake by Kansai. Further the Malaysian company has entered into an agreement to acquire the paint business of Sime Coatings Sdn.Bhd., Malaysian and this is subject to approval.
During the same period the companies Production capacity of Paints Varnishes and enamels has increased from 138400 MT to 153900 MT. The capacity of Synthetic Resins stood at 36250 MT and Capacity of Pretreatment Chemicals stood at 2400 MT.
MANAGEMENT & GOVERNANCE
|
Management |
|
|
Vice-Chairman |
D M Kothari |
|
Managing Director |
H M Bharucha |
|
Chairman |
Pradip P Shah |
|
Director |
Noel N Tata |
|
Whole-time Director |
Pravin D Chaudhari |
|
Company Secretary |
G T Govindarajan |
|
Director |
Masaru Tanaka |
|
Nominee |
Hidenori Furukawa |
|
Independent Director |
Brinda Somaya |
|
Director |
Katsuhiko Kato |
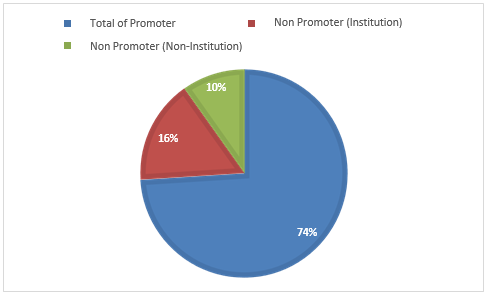
Shareholding Pattern as on June 2016
|
Share Holding |
||
|
|
No of Shares |
% of Holding |
|
Description as on |
|
|
|
Total of Promoter |
398736619 |
73.99 |
|
Non Promoter (Institution) |
87325663 |
16.2 |
|
Non Promoter (Non-Institution) |
52857438 |
9.81 |
|
Total Non Promoter |
140183101 |
26.01 |
|
Grand Total |
538919720 |
100 |
INDUSTRY OUTLOOK
The paints industry is an Oligopoly. Only a few players dominate the organized market.
- 65% is an organized market
- 35% is the unorganized market.
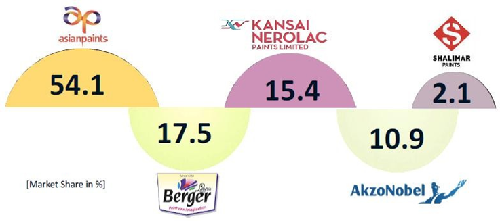
Organized - Asian Paints, Kansai Nerolac, Berger Paints, ICI control 80% of the organized market. Unorganized – 2000 SME paint manufacturing plants.
Market Share of paint companies in the organized market
Demand for paints comes from two broad categories
-
Decorative Paints
The decorative paints segment entails a major part of the industry and primarily caters to residential and commercial buildings. The decorative paint market has been further segmented into emulsions, enamel, distemper, and cement paints. Enamels are the most widely used followed by distempers and emulsions. Interior and exterior paints account for 75% and 25% of the decorative paints respectively.
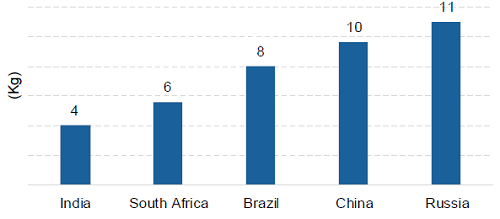
The paint industry currently stands at Rs 40,600 crore with per capita consumption increasing to over 4 kgs, out of which the decorative segment contributed nearly 73% at Rs. 29,638 crore, while the remaining Rs. 10,962 crore was contributed by the industrial segment. The major boost to the growth in the Indian paint market has been provided by the decorative paint segment, which is anticipated to grow more than 18%.
Per capita paint consumption
Industrial Paints
Three main segments of the industrial sector include automotive coating, high-performance coating, powder coating, and coil coating, adding the paper. Kansai Nerolac is the market leader in this segment. This segment includes paints used in automobiles, auto ancillaries, consumer durables, containers, etc. User industries for industrial paints include automobiles engineering and consumer durables. The industrial paints segment is far more technology-intensive than the decorative segment.
This segment is price sensitive and is a higher margin business as compared to the industrial segment. The paint industry is raw material intensive. Most of the raw materials are petroleum-based. Thus paint companies are enjoying margins with low crude oil prices. Raw materials frequently run into short supply, resulting in high inventory costs. The shortage of one specific material could result in severe manufacturing problems.
Kansai Nerolac Paints Ltd - INVESTMENT RATIONALE
Leader in automotive paints in India. Capacity addition of 42000MT in Gujurat, 38000MT in Amritsar will increase total output capacity by 23%.
Pioneers in making paints safe and Nerolac stands for healthy home paints. One stop solution for most eco-friendly and innovative Decorative paints and Industrial coatings. Low VOC and Lead free healthy home paints and market leaders in Industrial Coatings branded by Shahrukh khan.
The company has strong presence in automotive paints as it controls 45% of the organized Industrial paint segment. Company has invested huge money on R&D to be leader in innovation. They have 600 crore capex plan to increase capacity in next two years. This will help them match increasing demand.
Capacity Addition
Add: Gujarat having capacity of 42000 MT per year at an estimated cost of `350 Crores.
Add: Goindwal Sahib near Amritsar in Punjab having capacity of 38000 MT per year at an estimated cost of`180 Crores.
This will increase capacity by 23%.
Paint output in June 2016 up 6% YoY.
Consumption growth on the back of seventh pay commission payout as well as onset of festival demand has facilitated the industry to carry forward the volume growth momentum of second half of last fiscal into current fiscal. Rise in prices of some raw materials off-late is eliciting margin concerns.
The output of paints for the month of June 2016 stood at 70547 tonnes, a growth of 6.1%yoy. But the output of paints was down by 4.3%MoM from 73686 tonnes registered in May 2016. The output for the first quarter ended June 2016 was up by 10.4%yoy to 216988 tonnes. With this the growth momentum in output of paints sustained for the third quarter in a row. The output for H2FY2015-16 was up by 8.18%yoy to 398336 tonnes with the paints output for Q3FY16 and Q4FY16 up by 9.21% and 7.17% respectively.
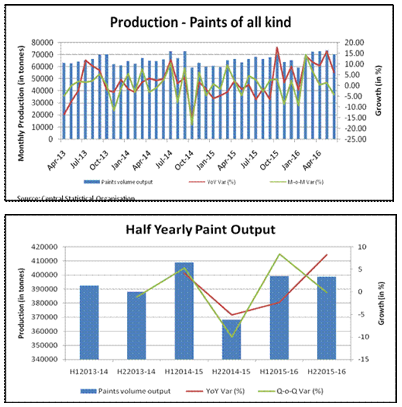
Paints demand though gets a boost by the way of approach of Deepawali festival in October 2016 backed by higher disposable income due to seventh pay commission payout as well as expected improvement in rural income the market conditions continues to be challenging and competitive especially in decorative coatings. This has forced the industry majors to be combative with aggressive price especially in price sensitive segments and other marketing strategic measures such as dealer/channel incentives etc. While the premium end products volume continues to growth from low base, the medium segment demand seems the one that is muted.
Price of some major raw materials marginally increases
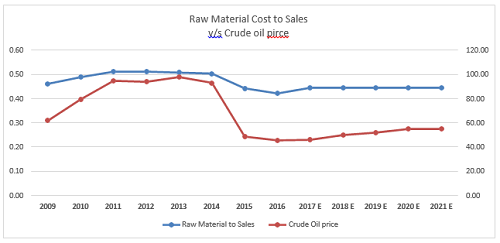
Paint Industry being one of raw material intensive and the raw material cost accounts for about 50-60% (~63% for Kansai Nerolac) of the total cost of production and thus the profit of the industry players swings with the material cost. Sharp decline in crude oil prices and consequent decline in raw material prices helped in margin expansion.
|
|
2009 |
2010 |
2011 |
2012 |
2013 |
2014 |
2015 |
2016 |
|
Purchases of Raw Material |
768.12 |
964.73 |
1270.74 |
1546.43 |
1715.23 |
1884.28 |
1866.01 |
1942.46 |
|
Sales Turnover |
1663.74 |
1971.7 |
2482.5 |
3019.88 |
3375.65 |
3739.02 |
4211.64 |
4604.36 |
|
Raw Material to Sales |
0.46 |
0.49 |
0.51 |
0.51 |
0.51 |
0.50 |
0.44 |
0.42 |
|
Crude Oil price |
61.95 |
79.48 |
94.88 |
94.05 |
97.98 |
93.17 |
48.66 |
45.55 |
|
Correlation or R2 |
0.9859 |
|
|
|
|
|
|
|
|
R |
0.97 |
|
|
|
|
|
|
|
We see positive (absolute) correlation between Raw Material Cost and Crude oil price. Thus when cost of paint production will increase or decrease with an increase or decrease with oil prices.
Raw materials are divided into three major groups
-
Pigments (titanium dioxide, zinc oxide etc.)
-
solvents (mineral turpentine)
-
resins and additives
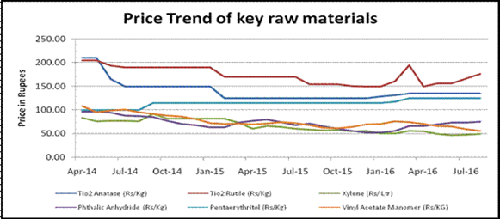
In the manufacture of paint there are more than 275 raw materials both crude based and non-crude based are consumed. Major of over 275 raw materials are phthalic anhydride (PAN), a petroleum-based material, and titanium dioxide (TiO2), which accounts for 30% of the total raw material requirement. Titanium Dioxide, a mineral-based material, is classified into two varieties, such as rutile grade and anatase grade. The paint companies have been opting for importing the anatase grade because of its better quality than those available from domestic sources. The other raw materials for the industry, such as organic pigments and Penta, are available domestically.
|
|
2017 E |
2018 E |
2019 E |
2020 E |
2021 E |
|
Crude Oil (S&P projections) |
46 |
50 |
52 |
55 |
55 |
Crude oil prices are expected to increase gradually, Tio2 prices are already on an uptrend, and advertisement costs are also increasing. This will increase the cost and margins are expected to dilute.
Rising demand in Urban India, attributable to increased purchasing power and changing consumer preferences.
The decorative paints segment has witnessed strong growth over the last few years on account of the substantial increase in disposable income. The demand for premium paints & niche products is growing due to changes in trends like paints for specific social occasions like marriage, Vastu, and festivals such as Diwali have led to the higher realization for decorative paints.
Indian consumer segment is broadly segregated into urban and rural markets and is attracting marketers from across the world. The sector comprises a huge middle class, relatively large affluent class, and a small economically disadvantaged class, with spending anticipated to more than double by 2025.
The growing purchasing power and the rising influence of social media have enabled Indian consumers to splurge on good things. The Indian consumer sector has grown at an annual rate of 5.7 percent between FY2005 to FY 2015. Annual growth in the Indian consumption market is estimated to be 6.7 percent during FY2015-20 and 7.1 percent during FY2021-25.
With 66% of its population under the age of 35, India is home to the largest cohort of young people in the world—825 million. The median age of the country is just 27 years, much below 37 in the US and 46 in Japan. India's demographic profile is unstable and is changing in a way that is quite favorable to economic growth. Growth of the working-age share of the population and increase in the number of nuclear families is fueling the rise in per capita spent.
Government’s sharp focus on infrastructure - Make in India, Housing for All, Smart Cities Mission, Sagarmala Project, Bharat Mala Project, Rurban Mission.
The government is readying a strategy to focus on infrastructure, agriculture, and restoring the health of the banking system as well as specific measures to ease stress in the rural economy as part of the 2016-17 Budget. The rural economy, a key driver of demand and support for the broader economy, has taken a knock from the two back-to-back seasons of patchy monsoon rains. The segment drives demand for everything from motorcycles to tractors, televisions, and refrigerators. Finance minister Arun Jaitley has already signaled the government's support by backing calls for raising investment in the crucial farm sector and leveraging technology to fire up growth. The government has taken several measures, including pumping in Rs 70,000 crore to recapitalize state-run banks.
Along with this, Smart cities mission, Sagarmala, Rurban Mission are infusing hundreds of crores on housing and development. This will indirectly create demand for paint.
Improved economic growth and lower inflation levels resulted in increased consumption and recovery in automotive segments to increase paint consumption will also create demand for the paint industry.
Expected PE expansion, revenue CAGR of 16% for FY17-FY21 will drive stock price in the future.
The company has differentiated its product portfolio by offering eco-friendly, lead-free, low VOC & economical series of affordable emulsion paints with High Definition Color Technology (HD). Also, the company launched eco-friendly plastic coatings for cars and a new range of powder coating products through technology tie-up with Protech Canada.
Kansai Nerolac has strong management and technical R&D team to handle changing customer needs. We believe with new projects and capacity expansion, Nerolac can match growing demand with an increase in supply. They have excellent client profiles and technical assistance agreements with companies.
Technical Assistance Agreements of the company with renowned players in the paint industry at an international level puts the company in a strong position to offer products that meet stringent international specifications.
-
Tie-up with Kansai Paints of Japan for the manufacture of Sophisticated architectural Coatings
-
E.I. Dupont De Nemours & Co. Inc. of the USA for automotive coatings
-
Oshima Kogyo Company Ltd., of Japan for heat resistant paints
-
Valspar Corporation of US for powder coatings
-
Drew Chemicals Corporation of US for water and fuel treatment chemicals
-
Ameron Inc. USA for high-performance coatings
Along with these, Nerolac is spending a good amount of money on advertisement to increase branding. We believe this will have long-term benefits for the company.
|
Co_Name |
Std Sales |
CAGR |
|||||
|
2011 |
2012 |
2013 2014 |
2015 |
2016 |
|||
|
Asian Paints |
7242.65 |
9118.92 |
10462.94 12167.02 |
13656.9 |
14950.6 |
|
12.8% |
|
Berger Paints |
2299.1 |
2901.22 |
3330.61 3735.35 |
4212.94 |
4580.72 |
|
12.2% |
|
Kansai Nerolac |
2482.5 |
3019.88 |
3375.65 3739.02 |
4211.64 |
4604.36 |
|
10.8% |
|
|
|
|
Sales Growth |
|
|
|
|
|
|
2011 |
2012 |
2013 2014 |
2015 |
2016 |
|
Geo Mean |
|
Asian Paints |
|
25.91% |
14.74% 16.29% |
12.25% |
9.47% |
|
14.8% |
|
Berger Paints |
|
26.19% |
14.80% 12.15% |
12.79% |
8.73% |
|
13.9% |
|
Kansai Nerolac |
|
21.65% |
11.78% 10.76% |
12.64% |
9.32% |
|
13.6% |
|
|
|
|
|
|
|
Industry Avg |
14.1% |
|
|
Capex |
CAGR |
|||||
|
2011 |
2012 |
2013 2014 |
2015 |
2016 |
|||
|
Asian Paints |
410.25 |
591.68 |
439.87 617.73 |
292.27 |
862.78 |
|
13.2% |
|
Berger Paints |
29.2 |
67.06 |
192.55 304.04 |
168.72 |
258.3 |
|
43.8% |
|
Kansai Nerolac |
56.44 |
12.15 |
141.84 112.46 |
238.74 |
-145.3 |
|
33.4% |
|
|
|
|
Capex % of Sales |
|
|
|
|
|
|
2011 |
2012 |
2013 2014 |
2015 |
2016 |
|
Geo Mean |
|
Asian Paints |
5.7% |
6.5% |
4.2% 5.1% |
2.1% |
5.8% |
|
4.6% |
|
Berger Paints |
1.3% |
2.3% |
5.8% 8.1% |
4.0% |
5.6% |
|
3.8% |
|
Kansai Nerolac |
2.3% |
0.4% |
4.2% 3.0% |
5.7% |
-3.2% |
|
2.3% |
|
|
|
|
|
|
|
Industry Avg |
3.6% |
|
Co_Name |
Advertisement and Sales Promotion |
|
|||
|
2011 |
2012 2013 2014 2015 |
2016 |
|||
|
Asian Paints |
282.35 |
338.59 422.87 504.03 596.72 |
740.05 |
|
|
|
Berger Paints |
103.2 |
136.73 170.71 194.95 258.61 |
295.09 |
|
|
|
Kansai Nerolac |
82.11 |
100.12 102.28 114.28 146.56 |
228.92 |
|
|
|
|
|
Advertisement and Sales Promotion % of Sales |
|
|
|
|
|
2011 |
2012 2013 2014 2015 |
2016 |
|
Geo Mean |
|
Asian Paints |
3.9% |
3.7% 4.0% 4.1% 4.4% |
4.9% |
|
4.2% |
|
Berger Paints |
4.5% |
4.7% 5.1% 5.2% 6.1% |
6.4% |
|
5.3% |
|
Kansai Nerolac |
3.3% |
3.3% 3.0% 3.1% 3.5% |
5.0% |
|
3.2% |
|
|
|
|
|
Industry Avg |
4.2% |
VALUATION
Kansai Nerolac is currently trading at 369 per share with a market capitalization of 19,945 Crores. It has total long-term debt of 64 Cr with long-term Debt to Equity of 0.03. It has total cash and bank balance of 479 Cr.
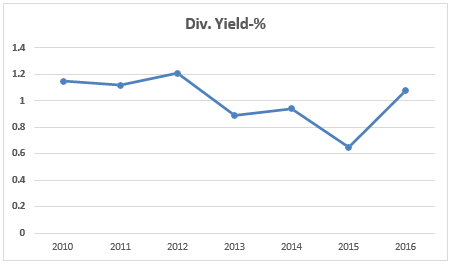
The company is a regular dividend payer.
|
Year-End |
Div. Yield-% |
|
2016 |
1.08 |
|
2015 |
0.65 |
|
2014 |
0.94 |
|
2013 |
0.89 |
|
2012 |
1.21 |
|
2011 |
1.12 |
|
2010 |
1.15 |
We have used DCF to value Kansai Nerolac with a fair price of Rs 323 per share. We have assumed an effective tax rate at 22%, cost of capital at 8.97%, and terminal growth rate at 7.5%. The company has CAPEX spending of 600 Crs for capacity expansion plans and for setting up an R&D facility in Mumbai. The company has enough cash for expansion and working capital needs. For valuation, we assume that over the period company will keep the capital structure unaltered and the tax rate unchanged.
Peer comparison
|
Key Sectoral Data |
|
|
Market Cap (Rs Crore) |
159442 |
|
Market Cap (USD Million) |
23447 |
|
P/ E |
48.7 |
|
P/ BV |
15.7 |
|
Debt/ Equity |
0.2 |
|
ROA (%) |
17.4 |
|
ROE (%) |
32.2 |
|
EV/ Sales |
6.3 |
|
EV/ EBITDA |
30.9 |
Kansai Nerolac is trading at discount to its peers. EV/EBITA is 13 against 26 for its immediate peers. We believe that the company should trade on par with its peer companies with strong brand equity, excellent client profile, healthy growth prospects, better return ratios, a strong balance sheet, and prudent management.
|
|
Inventories |
Capex |
P/E |
P/BV |
EV/EBIDTA |
||||||||||
|
Co_Name |
2014 |
2015 |
2016 |
2014 |
2015 |
2016 |
2014 |
2015 |
2016 |
2014 |
2015 |
2016 |
2014 |
2015 |
2016 |
|
Asian Paints |
2069.86 |
2258.52 |
2064 |
585.99 |
464.99 |
869.06 |
46.12 |
60.49 |
52.71 |
12.98 |
16.36 |
14.86 |
24.64 |
32.62 |
28.07 |
|
Berger Paints |
695.66 |
719.47 |
758.16 |
301.38 |
183.55 |
257.18 |
33.66 |
58.65 |
48.9 |
7.1 |
11.49 |
11.47 |
17.96 |
27.28 |
24.96 |
|
Kansai Nerolac |
658.33 |
555.14 |
582.72 |
113.22 |
238.68 |
-145.73 |
31.84 |
45.14 |
17.66 |
4.42 |
7.27 |
6.61 |
16.74 |
24.68 |
12.95 |
|
Co_Name |
CMP |
EPS (cons.) |
BV (cons.) |
P/E Ratio (cons.) |
P/BV (cons.) |
|
Asian Paints |
1191.2 |
19.64 |
58.44 |
60.55 |
20.35 |
|
Berger Paints |
260.2 |
4.26 |
15.23 |
61.16 |
17.09 |
|
Kansai Nerolac |
370.3 |
8.7 |
42.6 |
45.79 |
8.7 |
|
Average |
|
|
|
60.86 |
18.72 |
CONCUSSION AND RECOMMENDATION
With its substantial liquidity and financial strength along with long product life cycles, the company is well-positioned to address challenges related to technology evolution through acquisitions and internal investments. Capacity expansion by 23%, expected PE expansion, revenue CAGR of 16% for FY17-FY21 will drive stock price in the future. We recommend BUY on the stock at a CMP of Rs. 369 to the target of Rs. 412.
RISKS AND CONCERNS
-
Volatility in International oil prices
-
Dependent on the auto sector
-
De-growth in the construction and housing sector
-
Limited pricing flexibility in the decorative paint segment
-
The volatility of the Indian currency
FINANCIALS
Kansai Nerolac Paints Ltd. key Products/Revenue Segments include
-
Paints which contributed Rs 4326.28 Cr to Sales Value (99.74% of Total Sales)
-
Scrap which contributed Rs 9.70 Cr to Sales Value (0.22% of Total Sales)
-
Other Operating Revenue which contributed Rs 1.23 Cr to Sales Value (0.02% of Total Sales)
for the year ending 31-Mar-2016.
For the quarter ended 30-Jun-2016, the company has reported Standalone sales of Rs. 1044.64 Cr., up 17.61% from last quarter Sales of Rs. 888.20 Cr. and up 4.73% from last year same quarter Sales of Rs. 997.47 Cr. The company has reported a net profit after tax of Rs. 126.50 Cr. in the latest quarter.
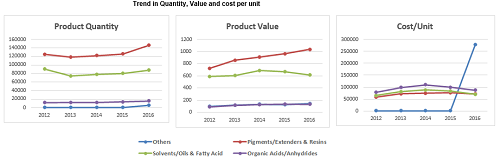
Revenue
|
ProductName |
2014 |
2015 |
2016 |
|||
|
|
Sales |
% of STO |
Sales |
% of STO |
% of STO |
Sales |
|
Paints,Varnish, Enamel&Powde Co |
3720.77 |
99.51 |
4194.99 |
99.6 |
4593.43 |
99.76 |
|
Other Operating Revenue |
18.25 |
0.49 |
16.65 |
0.4 |
10.93 |
0.24 |
The trend in Quantity, Value, and cost per unit
|
Income Statement |
2013 |
2014 |
2015 |
2016 |
2017 E |
2018 E |
2019 E |
2020 E |
2021 E |
|
Cr |
|
|
|
|
|
|
|
|
|
|
INCOME : |
|
|
|
|
|
|
|
|
|
|
Sales Turnover |
3387.12 |
3769.04 |
4251.62 |
4650.89 |
5500 |
6363 |
7364 |
8487 |
9781 |
|
Sales Growth |
|
11.28% |
12.80% |
9.39% |
18.25% |
15.70% |
15.73% |
15.24% |
15.26% |
|
Excise Duty |
363.81 |
404.33 |
457.5 |
506.99 |
593 |
686 |
794 |
915 |
1055 |
|
Net Sales |
3023.31 |
3364.71 |
3794.12 |
4143.9 |
4907 |
5677 |
6570 |
7571 |
8727 |
|
Other Income |
132.23 |
9.79 |
21.53 |
560.36 |
50 |
50 |
50 |
50 |
50 |
|
Stock Adjustments |
61.39 |
80.42 |
-62.58 |
12.62 |
0 |
0 |
0 |
0 |
0 |
|
Total Income |
3216.93 |
3454.92 |
3753.07 |
4716.88 |
4957 |
5727 |
6620 |
7621 |
8777 |
|
EXPENDITURE : |
|
|
|
|
|
|
|
|
|
|
Raw Materials |
1809.35 |
2003.85 |
2072.63 |
2121.36 |
2418 |
2802 |
3247 |
3747 |
4324 |
|
Power & Fuel Cost |
45.56 |
66.88 |
65.41 |
69.66 |
85 |
98 |
113 |
131 |
151 |
|
Employee Cost |
119.2 |
138.28 |
146.24 |
180.81 |
200 |
231 |
267 |
308 |
355 |
|
Other Manufacturing Expenses |
223.59 |
250.72 |
279.57 |
287.77 |
338 |
388 |
442 |
509 |
587 |
|
Selling and Administration Expenses |
467.96 |
528.14 |
616.73 |
799.18 |
964 |
1138 |
1343 |
1578 |
1856 |
|
Miscellaneous Expenses |
81.35 |
89.91 |
99.81 |
120.2 |
134 |
155 |
179 |
206 |
238 |
|
Total Expenditure |
2747.01 |
3077.78 |
3280.39 |
3578.98 |
4138 |
4811 |
5592 |
6480 |
7509 |
|
|
|
||||||||
|
EBITDA |
276.3 |
286.93 |
513.73 |
564.92 |
769 |
866 |
978 |
1092 |
1217 |
|
Depreciation |
47.35 |
65.52 |
68.26 |
68.36 |
84 |
97 |
112 |
129 |
149 |
|
EBIT |
422.57 |
311.62 |
404.42 |
1069.54 |
736 |
819 |
917 |
1013 |
1119 |
|
Interest |
0.68 |
1.79 |
0.92 |
0.54 |
8 |
8 |
9 |
10 |
11 |
|
PBT |
421.89 |
309.83 |
403.5 |
1069 |
728 |
811 |
907 |
1003 |
1107 |
|
Tax |
74.84 |
78.29 |
117.83 |
165.77 |
160 |
178 |
199 |
220 |
243 |
|
Fringe Benefit Tax |
0 |
0 |
0 |
0 |
0 |
0 |
0 |
0 |
0 |
|
Deferred Tax |
53.43 |
22.88 |
10.48 |
8.97 |
0 |
0 |
0 |
0 |
0 |
|
Net Profit |
293.62 |
208.66 |
275.19 |
894.26 |
568 |
633 |
708 |
783 |
864 |
|
Minority Interest (after tax) |
0.48 |
0.71 |
1.13 |
1.02 |
0 |
0 |
0 |
0 |
0 |
|
Profit/Loss of Associate Company |
0 |
0 |
0 |
0 |
0 |
0 |
0 |
0 |
0 |
|
Extraordinary Items |
86.16 |
1.88 |
3.47 |
422.42 |
0 |
0 |
0 |
0 |
0 |
|
Adjusted Net Profit |
206.98 |
206.07 |
270.59 |
470.82 |
568 |
633 |
708 |
783 |
864 |
|
Outstanding Shares |
|
|
534217650 |
538919720 |
538919720 |
538919720 |
538919720 |
538919720 |
538919720 |
|
EPS |
52.61 |
36.85 |
5.07 |
8.74 |
10.55 |
11.75 |
13.14 |
14.52 |
16.04 |
|
EBITDA Margin |
9.14% |
8.53% |
13.54% |
13.63% |
15.68% |
15.25% |
14.89% |
14.42% |
13.95% |
|
EBIT Margin |
13.98% |
9.26% |
10.66% |
25.81% |
14.99% |
14.43% |
13.95% |
13.38% |
12.82% |
|
PAT Margin |
6.43% |
5.96% |
7.21% |
9.98% |
11.47% |
11.06% |
10.70% |
10.27% |
9.85% |
|
Cons. Balance Sheet |
2014 |
2015 |
2016 |
2017E |
2018E |
2019E |
2020E |
2021E |
|
cr |
|
|
|
|
|
|
|
|
|
ASSETS |
|
|
|
|
|
|
||
|
Cash And Short Term Investments |
55 |
34 |
479 |
638 |
972 |
1342 |
1742 |
2176 |
|
Total Receivables, Net |
468 |
515 |
546 |
656 |
759 |
878 |
1012 |
1166 |
|
Total Inventory |
658 |
555 |
583 |
704 |
814 |
942 |
1086 |
1251 |
|
Other current assets, total |
64 |
237 |
566 |
487 |
564 |
653 |
752 |
867 |
|
Total current assets |
1246 |
1341 |
2172 |
2484 |
3109 |
3815 |
4592 |
5461 |
|
Property, plant & equipment, net |
922 |
916 |
938 |
1147 |
1327 |
1536 |
1770 |
2040 |
|
Goodwill, net + Intangibles, net |
0 |
0 |
0 |
0 |
0 |
0 |
0 |
0 |
|
other assets |
34 |
60 |
73 |
73 |
73 |
73 |
73 |
73 |
|
Total Assets |
2202 |
2318 |
3183 |
3705 |
4509 |
5425 |
6436 |
7574 |
|
|
|
|
|
|
|
|||
|
LIABILITIES |
|
|
|
|
|
|
||
|
Accounts payable |
455 |
333 |
412 |
459 |
531 |
615 |
709 |
817 |
|
short term debt |
79 |
97 |
207 |
207 |
207 |
207 |
207 |
207 |
|
other short term liabilities |
153 |
184 |
230 |
484 |
595 |
723 |
866 |
1032 |
|
Total current liabilities |
687 |
614 |
849 |
1151 |
1333 |
1545 |
1782 |
2056 |
|
Total long term debt |
68 |
51 |
47 |
47 |
47 |
47 |
47 |
47 |
|
Other liabilities, total |
29 |
25 |
17 |
17 |
17 |
17 |
17 |
17 |
|
Total liabilities |
784 |
691 |
913 |
1214 |
1397 |
1609 |
1846 |
2120 |
|
SHAREHOLDERS EQUITY |
|
|
|
|
|
|
|
|
|
Common stock |
54 |
54 |
54 |
54 |
54 |
54 |
54 |
54 |
|
Additional paid-in capital |
|
|
|
|
|
|
|
|
|
Retained earnings (accumulated deficit) |
1372 |
1548 |
2242 |
2682 |
3175 |
3729 |
4343 |
5024 |
|
Other equity, total |
|
|
|
|
|
|
|
|
|
Total equity |
1426 |
1601 |
2296 |
2736 |
3229 |
3783 |
4397 |
5078 |
|
|
|
|||||||
|
Total liabilities & shareholders' equity |
2202 |
2318 |
3183 |
3705 |
4509 |
5425 |
6436 |
7574 |
|
Cash Flow |
2015 |
2016 |
2017 E |
2018 E |
2019 E |
2020 E |
2021 E |
|
cr |
|
|
|
|
|
|
|
|
Cash in the Beginning |
55 |
34 |
479 |
638 |
972 |
1342 |
1742 |
|
OPERATIONS |
|
|
|
|
|
|
|
|
Net Income |
271 |
471 |
568 |
633 |
708 |
783 |
864 |
|
Depreciation |
68 |
68 |
84 |
97 |
112 |
129 |
149 |
|
other charge |
141 |
283 |
-333 |
-34 |
-39 |
-44 |
-51 |
|
WCC |
-272 |
76 |
255 |
111 |
128 |
144 |
166 |
|
Total cash from operations |
209 |
899 |
574 |
806 |
909 |
1011 |
1128 |
|
INVESTING |
|
|
|
|
|
|
|
|
Capital expenditures |
-239 |
146 |
-287 |
-332 |
-384 |
-443 |
-510 |
|
Other investing and cash flow items, total |
0 |
0 |
0 |
0 |
0 |
0 |
0 |
|
Total cash from investing |
-239 |
146 |
-287 |
-332 |
-384 |
-443 |
-510 |
|
FINANCING |
|
|
|
|
|
|
|
|
Financing cash flow items |
|
|
|
|
|
|
|
|
Total cash dividends paid |
-59 |
-75 |
-108 |
-120 |
-134 |
-148 |
-164 |
|
Issuance (retirement) of stock, net |
0 |
0 |
0 |
0 |
0 |
0 |
0 |
|
Issuance (retirement) of debt, net |
0 |
0 |
0 |
0 |
0 |
0 |
0 |
|
other |
-27 |
-20 |
-20 |
-20 |
-20 |
-20 |
-20 |
|
Total cash from financing |
-86 |
-96 |
-128 |
-140 |
-154 |
-169 |
-184 |
|
NET CHANGE IN CASH |
|
|
|
|
|
|
|
|
Foreign exchange effects |
0 |
0 |
0 |
0 |
0 |
0 |
0 |
|
Net change in cash |
-116 |
949 |
159 |
334 |
370 |
400 |
434 |
|
|
|
||||||
|
Cash in the END |
34 |
479 |
638 |
972 |
1342 |
1742 |
2176 |
- Share :


Post a Comment
|
DISCLAIMER |
This report is only for the information of our customers. Recommendations, opinions, or suggestions are given with the understanding that readers acting on this information assume all risks involved. The information provided herein is not to be construed as an offer to buy or sell securities of any kind. ATS and/or its group companies do not as assume any responsibility or liability resulting from the use of such information.