KARNATAKA BANK
Karnataka Bank Limited - Company Profile
Karnataka Bank Limited, a leading 'A' Class Scheduled Commercial Bank in India, was incorporated on February 18th, 1924 at Mangalore, a coastal town of Dakshina Kannada district in Karnataka State. Over the years the Bank grew with the merger of Sringeri Sharada Bank Ltd., Chitradurga Bank Ltd., and Bank of Karnataka. With over 88 years experience at the forefront of providing professional banking services and quality customer service, the bank now have a national presence with a network of 503 branches spread across 20 states and 2 Union Territories.
Karnataka Bank has set a lending target of Rs.3770 crore to Agriculture sector by March 2013. NABCONS, a wholly owned Company of NABARD is a leader in consultancy services in the field of agriculture and rural development, serving both national and international clients viz: Govt. of India, State Governments, Banks and Financial Institutions, Companies, individuals, International Agencies etc.
Karnataka Bank Limited - STOCK INFORMATION
|
STOCK PRICE |
143.00 |
|
TARGET PRICE |
150-160 |
|
SECTOR |
PVT. BANK |
|
SYMBOL (AT NSE) |
KTKBANK |
|
ISIN |
INE614B01018 |
|
FACE VALUE (IN RS.) |
10.00 |
|
BSE CODE |
532652 |
Karnataka Bank Limited - STOCK FUNDAMENTALS
|
MARKET CAP |
2695.91 |
|
BOOK VALUE |
161.96 |
|
EPS - (TTM) (IN RS. CR.) |
21.12 |
|
P/E |
6.77 |
|
INDUSTRY P/E |
21.47 |
INVESTMENT RATIONALE
Karnataka Bank net profit jumps to Rs. 800.70 million as against Rs. 720.50 million in the corresponding quarter end- ing of previous year, an increase of 11.13%. Revenue for the quarter rose 20.90% to Rs. 9643.40 million from Rs. 7976.50 million, when compared with the prior year period. Reported earnings per share of the company stood at Rs. 4.25 a share during the quarter, registering 11.10% an increase over previous year period. Net Interest Income is Rs. 3140.40 millions as against Rs. 2720.10 millions in the corresponding period of the previous year.
SHAREHOLDING PATTERN

OUTLOOK AND VALUATION
At the current market price of Rs.143, the stock P/E ratio is at 8.22 x FY13E and 6.61 x FY14E respectively. Earning per share (EPS) of the company for the earnings for FY13E and FY14E is seen at Rs. 19.70 and Rs.24.49 respectively. Net Income and PAT of the company are expected to grow at a CAGR of 23% and 31% over 2011 to 2014E respectively. On the basis of Debt-Equity Ratio, the stock trades at 12.69 x for FY13E and 12.63 x for FY14E. Price to Book Value of the stock is expected to be at 1.03 x and 0.89 x for FY13E and FY14E respectively. We expect that the company will keep its growth story in the coming quarters also. We recommend ‘BUY’ in this particular scrip with a target price of Rs 150-160 for medium-term investment.
RESULTS (Quarterly )(Rs CR.)
|
|
SEP' 14 |
JUN' 14 |
MAR' 14 |
DEC' 13 |
SEP' 13 |
|
Sales |
1,175.67 |
1,124.54 |
1,058.60 |
1,067.69 |
1,064.69 |
|
Operating profit |
854.61 |
848.73 |
745.45 |
826.68 |
737.28 |
|
Interest |
878.40 |
846.33 |
808.67 |
796.19 |
780.15 |
|
Gross profit |
162.62 |
188.04 |
89.15 |
168.75 |
171.64 |
|
EPS (Rs) |
4.69 |
6.45 |
4.31 |
5.66 |
1.54 |
TECHNICAL VIEW
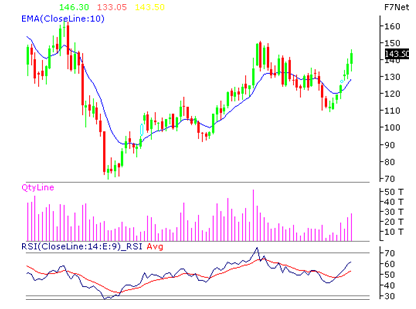
Karnataka Bank LTD is looking strong on charts. We advise to buy around 140-145 with stop loss of 134 for the targets of 150-160 levels. RSI is also showing upside momentum in it on weekly charts.
|
SYMBOL |
VALUE |
ACTION |
|
RSI(14) |
69.746 |
BUY |
|
STOCH(9,6) |
58.987 |
NEUTRAL |
|
STOCHRSI(14) |
83.617 |
OVERBOUGHT |
|
MACD(12,26) |
1.270 |
BUY |
|
ADX(14) |
43.227 |
BUY |
|
WILLIAMS %R |
-10.495 |
OVERBOUGHT |
|
CCI(14) |
152.5652 |
BUY |
|
ATR(14) |
5.6214 |
HIGH VOLATILITY |
|
HIGH/LOWS(14) |
6.2250 |
BUY |
|
ULTIMATE OSCILLATOR |
52.864 |
BUY |
|
ROC |
19.366 |
BUY |
|
BULL/BEAR POWER()13 |
16.7720 |
BUY |
|
BUY: 09 SELL:0 NEUTRAL: 2 |
SUMMARY : STRONG BUY |
|
Our Other Recommendation for Next Week
|
SCRIP |
ACTION |
CMP |
ENTRY |
SL |
TGT |
TIME FRAME |
|
CAIRN |
SELL |
270.85 |
260-265 |
278 |
250-240 |
ONE WEEK |
|
BHARATFORGE |
BUY |
916.15 |
940-920 |
900 |
980 |
ONE WEEK |
|
ADANIPOWER |
SELL |
45.45 |
44-46 |
48 |
44-42 |
ONE WEEK |
|
HINDALCO |
BUY |
160.45 |
156-160 |
150 |
164-168 |
ONE WEEK |
|
FEDERAL BANK |
BUY |
147.7 |
145-148 |
140 |
152-155 |
ONE WEEK |
Performance of Previous Week
|
SCRIP |
LOT |
ACTION |
ENTRY |
SL |
TGT |
P&L |
REMARK |
CLOSE/LOW/HIGH |
|
SIEMENS |
250 |
BUY |
900-920 |
875 |
950-975 |
7500.00 |
FIRST TGT HIT |
909.90 / 955.95 |
|
ADANI PORT |
1000 |
BUY |
295-298 |
292 |
304-309 |
13950.00 |
BOTH TGT HIT |
302.75 / 308.95 |
|
LUPIN |
250 |
BUY |
1425-1450 |
1400 |
1480-1490 |
11250.00 |
FIRST TGT HIT |
1469.50 / 1481.80 |
|
VOLTAS |
1000 |
BUY |
270-272 |
266 |
276-280 |
10000.00 |
BOTH TGT HIT |
276.40 / 281.00 |
|
HINDALCO |
2000 |
BUY |
155-158 |
150 |
162-165 |
12000.00 |
NEAR TGT |
160.45 / 161.25 |
|
ADANI ENT |
500 |
BUY |
485- 490 |
475 |
500-510 |
-5000.00 |
SL TRG |
478.40 / 505.95 |
|
NET PROFIT |
|
|
|
|
|
49700.00 |
|
|
- Share :


Post a Comment
|
DISCLAIMER |
This report is only for the information of our customers. Recommendations, opinions, or suggestions are given with the understanding that readers acting on this information assume all risks involved. The information provided herein is not to be construed as an offer to buy or sell securities of any kind. ATS and/or its group companies do not as assume any responsibility or liability resulting from the use of such information.