KEI Industries
KEI Industries Limited - Background
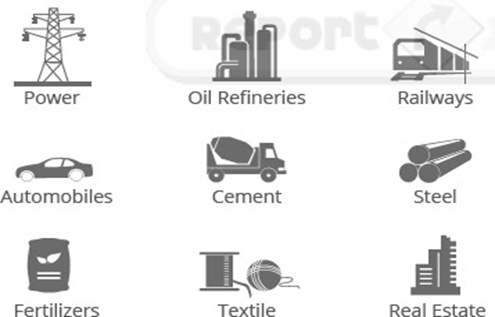
KEI Industries Limited is an India-based company engaged in the manufacturing and marketing of power cables for retail and institutional segments. The company operates through Cables, Stainless Steel Wire, and Turnkey Projects segments. Cables segment comprises of extra high voltage (EHV), high tension (HT) and low tension (LT) power cables, control and instrumentation cables, winding wires, and flexible and house wires. Stainless Steel Wire segment includes stainless steel wire. Its product portfolio includes EHV, MV and LV power cables, control and instrumentation cables, specialty cables, elastomeric cables, rubber cables, submersible cables, flexible and house wires, winding wires and stainless steel wires. Its cable products are used in oil refineries, railways, automobiles, cement, steel, fertilizers, textile and real estate sectors. The Company is also engaged in Engineering, Procurement and Construction (EPC) business. Source: Reuters
|
Key Parameters |
|
|
BSE Code |
517569 |
|
NSE Code |
KEI |
|
Reuters Code |
KEIN.NS |
|
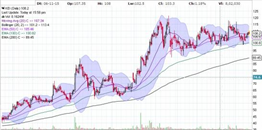
CMP (as on 22/12/2015) |
107.90 |
|
Stock Beta |
1.39 |
|
52 Week H/L |
121.70 |
|
Market Cap (Cr) |
833.39 |
|
Equity Capital (Rs cr) |
15.45 |
|
Face Value (Rs) |
2 |
|
Average Volume |
162363 |
|
|
|
|
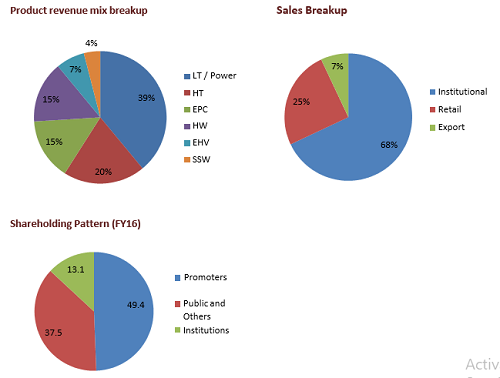
Shareholding Pattern (%) |
|
|
Promoters |
49.40 |
|
Non Institutions |
50.51 |
|
Grand Total |
100 |
KEI Industries Limited - Investment Rationale
-
Wide product portfolio
-
Strong order book and exports
-
Growth prospects of the economy
-
Increase in retail footprint
-
Growth prospects of EPC sector
KEI Industries Limited - Risks and Concerns
-
Dependence on end user industry
-
Cost fluctuations
Conclusion & Recommendation
KEI Industries Ltd being a dominant player in domestic and international wire and cable marlet with its high quality products and wise market reach in both India and abroad. With debt reduction and growth opportunities we expect company to outperform the industry in the both medium term and long term future.
At the current market price of Rs.107.90 the stock is trading at ~7x FY17E EPS. Investors could buy the stock at CMP and add on dips to around Rs.96 to Rs.94 levels (~6x FY17E EPS) for our sequential targets of Rs.136 and Rs.166(~9x to ~11x FY17E EPS).
KEI Industries Limited - Financial Summary
|
Particulars (Rs. in Crs) |
FY13 |
FY14 |
FY15 |
FY16E |
FY17E |
|
Net Sales |
1639.79 |
1602.35 |
2020.06 |
2437.8 |
2998.5 |
|
Operating Profit |
172.87 |
154.32 |
197.86 |
244.7 |
280.4 |
|
PAT |
26.34 |
11.6 |
32.56 |
80.8 |
121.7 |
|
EPS (Rs.) |
3.41 |
1.50 |
4.21 |
10.46 |
15.75 |
|
PE (x) |
31.64 |
71.86 |
25.60 |
10.31 |
6.85 |
KEI Industries Limited - Business Profile
Product portfolio
-
Extra High Voltage cables up to & including 220 kV
-
High & Medium Voltage cables
-
Low Tension cables
-
Control and instrumentation cables
-
Specialty cables
-
Rubber cables
-
Winding, Flexibles and house wires
-
Submersible cables,
-
OVC/poly wrapped winding wires
-
Stainless steel wires
-
Engineering, Procurement and Construction (EPC)
Wide Sectoral presence
Our manufacturing capacities
-
500 km of EHV cables
-
5,100 km of HT cables
-
67,000 km of LT cables, control cables, power
-
cables, instrumentation cables, rubber cables
-
2,80,000 km of winding, flexible & house wires
-
4,800 MT of stainless steel wire
Investment Rationales
Wide product portfolio
KEI’s 400-strong product portfolio comprises a healthy mix of Extra High Voltage (EHV) cables (upto 220 kV), Low Tension (LT) and High Tension (HT) cables, Control and Instrumentation cables, Specialty and Rubber cables, Stainless Steel wires and winding, Flexible and Housing wires, Submersible cables. Its diverse range of products is designed to address the complete cabling needs of private and public sector customers across Power, Oil Refineries, Railways, Automobiles, Cement, Steel, Fertilizers, Textiles and Real Estate. The Company’s products find utility in the domestic and overseas markets, lending it a distinctive position as one of the top three cable manufacturing companies in India. The Company has a technical collaboration with Switzerland-based Brugg Kabel AG to manufacture EHV cables (ranging from 66kV to 220kV) at its Chopanki (Rajasthan) facility. KEI’s state-of-the-art manufacturing facilities are located at Bhiwadi, Chopanki and Silvassa. The Company is well positioned to harness the plethora of possibilities it sees opening up across its business segments, domestically and globally.
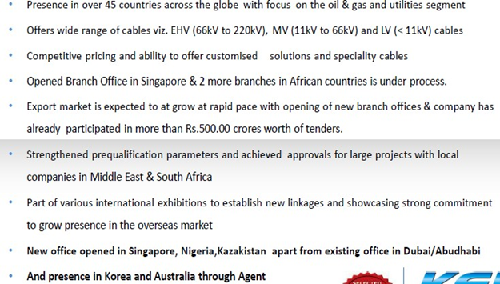
Strong order book and exports
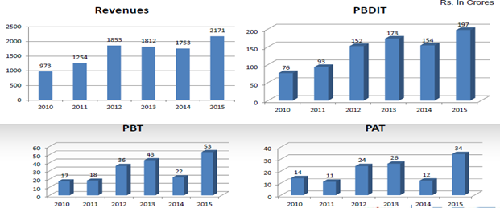
The company has total order book of around ` account for `Rs1900 Cr turnkey projects of Rs 800 Cr, 200 Cr orders are from EHV segment and rest for cables. With operations in more than 47 countries, KEI Industries Ltd has a strong exports base, which has witnessed consistent CAGR growth in recent years. Though the division witnessed some slowdown in FY15, the inherent strengths of the business and the overseas opportunity matrix shall continue to drive exponential growth in this segment in the coming years. Exports declined to ` 147 crores in FY15, from ` 197 crores in the previous fiscal, mainly on account of delay in execution of several contracts. With the current pace KEI is expected to reach Rs 250 from its revenues.
Growth prospects of the economy
The wire and cables market in India comprises nearly 40% of the electric industry and is expected to double in size in the next five years. Increased per capita income is further expected to boost demand for cables, going forward. Government investments in power and telecommunication, coupled with rapid industrialization and urbanization, will also contribute in a big way to growth in this segment. Major expansion in steel, cement, oil & gas, energy, automobiles, highways, ports, airports, SEZs, housing, IT parks, hotels, shopping malls and BPOs would increase the demand for cables. As the consumer real estate and consumer houses witness massive expansion in the coming years, this will have a cascading positive effect on the retail market.
Increase in retail footprint
The retail division, comprising household wires as well as LT and HT cables, has witnessed considerable growth in recent years, currently contributing around 27% to the Company’s revenues. A wide distribution network, spread across India and overseas, has continuously driven the division’s expansion, enabling KEI Industries Ltd to position itself as a specialist cable manufacturer. Backed by the Company’s strong brand equity, its dealer network of 900+ has led the aggressive growth plans of KEI Industries Ltd, particularly in the Northern and Western regions of India. The Company’s dealer-driven expansion plan is based on a pan India approach seeking to create new avenues of collaborative growth with realty developers, building contractors and architects, among others. More than 30% dealer additions helped in significant expansion of our nationwide dealer network and we shall continue with this pace of expansion in the coming year to further push growth in this segment. With 50% revenue growth in FY15, our retail sales currently account for 27% of the total sales, which we expect to push up significantly on the back of our expanded dealer network, coupled with our aggressive branding and marketing strategy.
Governmental initiatives
With the power sector now open to 100% FDI permitted under the automatic route and the government targeting capacity addition of 88.5 GW during FY12-17 and 86.4 GW during FY17-22, cable demand in the country is expected to grow exponentially in the coming years. The large product portfolio, presence across the power and EPC value chains, expanding retail distribution network and robust R&D core have catapulted us to an enviable position on the competitive landscape.
Growth prospects of EPC sector
The EPC sector is projected to be a multi-billion-dollar industry with infrastructure projects, especially the metro rail projects, witnessing substantial demand uptick. The government’s plan to spend $1trn on infrastructure in the next five years will contribute immensely to steering growth in this segment. As a leading supplier to DMRC, Chennai Metro, Bengaluru Metro and Hyderabad Metro for the last three years, we are ideally equipped to take on the new, emerging opportunities in this area. Increased investments in power sector, as manifest in the large number of orders currently being finalized by Power Grid Corporation in the transmission sector, augur well for the Company. Additionally, discoms/distribution companies are also placing significant orders in the underground cabling, R-APDRP schemes and rural electrification program. Given the demand scenario, and our existing visibility in EPC, we expect major growth in the Institutional business, going forward. As one of the only three companies in this high-margin business, we see this segment translating into a significant revenue earner for us as we get ready to utilize our manufacturing capacities to the full.
Consistent growth and sound financials
Strong clientele
KEI Industries Ltd has clients from different sectors such as power, energy, refineries, steel, energy, auto, and many more. Clients include ABB, NTPC, BHEL, TATA, Reliance, and many more leading players in the industry. With improvement in market demand for its products and overall economic scenario, KEI IS expected to benefit from the same.
Industry Overview
The wires and cables in the India has witnessed a growth in recent years on account of rising demand wires and cables fueled by expansion in infrastructure development, electricity consumption and others. The surge in revenue is majorly originated from growth in power cables as a segment of wires and cables market. The upsurge in this segment has been largely led by the domestic factors such government expenditure on infrastructure, increase in level of investment, rising level of disposable income, technological advancement. The wires and cables market in India is comprised of few major organized sector players such as Polycab wires ltd which posses a large product portfolio of wires and cables products. The India wires and cables market revenues have grown at a CAGR of 16.4% from 2009-2014.
The India wires and cables market will grow at a considerable CAGR rate and will reach over INR 590 million by 2019 due to the increasing number of manufacturers and rising investment in different sectors. While rising disposable incomes, boom in population and increasing investment (both private and government) in infrastructure will result in increased spending on wires and cables in the India, volatility in income levels and price of wires and cables products are few of the major challenges which will affect the growth of this industry in the future.The India wires and cables market is comprised of various independent manufacturers that specialize in designing, manufacturing of their products. The wires and cables market in India is led by five major players including Polycab wires, Sterlite technologies, Finolex cables, KEI Industries and Havells India, who cover around ~% of organized market for wires and cables. Polycab sold ~ million units in FY’2014 followed by Sterlite technologies which sold ~ million units in the same year.
Technological advancements and product iKEI Industriesnnovations across different segments as well as competitive pressures have been significantly changing the market. Revenues from the wires and cables industry in the India are expected to expand to INR ~ million in FY’2019 growing with a CAGR of 18.5% from FY’2014-FY’2019. The market is expected to grow in the coming years with increasing number of innovative product launches by the existing players, focusing on niche uses and convenience such as fire resistant (retardant) wires and cables, optical fibre cables and others. With the consumers becoming more perceptive towards value addition, providing products by anticipating the consumer needs in advance and broadening the appeal of the product to suit a variety of needs could prove vital for the growth of this industry in the coming years.
The wires and cables market in India is comprised of nearly 40 percent of the electrical industry. According to industry experts, it is expected to double in size in the next five years. The industry is growing at a compound annual growth rate (CAGR) of 15 percent. The market has been growing steadily, and according to recent research at Netscribes, it is expected to touch Rs 572 billion by 2018. The increasing importance of power, light, and communication has kept the demand high for wires and cables. This trend will continue as demand for reliable, efficient energy and data communications will strengthen the wires and cables industry in the future as well. As the new government is focusing on ‘Make in India’, the industry can grow at a similar rate for the next five years.
By 2022, the installed power capacity in India is expected to reach 350 gigawatts (GW) from 243 GW in 2014, on the back of increasing industrialization and economic development. The total market size of electrical machinery in India is anticipated to reach US$ 100 billion by 2022 from US$ 24 billion in 2013. The electrical machinery sector consists of generation, transmission, and distribution machinery. The transmission and distribution market expanded at a compound annual growth rate (CAGR) of 6.7 percent over FY07-13. Boilers (16 percent), cables (15 percent), and transmission lines and conductors (12 percent) account for a large chunk of the revenue. The generation equipment market is expected to expand at a CAGR of 12.7 percent over FY12–22.
The exports of electrical machinery rose to US$ 3.9 billion in FY14 from US$ 3.4 billion in FY12. Boilers & parts and electrical wires and cables were the primary drivers of the increase in exports The Government of India has been de-licensed the electrical machinery industry and has allowed 100 percent foreign direct investment (FDI) in the sector. It plans to set up the Electrical Equipment Skill Development Council (EDC) which would focus on identifying critical manufacturing skills required for the electrical machinery industry.
Risks and Concerns
Dependence on end user industry
KEI’S majority revenue comes from selling its products to the various end user industries. So the its performance over dependant on end user industries demands.
Cost fluctuations
Cost of copper and aluminium contributes ~76% in the cost of production for KEI. The fluctuations in raw materials can hamper its margins.
Financials
Quarterly financial review
-
Total income has risen 21 percent and profit is up 66 percent for the quarter ended September.
-
In turkey segment, the company’s sales were high by 80 percent.
-
EHV segment revenue at Rs 32 crore also performed well. Exports grew by a healthy 66% YoY.
Q2FY16
|
|
2nd Qtr 201509 |
2nd Qtr 201409 |
VAR [%] |
2nd Qtr 201509 |
1st Qtr 201506 |
VAR [%] |
|
Gross Sales |
607.97 |
502.34 |
21 |
607.97 |
514.55 |
18.2 |
|
Excise Duty |
0 |
0 |
0 |
0 |
0 |
0 |
|
Net Sales |
607.97 |
502.34 |
21 |
607.97 |
514.55 |
18.2 |
|
Other Operating Income |
3.59 |
2.51 |
43 |
3.59 |
3.85 |
-6.8 |
|
Other Income |
0.01 |
0.8 |
-98.8 |
0.01 |
1.28 |
-99.2 |
|
Total Income |
611.57 |
505.65 |
20.9 |
611.57 |
519.68 |
17.7 |
|
Total Expenditure |
552.4 |
456.6 |
21 |
552.4 |
463.67 |
19.1 |
|
PBIDT |
59.16 |
49.05 |
20.6 |
59.16 |
56.01 |
5.6 |
|
Interest |
30.3 |
29.31 |
3.4 |
30.3 |
33.14 |
-8.6 |
|
PBDT |
28.86 |
19.74 |
46.2 |
28.86 |
22.86 |
26.2 |
|
Depreciation |
6.19 |
6.13 |
1 |
6.19 |
6.04 |
2.5 |
|
PBT |
22.67 |
13.61 |
66.6 |
22.67 |
16.82 |
34.8 |
|
Tax |
7.32 |
4.35 |
68.3 |
7.32 |
5.12 |
43.0 |
|
Fringe Benefit Tax |
0 |
0 |
0 |
0 |
0 |
0 |
|
Deferred Tax |
0 |
0 |
0 |
0 |
0 |
0 |
|
Reported Profit After Tax |
15.36 |
9.26 |
65.9 |
15.36 |
11.7 |
31.3 |
|
Extra-ordinary Items |
0 |
0 |
0 |
0 |
0 |
0 |
|
Adj Profit After Extra-ordinary item |
15.36 |
9.26 |
65.9 |
15.36 |
11.7 |
31.3 |
|
|
|
|
|
|
|
|
|
PBIDTM(%) |
9.73 |
9.76 |
-0.3 |
9.73 |
10.89 |
-10.7 |
|
PBDTM(%) |
4.75 |
3.93 |
20.9 |
4.75 |
4.44 |
7.0 |
|
PATM(%) |
2.53 |
1.84 |
37.5 |
2.53 |
2.27 |
11.5 |
Profit and Loss Account as per rough estimates
|
|
FY13 |
FY14 |
FY15 |
FY16E |
FY17E |
|
Gross Sales |
1639.79 |
1602.35 |
2020.06 |
2437.77 |
2998.46 |
|
Excise Duty |
0 |
0 |
0 |
0.00 |
0.00 |
|
Reserves & Surplus |
241.52 |
253.91 |
288.4 |
299.40 |
347.40 |
|
Other Operating Income |
18.57 |
16.56 |
10.89 |
10.61 |
8.26 |
|
Other Income |
2.36 |
1.28 |
4.99 |
2.55 |
2.31 |
|
Total Income |
1660.71 |
1620.19 |
2035.94 |
2450.93 |
3009.03 |
|
Total Expenditure |
1487.83 |
1465.87 |
1838.08 |
2206.18 |
2728.60 |
|
PBIDT |
172.87 |
154.32 |
197.86 |
244.75 |
280.44 |
|
Interest |
109.35 |
111.53 |
120.4 |
96.25 |
77.09 |
|
PBDT |
63.52 |
42.79 |
77.47 |
148.50 |
203.35 |
|
Depreciation |
20.44 |
20.97 |
24.59 |
26.02 |
27.05 |
|
PBT |
43.08 |
21.82 |
52.88 |
122.48 |
176.30 |
|
Tax |
16.74 |
10.22 |
18.63 |
41.64 |
54.65 |
|
Fringe Benefit Tax |
0 |
0 |
0 |
0.00 |
0.00 |
|
Deferred Tax |
0 |
0 |
0 |
0.00 |
0.00 |
|
Reported Profit After Tax |
26.34 |
11.6 |
34.25 |
80.84 |
121.65 |
|
Extra-ordinary Items |
0 |
0 |
1.69 |
0.00 |
0.00 |
|
Adj Profit After Extra-ordinary item |
26.34 |
11.6 |
32.56 |
80.84 |
121.65 |
Balance Sheet as per rough estimates
|
|
FY13 |
FY14 |
FY15 |
FY16E |
FY17E |
|
SOURCES OF FUNDS: |
|
|
|
|
|
|
Share Capital |
14.05 |
14.75 |
15.45 |
15.45 |
15.45 |
|
Reserves & Surplus |
241.52 |
253.91 |
288.4 |
299.40 |
347.40 |
|
Equity Share Warrants |
0 |
4.43 |
0 |
0.00 |
0.00 |
|
Loan Funds |
389.47 |
443.51 |
375.82 |
320.82 |
265.82 |
|
Deferred Tax Liability |
10.56 |
16.04 |
23.54 |
29.69 |
34.23 |
|
Other Liabilities |
2.14 |
2.35 |
3.2 |
3.51 |
3.97 |
|
Total Liabilities |
657.74 |
734.97 |
706.4 |
668.87 |
666.50 |
|
APPLICATION OF FUNDS: |
|
|
|
|
|
|
Fixed Assets |
311.47 |
314.32 |
302.47 |
306.15 |
300.55 |
|
Investments |
3.08 |
3.09 |
3.14 |
3.13 |
3.15 |
|
Current Assets, Loans & Advances |
857.33 |
922.71 |
1031.27 |
1050.61 |
1102.08 |
|
Inventories |
358.16 |
403.14 |
440.32 |
483.33 |
526.03 |
|
Sundry Debtors |
421.22 |
428.63 |
479.84 |
452.86 |
452.77 |
|
Cash & Bank Balance |
15.62 |
4.56 |
4.69 |
3.74 |
2.21 |
|
Other Current Assets |
16.83 |
25.84 |
39.92 |
43.26 |
49.48 |
|
Loans & Advances |
45.5 |
60.55 |
66.51 |
67.43 |
71.59 |
|
Current Liabilities & Provisions |
519.41 |
508.54 |
635.34 |
694.78 |
742.66 |
|
Current Liabilities |
514.83 |
503.89 |
626.34 |
685.79 |
732.36 |
|
Provisions |
4.58 |
4.65 |
9 |
8.99 |
10.30 |
|
Net Current Assets |
337.92 |
414.17 |
395.93 |
355.83 |
359.42 |
|
Other Assets |
5.27 |
3.4 |
4.86 |
3.76 |
3.44 |
|
Total Assets |
657.74 |
734.97 |
706.4 |
668.87 |
666.5 |
Conclusion and Recommendation
We are positive on KEI over the long term and hence recommend a BUY at CMP of Rs.107.90 and further add on declines between Rs.96 to Rs.96 for a target of Rs.136 to Rs.166 with stop loss maintained at Rs.90.
- Share :


Post a Comment
|
DISCLAIMER |
This report is only for the information of our customers. Recommendations, opinions, or suggestions are given with the understanding that readers acting on this information assume all risks involved. The information provided herein is not to be construed as an offer to buy or sell securities of any kind. ATS and/or its group companies do not as assume any responsibility or liability resulting from the use of such information.