KITEX GARMENTS Ltd.
Kitex Garments Ltd., incorporated in the year 1992, is an India based company engaged in the manufacture of fabric and readymade garments. The company’s products are readymade garments. It operates in two segments: Garments and Fabric.
Kitex Garments Ltd - Key Stock Indicators
|
BSE Code |
521248 |
|
NSE Code |
KITEX |
|
Reuters Code |
KITE.NS |
|
Stock Beta |
1.2643 |
|
Price (Rs) as on 21TH June 2015 |
905 |
|
Equity Capital (Rs Cr) |
4.75 |
|
Face Value (Rs) |
1.00 |
|
Market Cap (Rs cr.) |
4725 |
|
Book Value (Rs) |
55.55 |
|
Avg. Volume (52 Week) |
186,385 |
|
52 wk H/L (Rs) |
1074/219.10 |
|
Shareholding Pattern |
|
|
(As on Mar 31, 2015) |
% Holding |
|
Promoters |
54.24 |
|
Institutions |
14.27 |
|
Non Institutions |
31.49 |
Kitex Garments Ltd - CATALYSTS FOR GROWTH
-
Expanding to US and Europe market with organic and inorganic growth. In final stage of a brand launch and tie-up with US brand.
-
Investment in capital expenditure may yield excess return.
-
Sustained operating margins.
Kitex Garments Ltd - KEY RISKS
-
80% revenue from top 4 customers
-
Increase in input costs, especially that of cotton yarn
-
Appreciation of rupee will bring down exports.
RECOMMENDATION
We believe company will sustain similar operating margins and profit margins over the next years. With strong and experienced promoters on board, company will flourish impressively.
We recommend BUY rating above 1000 to TARGET of 1250 for this year.
|
|
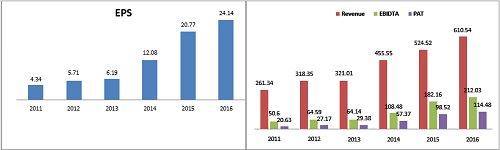
FY 2014 |
FY 2015 |
FY 2016 E |
FY 2017 E |
|
Total Income |
455.55 |
524.52 |
610.54 |
710.67 |
|
EBITDA |
108.48 |
182.16 |
212.03 |
246.81 |
|
EBITDA margin |
23.81% |
34.73% |
34.73% |
34.73% |
|
EBIT |
98.8 |
160.83 |
187.21 |
217.91 |
|
Net Income |
57.37 |
98.52 |
114.68 |
133.48 |
|
NET margin |
12.59% |
18.78% |
18.78% |
18.78 |
|
EPS |
12.08 |
20.74 |
24.14 |
28.10 |
|
EPS growth |
95.27% |
71.73% |
16.40% |
16.40% |
Kitex Garments Ltd - BUSINESS OVERVIEW
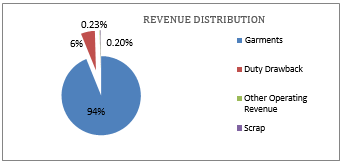
Kitex Garments Ltd. key Products/Revenue Segments include
-
Garments which contributed Rs 479.02 Cr to Revenue (93.72% of Revenue),
-
Duty Drawback which contributed Rs 29.12 Cr to Revenue (5.69% of Revenue),
-
Other Operating Revenue which contributed Rs 1.21 Cr to Revenue (0.23% of Revenue),
-
Scrap which contributed Rs 1.05 Cr to Revenue (0.20% of Revenue),
-
Job Work which contributed Rs 0.69 Cr to Revenue (0.13% of Revenue), for the year ending 31-Mar-2015.
Management
Name
Designation
Sabu M Jacob
Chairman & Managing Director
Benni Joseph
Director
C Mohan
Director
Erumala Mathew Paulose
Director
K L V Narayanan
Director
A Babu
Company Secretary
Sindhu Chandrasekhar
Whole-time Director
KEY HIGHLIGHTS
-
Credit rating agencies upgraded its term loan programme to AA- (43.02 Cr) and Short term debt to A1+ (20 Cr). ICRA
Key Ratios
2011-03
2012-03
2013-03
2014-03
2015-03
Debt-Equity Ratio
1.38
1.23
0.92
0.79
0.67
Long Term Debt-Equity Ratio
0.65
0.17
0.04
0.11
0.13
Current Ratio
0.85
0.84
0.93
1.04
1.27
Interest Cover Ratio
3.1
3.14
4.35
8.16
7.7
-
Company is reducing debt in its capital structure and aims to reduce to zero in coming years.
-
Interest coverage ratio is at 7.7 far above its peers. We believe company improves even better with the reduction in debt.
-
Company has blessed with substantial benefit from duty drawback (≈7%) ICRA.
-
Company is investing 100 Cr over next 3 years. It also has to plan expand inorganically by acquiring smaller brands in US. Company plans to raise this money by bank loan. ICRA
INVESTMENT RATIONALE
Company has consistently reported CAGR of above 25% over the past years. However over the next 4-5 years we believe company will growth at 16.81% before attaining saturation growth of 9% thereafter.
Capital Expenditure may yield excess return: Company is increasing capital expenditure of 100 Cr over next 3 years and 80% of this is funded by debt. The capex is distributed equally over three year’s time horizon for simplicity. It is expected to create growth assets which will increase the new worth of the company. EPS growth is substantially reduced because of this reason.
For valuation purposes we have considered the changing capital structure for analyzing growth and discount rate. We also made the assumption that the company over the long run intends to finance 100% equity. Debt-free will attract more DII and FII inflow but also the company will lose tax advantage because interest expenses are tax-deductible. We presume tax over the next few years will be constant and Forex fluctuations are subtle.
Expansion to the US and Europe: The company wants to enter other markets organically and inorganically. Research reports that the company is in final talks with a US-based firm for its tie-up to launch new brands. moneycontrol
If the rupee depreciates even further, this will boost exports and profits significantly. Forex net earnings increased 54.15% from Rs. 231.85 Cr last year to Rs 357.4 Cr this time.
In 2-3 years, KTG will look at having two to three private labels and an own brand. Given the popularity of the private label (well-known toys brand in the US), management believes KTG will not have to invest significantly in brand promotion. It expects additional capacities to be devoted exclusively towards private label and the own brand. In five years time, management targets to have 100% of revenue from direct sales, thus transitioning it into a complete B2C player.
VALUATION
Company’s revenue is expected to grow at 16.81% and even greater 27% CAGR in net profits driven by greater operational efficiencies owing to integrated operations and scale selected benefits. Improvement in execution, stabilization of margins, peaking of the working capital cycle and cash flow improvement to remain key drivers for the stock. The company has sustained an EBIDTA margin of 45.09% and net margin of 28.19%.
We value company Rs. 2549.11 Cr at Rs. 1172.84 per share using DCF valuation (Free Cash Flow to the Equity). Currently stock is trading at Rs. 905 per share. We believe the stock will reach the target of 1250 a year from now. Further relative valuation technique suggests that the stock is trading at a 10-12% discount with its top competitors using PEx. The stock price may wave from 875 to 1120 in the medium term.
We recommend BUY above 950. One can hold on to the stock for a year or odd to avail 30-35% returns.
INDIAN TEXTILE INDUSTRY
The Indian textiles industry, currently estimated at around the US $108 billion, is expected to reach US $ 141 billion by 2021. India has the second-largest manufacturing capacity globally. The textile industry accounts for about 24% of the world’s spindle capacity and 8% of global rotor capacity. India holds a strong production base of a wide range of fiber/yarn from natural fibers like cotton/jute, silk, and wool to synthetic/ man-made fibers like polyester, viscose, nylon, and acrylic.
India enjoys a comparative advantage in terms of skilled manpower and cost of production over major textile producers. There is also increased penetration of organized retail, favorable demographics and rising income levels to drive textile demand.
-
7 Million Tones of FBP in 2013-14.
-
2nd largest textile manufacturer in the world.
-
2nd largest producer of silk and cotton. makeinindia
The textiles sector has witnessed a spurt in investment during the last five years. The industry (including dyed and printed) attracted foreign direct investment (FDI) worth US$ 1,522.51 million during April 2000 to December 2014, has helped industry to absorb pain it had over years due to lack of effective policy, irregularity of monsoon in India, etc. The domestic textile and apparel industry in India is estimated to reach USD 100 Billion by 2016.
Major growth drivers include
-
Rising per capita income
-
Favorable trade policies and superior quality will drive textile exports
-
Favorable policies instituted by the government. Indian government has introduced “Skill India”; the integrated skill development scheme aims to train over 2.675 million people up o 2017, covering all sub-sectors of the textile sector – textile and apparel, handicrafts, handlooms, jute ad sericulture.
-
100% FDI is allowed under the automatic route in the textile sector.
INVESTMENT RISKS
US economic growth has been revised up to 3.6% largely due to more roust private domestic demand. Cheap oil is boosting real incomes and consumer sentiment. Monetary policy is accommodative keeping interest rates low.
The growth forecast for China, where investment growth has slowed and is expected to moderate further, has been marked down to below seven percent. The authorities are now expected to put greater weight on reducing vulnerabilities from recent rapid credit and investment growth and hence the forecast assumes less of a policy response to the underlying moderation. This lower growth, however, is affecting the rest of Asia.
China, Europe, Japan along with the U.S. (the four largest economies in the world) will largely determine the direction of the global economy through the rest of this year and into 2016. The good news is that the advanced economies overall will perform more strongly and contribute more to global growth in 2015.
FINANCIAL PROFILE
Kitex Garments Limited is in the business of manufacturing and exporting garments. The Company manufactures different types of garments, such as hosiers, shirts, pants, jackets, innerwear and outerwear. The company also exports infant and children’s wear, and jackets to the United States. Kitex Garments Limited is based in Kochi, India. Kitex Garments Ltd. was incorporated in 1992. It made its public issue in the year 1995. It is promoted by Boby M Jacob, Kitex Exports Ltd, Sabu M Jacob and Somy Varghese. During the fiscal year ended March 31, 2010, the export sales mainly consisted of infant and children's wear and jackets intended for the United States market. During the fiscal year ended March 31, 2010, the Company produced 87,779,618 readymade garments.
The Company is a part of the larger Anna-Kitex Group, which has diversified interests in aluminium vessels, home appliances, spice trading and textiles. KGL is primarily engaged in the manufacture and export of infant wear (less than 24 months) to apparel retailers based out of the US and UK. The Company has a fully integrated manufacturing facility at Kizhakkambalam (Kerala) with a facility to manufacture 2.2 lakhs pieces per day and a fabric processing capacity of 42MTPD. KGL also supplies fabric to group entity Kitex Children swear Limited, which in turn holds 15.47% in the Company as on 30.06.2014. KGL is listed both in the NSE and the BSE.
The company has reported Net sales of Rs. 479.02Cr, up 19% from last year Sales of Rs. 402.8 Cr.
For the quarter ended 31-June-2015, 6.78% from last year same quarter Sales of Rs. 105.2 Cr to Rs. 114.98 Cr. Company has reported net profit after tax of Rs. 15.98 Cr and EPS stands at Rs. 3.36 in latest quarter.
|
INCOME STATEMENT Yearly |
FY 2013 |
FY 2014 |
FY 2015 |
FY 2016 E |
FY 2017 E |
|
Total Income |
321.01 |
455.55 |
524.52 |
610.54 |
710.67 |
|
Total Expenditure |
256.87 |
347.07 |
342.36 |
398.51 |
463.86 |
|
EBITDA |
64.14 |
108.48 |
182.16 |
212.03 |
246.81 |
|
Interest |
11.47 |
10.62 |
19.16 |
22.30 |
25.96 |
|
PBDT |
52.66 |
97.87 |
163 |
189.73 |
220.85 |
|
Depreciation |
8.62 |
9.68 |
21.33 |
24.83 |
28.90 |
|
PBT |
44.04 |
88.19 |
141.67 |
164.90 |
191.95 |
|
EBIT |
55.52 |
98.8 |
160.83 |
187.21 |
217.91 |
|
Tax |
14.66 |
30.82 |
43.15 |
50.23 |
58.46 |
|
Reported Profit After Tax |
29.38 |
57.37 |
98.52 |
114.68 |
133.48 |
|
EBITDA margin |
19.98% |
23.81% |
34.73% |
34.73% |
34.73% |
|
NET margin |
9.15% |
12.59% |
18.78% |
18.78% |
18.78% |
|
EPS |
6.19 |
12.08 |
20.74 |
24.14 |
28.10 |
|
PE |
|
10.76 |
31.34 |
51.78 |
44.48 |
|
INCOME STATEMENT Quarterly |
1st Qtr 201406 |
2nd Qtr 201409 |
3rd Qtr 201412 |
4th Qtr 201503 |
1st Qtr 201506 |
|
Net Sales |
96.18 |
120.95 |
114.2 |
147.69 |
96.83 |
|
Other Operating Income |
6.58 |
7.25 |
7.9 |
10.34 |
12.25 |
|
Other Income |
2.43 |
5.26 |
5.1 |
0.63 |
5.9 |
|
Total Income |
105.2 |
133.46 |
127.19 |
158.66 |
114.98 |
|
Total Expenditure |
75.56 |
94.55 |
80.18 |
92.07 |
78.93 |
|
EBIDT |
29.64 |
38.91 |
47.02 |
66.59 |
36.74 |
|
Interest |
3.56 |
4.11 |
6.55 |
4.95 |
4.77 |
|
EBITDA |
33.2 |
43.02 |
53.56 |
71.54 |
36.74 |
|
Depreciation |
5.04 |
5.18 |
5.28 |
5.83 |
5.46 |
|
PBT |
21.04 |
29.63 |
35.18 |
55.82 |
30.59 |
|
Tax |
6.6 |
10.31 |
12.05 |
14.19 |
9.84 |
|
Reported Profit After Tax |
14.44 |
19.32 |
23.13 |
41.63 |
15.98 |
|
|
|||||
|
No of Shares |
47500000 |
47500000 |
47500000 |
47500000 |
47500000 |
|
EBITDA margin |
30.82% |
32.17% |
41.17% |
45.09% |
37.23% |
|
NET margin |
15.01% |
15.97% |
20.25% |
28.19% |
16.50% |
|
EPS |
3.04 |
4.07 |
4.87 |
8.76 |
3.36 |
- Share :


Post a Comment
|
DISCLAIMER |
This report is only for the information of our customers. Recommendations, opinions, or suggestions are given with the understanding that readers acting on this information assume all risks involved. The information provided herein is not to be construed as an offer to buy or sell securities of any kind. ATS and/or its group companies do not as assume any responsibility or liability resulting from the use of such information.