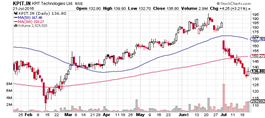
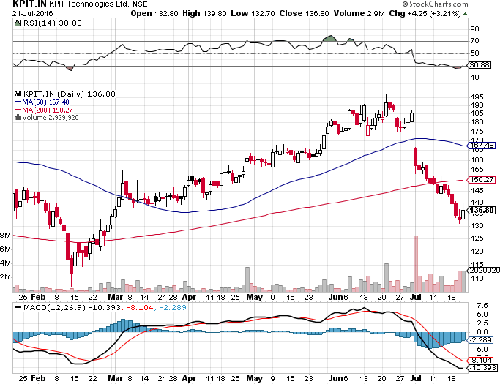
KPIT Technologies Ltd
KPIT Technologies (formerly KPIT Cummins Info systems Ltd) is Indian Multinational Corporation with registered office in Pune, Maharashtra, India. Popularly known as KPIT, the company provides product engineering services and solutions, IT consulting services and technologies. Headquartered in Pune, India.
|
BSE |
532400 |
|
NSE |
KPIT |
|
REUTERS |
KPIT.BO |
|
INCEPTION |
1990 |
|
IPO |
1999 |
|
INDUSTRY |
IT-SOFTWARE |
|
CMP (as on 22/7/2016) |
134.50 |
|
Stock Beta |
0.9593 |
|
52 Week H/L |
98 -196.85 |
|
Market Cap (Cr) |
3674.46 |
|
Equity Capital (cr) |
39.50 |
|
Face Value (Rs) |
2 |
|
Average Volume |
1,94,89,392 |
|
Shareholding Pattern (%) |
|
|
Promoters |
16.82 |
|
Non Institutions |
83.18 |
|
Grand Total |
100 |
KPIT Technologies - Potential Catalysts
-
Restructuring burden reduced. Company focusing on integrating the changes.
-
Good addition of client
-
Potential to improve of margins by 100bps
-
Cash flow continues to grow inorganic way
KPIT Technologies - Recommendation
With Superior project management skills, focus on measuring and monitoring quality and its planned expansion KPIT Technologies will be able to grow over the next few years. We recommend BUY on the stock at CMP of Rs. 134.50 to target of Rs 198 (Forward EPS of 15.32x FY17).
KPIT Technologies - Financial Summary
|
Yearly Income Statement |
2014 |
2015 |
2016 |
2017 E |
2018 E |
|
Total Income |
2698.52 |
3025.10 |
3249.06 |
3411.47 |
3710.36 |
|
EBIDTA |
422.76 |
359.59 |
448.78 |
490.51 |
537.89 |
|
EBIT |
368.81 |
274.46 |
379.65 |
405.22 |
446.99 |
|
Net Income |
248.96 |
237.00 |
281.49 |
300.51 |
332.13 |
|
EPS (Unit Curr.) |
12.61 |
12.00 |
14.25 |
15.22 |
16.82 |
|
EBIDTA Margin |
15.69% |
12.03% |
13.92% |
14.44% |
14.56% |
|
EBIT Margin |
13.69% |
9.18% |
11.77% |
11.93% |
12.10% |
|
PAT Margin |
9.23% |
7.83% |
8.66% |
8.81% |
8.95% |
BUSINESS DESCRIPTION
KPIT Technologies Limited is an India-based company engaged in providing software and information technology (IT) enabled services globally. The principal businesses of the company are computer programming, consultancy, and related activities. It operates as product engineering and IT consulting partner for automotive, manufacturing, and energy and utility companies. It operates in the USA, UK & Europe and Rest of World segments. KPIT has a global extended product lifecycle management (EPLM) practice, which offers to consult, platform-based products, enterprise level analytics, application management services (AMS), and enterprise cost management solutions. It offers technology solutions and services and it partners with around 200 global corporations, including original equipment manufacturers (OEMs) and Tier one companies.
Its subsidiaries include KPIT Infosystems Inc., KPIT Technologies (UK) Limited and KPIT Infosystems ME FZE.
KPIT was co-founded in 1990 by Ravi Pandit and Kishor Patil, as KPIT Infosystems. Both the co-founders are Chartered Accountants by profession & were partners in the Chartered Accountancy firm Kirtane and Pandit Chartered Accountants. KPIT launched its initial public offer (IPO) in 1999, which was 50 times oversubscribed.
In 2002, Cummins InfoTech, the IT arm of Cummins Inc. merged with KPIT and the name of the Company became KPIT Cummins Infosystems Ltd. It changed its name to "KPIT Technologies Limited" in September 2013. This was in line with Cummins' decision to reduce its shareholding in KPIT to focus on its core business of engine and generator manufacturing.
KPIT Technologies Ltd. key Products/Revenue Segments include
-
Software Development Charges which contributed Rs 1132.66 Cr to Sales Value (90.92% of Total Sales)
-
Sale of Products which contributed Rs 86.26 Cr to Sales Value (6.92% of Total Sales)
-
Others which contributed Rs 26.82 Cr to Sales Value (2.15% of Total Sales) for the year ending 31-Mar-2015.
MANAGEMENT & GOVERNANCE
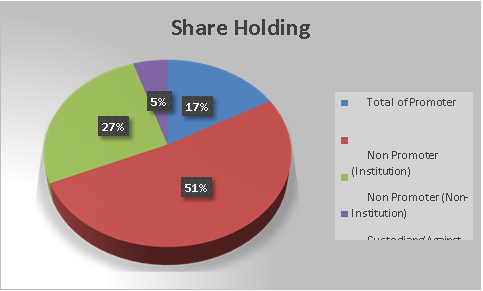
Shareholding pattern as on March 31st, 2016
|
|
No of Shares |
% of Holding |
|
Description as on |
31/03/2016 |
31/03/2016 |
|
Foreign (Promoter & Group) |
40000 |
0.02 |
|
Indian (Promoter & Group) |
33175670 |
16.8 |
|
Total of Promoter |
33215670 |
16.82 |
|
Non Promoter (Institution) |
101936440 |
51.61 |
|
Non Promoter (Non-Institution) |
52674224 |
26.67 |
|
Total Non Promoter |
154610664 |
78.28 |
|
Total Promoter & Non Promoter |
187826334 |
95.1 |
|
Custodians(Against Depository Receipts) |
9672408 |
4.9 |
|
Grand Total |
197498742 |
100 |
|
KEY PEOPLE |
|
|
Kishor Patil |
Chief Executive Officer and Managing Director |
|
S.B. Pandit, Ravi |
Non-Executive Chairman and Group Chief Executive Officer |
|
Anil Patwardhan |
Chief Financial Officer |
|
Anant J. Talaulicar |
Non-Executive Director |
|
Dr. Alberto Sangiovanni-Vincentelli |
Independent Director |
Company has BSR & Co. as its auditors.
|
EQUITY - BONUS HISTORY |
|||
|
Year |
Ratio |
Book Value -Unit Curr |
EPS -Unit Curr |
|
2012 |
1:01 |
66.15 |
7.8 |
|
2007 |
1:01 |
94.73 |
18.31 |
|
1996 |
2:01 |
0 |
0 |
|
1994 |
1:01 |
0 |
0 |
INDUSTRY OUTLOOK
Over the last four quarters, almost all top Indian IT companies have reported lower than expected revenue growth in organic terms. While cross currency impact has played its part, CC growth too has been rather muted. The average rolling annualized USD revenue growth for the top‐4 in the last four quarters has been a muted 7.8%. While this might be anecdotal evidence of the present and forthcoming slowdown in the IT Services sector, the real reason we believe, is rooted deep in the past. We dare to call the last decade a ‘lost decade’ for the Indian IT services industry.
Everything going its way in the last decade
The Indian IT services industry had a lot going for it in the last decade. Developments, both micro and macro, led to an unprecedented growth for the entire industry and significant cash accrual.
-
USD‐INR tailwind
Over the last decade, USD‐INR depreciated by 36%, providing a significant boost to the margins of the Indian IT companies. Accordingly, the operating margins for TCS/HCL/Wipro expanded 117/301/35bps over the last decade.
-
Indian IT companies gaining market share from global counterparts
Over the last decade, companies such as TCS, Infosys, and HCL Tech grabbed a large amount of market share from global counterparts such as IBM, Cap Gemini, and Atos Origin. While part of this success was attributable to USD‐INR depreciation, which made their pricing more competitive, there was also a remarkable enhancement of customer confidence in the delivery capabilities of Indian IT companies. All this was borne out of the hard work and investments by the industry in the preceding decade.
-
The supply advantage
The number of engineering graduating every year in India has grown by 284% over the last decade. While the country produced 0.38mn engineers in 2006, today it produces 1.45mn. This surge in the supply of engineers meant that IT companies have abundant resources available to them, without having to worry about the cost. Little surprise that TCS, the market leader in setting industry salaries, did not raise its fresher‐level salaries for the last seven years.
These tailwinds meant that the entire sector had windfall gains in the last decade. Top‐4 companies reported 21% CAGR in topline, 21% CAGR in earnings, and their market cap grew by 3.8x over the last decade. The growth also meant that the top‐4 Indian IT companies generated cumulative Operating Cash Flow of Rs 2.1tn over the last 10 years.
INVESTMENT RATIONALE
Restructuring burden reduced. Company focusing on integrating the changes.
The company has been going through specific transformational changes. The business of KPIT is now restructured under verticals/ SBU’s v/s previously horizontals.
-
Integrated Enterprise Solutions (IES)
-
Automotive & Allied Engineering (A&E)
-
SAP
-
Business Transformation Unit (BTU)
The offering led approach caused under penetration of services among customers across verticals with gap in services provided to accounts. This was evident from high concentration of services in KPIT’s verticals, leaving potential areas for growth untapped. To ensure consolidated offerings, KPIT reorganized its business to focus on verticals mentioned above. As a result, sales and account management functions were organized by verticals and backed by offerings provided by SBU’s. Recently the company has hired talent from Tier 1 competition to strengthen its vertical leadership.
SAP contributes ~25% to revenues after consecutive years of growth but saw a decline in revenues in recent years owing to technology transition. KPIT had to continuously align its offerings in line with changes in SAP portfolio. Delays in deal closures and changing product mix impacted the company’s growth. In view of the above, the company made significant investments in Asia and Europe to increase its footprints as well as foray into newer areas of ERP’s and next level of cloud and HANA. Moving towards more annuity based business gives sufficient sustainability to revenues going forward. The company has also built a strong team in Success Factors adding to growth capability.
Good addition of client
KPIT has won several clients in last 2-3 years’ time span on the back of its go-to-market strategy, majorly in the areas of automotive & allied engineering and SAP. However, owing to its horizontal organizational structure, these accounts remained under-penetrated. The company was highly missing an opportunity to cross-sell and grow its share of business from the existing customer base.
In order to mine these accounts, KPIT has put in place a vertical sales structure to bring collaboration and cross-selling across business units. To aid the process, it also formed a business transformation unit that will bring together the strengths of all SBU’s and create larger deals for strategic accounts.
ERP business – the pain continues
KPIT’s SAP business is a perfect example of being at the wrong place at the wrong time. While the world was moving to the SAP HANA platform, KPIT acquired Sparta Consulting – a company with a significant presence in the SAP domain, but with capabilities in the older version, which was slowly becoming obsolete. This lack of foresight from the management led to KPIT not being able to cater to the demand in the SAP business – leading to an 11% decline in the vertical over FY13-15. At the same time, training employees on the new version meant margin erosion, leading to a double whammy for the earnings. While the SAP vertical showed some signs of revival in FY16, the issues leading to the 2Q FY17 profit warning are related to its Oracle ERP implementation. We see multiple headwinds for KPIT’s ERP business now, which will lead to muted growth in this division.
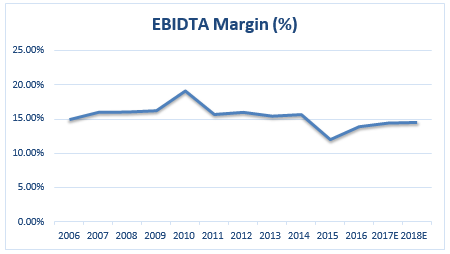
Expansion of margins facing resistance but not impossible overcome
Margins will be a tight balance ahead, between further pyramid rationalization (higher fresher hiring) and improving offshore utilization (70%). The current quarter (Q1) is had a margin contraction of ~150bps impact of salary hike and visa cost, and the earlier cushion of rupee depreciation is expected to be absent for the next few quarters. We expect margins to be a current level in par management expectations of 14-16%. Due to integrations of restructuring and cutting costs, we expect margins to improve by 100 bps.
|
FY |
2006 |
2007 |
2008 |
2009 |
2010 |
2011 |
2012 |
2013 |
2014 |
2015 |
2016 |
2017E |
2018E |
|
EBIDTA Margin (%) |
14.95% |
16.02% |
16.06% |
16.26% |
19.16% |
15.72% |
16.03% |
15.46% |
15.69% |
12.03% |
13.92% |
14.44% |
14.56% |
Cash flow continues to grow inorganic way
KPIT Technologies reported strong growth of 31% over FY10‐15, because of acquisitions. The company spent US$ 107mn over the period to acquire 5 companies. The inorganic strategy helped meet guidance and achieve scale. But the same led to its equity being diluted to 199 mn shares in FY15 from 157 mn in FY10. Over the last five years, the company has reported negative free cash flow but the reduction of debt and better integration will reduce the cost and increase cash flow.
VALUATION
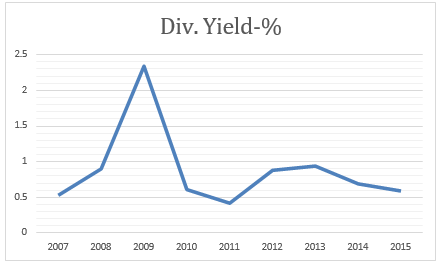
KPIT Technologies is currently trading at 134.50 per share with a market capitalization of 3675 Crores. It has a negligible debt with long-term Debt to Equity of 0.08. Most of the debt was acquired because of acquisitions made in the last few years. We also expect the company's debt levels are also expected to gradually decline over the next 12-18 months owing to its lower capital expenditure plan (exception of its inorganic growth). It has total cash and bank balance of 395 Cr. Its payout is consistently ranging from 0.45-0.65 %.
The consistent dividend will help institutions who hold huge large stakes get incentives and is treated as a boost to investors.
|
Year End |
Dividend Amount |
Dividend-% |
Div. Yield-% |
|
2015 |
21.73 |
55 |
0.59 |
|
2014 |
21.37 |
55 |
0.69 |
|
2013 |
17.38 |
45 |
0.94 |
|
2012 |
12.47 |
35 |
0.88 |
|
2011 |
6.17 |
35 |
0.42 |
|
2010 |
5.5 |
35 |
0.61 |
|
2009 |
4.68 |
30 |
2.34 |
|
2008 |
5.45 |
35 |
0.9 |
|
2007 |
5.23 |
35 |
0.53 |
KPIT Technologies Ltd, a global IT services, and product engineering company thrives to attain revenues of Rs 3700Cr by FY18E. Results were disappointing in the last few years was led by restructuring effects, subdued SAP SBU performance, de-growth in top client,s and delays in deal closures.
However, with a new organization structure in place, the management is confident enough of turning around the corner in pain areas through new sales structure, increased cross selling and mining, potential margin expansion and focus on improving utilization and effort mix.
The expected revival in auto sector will also lead to growth, KPIT being a leader in the area is poised to take advantage of the same. Moreover, the company’s focus on client mining through broad based growth would add to revenues going forward.
We value KPIT with the fair price of 164 using DCF valuation and recommend for a price target of 198 for FY17 with revenue CAGR 7% for FY16-FY18. For valuation we assume that over the period company will keep capital structure unaltered and tax rate unchanged.
|
Valuation Ratio |
2013 |
2014 |
2015 |
2016 |
|
Price Earning (P/E) |
9.94 |
9.44 |
12.16 |
15.22 |
|
Price to Book Value ( P/BV) |
2 |
1.79 |
2.34 |
2.73 |
|
Price/Cash EPS (P/CEPS) |
7.58 |
7.61 |
9.97 |
11.14 |
|
EV/EBIDTA |
6.23 |
5.85 |
7.77 |
10.24 |
|
Market Cap/Sales |
0.95 |
0.83 |
1.11 |
1.18 |
|
KEY RATIOS |
2013 |
2014 |
2015 |
2016 |
|
- Debt Equity Ratio |
0.34 |
0.34 |
0.31 |
0.3 |
|
- Current Ratio |
2.69 |
2.92 |
2.6 |
2.06 |
|
- Debtors Velocity |
85.19 |
91.36 |
76.19 |
102.99 |
|
- Creditors Velocity |
26.61 |
20.18 |
45.22 |
83.07 |
Relative Valuation
Values are as of 21st July, 2016
|
Company Name |
Market Cap |
EPS (cons.) |
Market Price |
P/E Ratio |
P/BV - cons |
|
Vakrangee |
9118.05 |
6.81 |
172.3 |
25.31 |
7.54 |
|
Hexaware Tech. |
6466.37 |
13.06 |
214.25 |
16.41 |
4.51 |
|
eClerx Services |
5851.15 |
75.46 |
1433.5 |
17.28 |
8.19 |
|
KPIT Tech. |
3674.46 |
14.7 |
186.05 |
9.55 |
2.66 |
|
NIIT Tech. |
3135.5 |
43.22 |
512.45 |
21.62 |
2.31 |
|
Take Solutions |
2089.37 |
9.45 |
170.7 |
18.07 |
3.98 |
|
Accelya Kale |
1668.58 |
48.96 |
1117.6 |
24.7 |
14.53 |
|
Sonata Software |
1578 |
14.26 |
150 |
10.52 |
3.68 |
|
|
|||||
|
Average |
|
28.24 |
|
17.93 |
5.93 |
KPIT Technologies Ltd is trading at discount to its peers, P/E at 9.55 against average of 18 with its peers. At 18 P/E KPIT should be trading at its fair market value of 264 per share. Though this value is on the higher side, with the quality of KPIT’s management, its lower debt and good growth, it should be trading near to its fair value of 164. We believe that KPIT could trade at premium given its strong brand equity, healthy growth prospects, improving profitability margins, better return ratios, strong balance sheet and prudent management.
|
Co_Name |
Market Cap |
Total Debt |
Sales |
EBIDT |
EBIT |
PAT |
Book Value |
Long Term D/E Ratio |
EBIDTM (%) |
ROCE (%) |
|
Vakrangee |
5178.5 |
416.04 |
2780.48 |
729.13 |
564.27 |
321.31 |
19.01 |
0.06 |
26.22 |
38.91 |
|
eClerx Services |
4825.03 |
0 |
942.12 |
348.62 |
298.6 |
229.74 |
235.53 |
0 |
37 |
44.5 |
|
KPIT Tech. |
3702.16 |
504.95 |
3002.38 |
359.58 |
274.45 |
236.78 |
68.88 |
0.08 |
11.98 |
15.09 |
|
NIIT Tech. |
2129.86 |
8.61 |
2372.5 |
273.22 |
181.58 |
152.81 |
222.35 |
0 |
14.64 |
18.5 |
|
Sonata Software |
1874.66 |
24.42 |
1682.13 |
190.73 |
184.66 |
131.35 |
40.74 |
0 |
11.34 |
44.2 |
|
Take Solutions |
1571.62 |
208.8 |
730.43 |
157.67 |
98.06 |
69.57 |
43.7 |
0.06 |
21.59 |
13.75 |
|
Accelya Kale |
1488.15 |
0 |
302.82 |
120.55 |
107.23 |
67.38 |
77.09 |
0 |
39.81 |
90.38 |
|
|
||||||||||
|
Average |
|
166.12 |
1687.55 |
311.36 |
244.12 |
172.71 |
101.04 |
0.03 |
23.23 |
37.90 |
CREDIT RATING
|
Total Bank Loan Facilities Rated |
Rs.4445.5 Million |
|
Long Term Rating |
CRISIL AA-/Stable (Outlook revised from 'Negative' and rating reaffirmed) |
|
Short Term Rating |
CRISIL A1+ (Reassigned) |
CRISIL has its rating outlook on the long-term bank facilities of KPIT Technologies Ltd as 'Stable', while reaffirming the rating from the previous at 'CRISIL AA-'. CRISIL has also assigned its 'CRISIL A1+' rating to the short-term bank loan facilities.
CONCUSSION AND RECOMMENDATION
With Superior project management skills, focus on measuring and monitoring quality and its planned expansion KPIT Technologies will be able to grow over the next few years. We recommend BUY on the stock at CMP of Rs. 134.50 to target of Rs 198 (Forward EPS of 15.32x FY17).
RISKS AND CONCERNS
-
Currency And Hedging Risks
KPIT derives more than 90% of its revenues in foreign currency and more than 50% of costs are in INR. Adverse cross currency movements can have a severe impact on the margins as well as profitability.
-
The slower than expected U.S growth trajectory and sluggish Euro zone growth will drag on external demand.
-
Brexit may have impact on KPIT's top line short term as well as long term.
Pound depreciation by over 20% due to Brexit will have income reduction from UK and Europe geographical regions.
-
A disruptive increase in financial volatility could occur.
-
While financial market volatility remains very low from a historical perspective, anticipation of the interest rate tightening cycle in the United States—the timing and speed of which is uncertain—could induce sharp movements in term premiums and risk spreads in advanced and emerging market economies.
-
Slowdown in BFSI business, over the last six quarters, expected to continue. This will impact revenue as well as margins.
FINANCIALS
For the quarter ended 30-Jun-2016, the company has reported a Consolidate sales of Rs. 803.24 Cr., down -4.46% from last quarter Sales of Rs. 840.72 Cr. and up 5.92% from last year same quarter Sales of Rs. 758.32 Cr. Company has reported net profit after tax of Rs. 55.05 Cr. in latest quarter.
The company has reported good set of numbers on YoY as well. In Q4FY15, accounts closure had led to weak set of numbers for the quarter. However, the management’s focus on profitability, predictability, people and growth led to improved profits for Q4FY16. In rupee terms, Net sales grew by 10.2% and came in at Rs 840.7cr in Q4FY16 vs. Rs 762.9cr in Q4FY15.EBITDAmargins improved by 1133bps and came in at 15.7% in Q4FY16 vs. 4.4% in Q4FY15. APAT margins improved by 512 bps and came in at 11.7% in Q4FY16 vs 6.6% in Q4FY15.
|
Yearly Income Statement |
2012 |
2013 |
2014 |
2015 |
2016 |
2017 E |
2018 E |
|
Net Sales |
1500.01 |
2238.63 |
2694.04 |
2989.92 |
3224.29 |
3396.47 |
3695.36 |
|
Other Income |
23.87 |
-16.81 |
4.48 |
35.18 |
24.77 |
15.00 |
15.00 |
|
Other Operating Income |
0 |
0 |
0 |
0 |
0 |
0 |
0 |
|
Total Income |
1523.88 |
2221.82 |
2698.52 |
3025.10 |
3249.06 |
3411.47 |
3710.36 |
|
Total Expenditure |
1283.44 |
1875.79 |
2275.76 |
2665.51 |
2800.28 |
2920.96 |
3172.46 |
|
EBIDTA |
240.44 |
346.03 |
422.76 |
359.59 |
448.78 |
490.51 |
537.89 |
|
Depreciation |
44.49 |
47.15 |
53.95 |
85.13 |
69.13 |
85.29 |
90.90 |
|
EBIT |
195.95 |
298.88 |
368.81 |
274.46 |
379.65 |
405.22 |
446.99 |
|
Interest |
7.32 |
14.15 |
25.77 |
25.98 |
15.19 |
16.21 |
17.88 |
|
PBT |
188.63 |
284.73 |
343.04 |
248.48 |
364.46 |
389.01 |
429.11 |
|
Tax |
43.67 |
76.56 |
94.08 |
11.48 |
82.97 |
88.50 |
96.98 |
|
Deferred Tax |
0 |
0 |
0 |
0 |
0 |
0 |
0 |
|
Adjusted Profit After Tax |
144.96 |
208.17 |
248.96 |
237.00 |
281.49 |
300.51 |
332.13 |
|
Minority Interest After NP |
3.15 |
8.61 |
0 |
0 |
0 |
0 |
0 |
|
Profit/Loss of Associate Company |
3.53 |
-0.54 |
0 |
0 |
0 |
0 |
0 |
|
Extra-ordinary Items |
7.72 |
-0.95 |
8.88 |
0 |
-8.73 |
0 |
0 |
|
Adjusted Profit After Extra-ordinary item |
145.34 |
199.02 |
248.96 |
237.00 |
281.49 |
300.51 |
332.13 |
|
|
|||||||
|
Equity |
35.59 |
38.56 |
37.1 |
37.61 |
37.57 |
37.57 |
37.57 |
|
EPS (Unit Curr.) |
7.36 |
10.08 |
12.61 |
12.00 |
14.25 |
15.22 |
16.82 |
|
Face Value |
2 |
2 |
2 |
2 |
2 |
2 |
2 |
|
|
|||||||
|
EBIDTA Margin |
16.03% |
15.46% |
15.69% |
12.03% |
13.92% |
14.44% |
14.56% |
|
EBIT Margin |
13.06% |
13.35% |
13.69% |
9.18% |
11.77% |
11.93% |
12.10% |
|
PAT Margin |
9.54% |
8.96% |
9.23% |
7.83% |
8.66% |
8.81% |
8.95% |
|
Balance Sheet |
2012 |
2013 |
2014 |
2015 |
2016 |
|
EQUITY & LIABILITIES |
|
||||
|
Shareholders Fund |
712.44 |
1036.1 |
1273.64 |
1295.38 |
1380.69 |
|
Share Capital |
35.59 |
38.56 |
37.1 |
37.61 |
37.57 |
|
Reserves & Surplus |
676.85 |
997.53 |
1236.54 |
1257.77 |
1343.13 |
|
Money received against Share Warrants |
0 |
0 |
0 |
0 |
0 |
|
|
|||||
|
Share Application Money Pending Allotment |
0.11 |
0.14 |
1.48 |
0.77 |
0.06 |
|
Minority Interest |
32.6 |
27.02 |
0 |
0 |
0 |
|
Total Non-Current Liabilities |
104.37 |
160.23 |
153.37 |
120.32 |
218.82 |
|
- Long Term Borrowings |
66.87 |
145.92 |
130.05 |
77.99 |
167.27 |
|
- Deferred Tax Liabilities(Net) |
0.77 |
0 |
0 |
0 |
0 |
|
- Other Long Term Liabilities |
26.4 |
0.08 |
0 |
0 |
0 |
|
- Long Term Provisions |
10.32 |
14.23 |
23.32 |
42.33 |
51.55 |
|
|
|||||
|
Total Current Liabilities |
478.54 |
561.31 |
716.41 |
857.33 |
595.64 |
|
- Short Term Borrowings |
147 |
175.34 |
308.93 |
367.72 |
49.81 |
|
- Trade Payables |
175.65 |
190.4 |
102.06 |
133.16 |
123.34 |
|
- Other Current Liabilities |
99.89 |
125.97 |
225.89 |
291.8 |
329.42 |
|
- Short Term Provisions |
55.99 |
69.6 |
79.52 |
64.65 |
93.07 |
|
TOTAL EQUITY & LIABILITIES |
1328.05 |
1784.8 |
2144.9 |
2273.79 |
2195.22 |
|
|
|||||
|
ASSETS |
|
||||
|
Total Non-Current Assets |
646.57 |
780.12 |
955.17 |
958.9 |
917.47 |
|
- Fixed Assets(incl. Capital Work in Progress) |
185.27 |
200.46 |
216.09 |
232.82 |
285.04 |
|
- Goodwill on Consolidation |
362.25 |
442.34 |
599.41 |
508.79 |
402.47 |
|
- Non Current Investments |
21.75 |
11.76 |
11.76 |
22.47 |
11.76 |
|
- Deferred Tax Asset(Net) |
3.5 |
6.92 |
28.92 |
51.99 |
61.96 |
|
- Long Term Loans & Advances |
70.36 |
115.46 |
88.68 |
130.37 |
150.97 |
|
- Other Non-Current Assets |
3.43 |
3.19 |
10.31 |
12.46 |
5.28 |
|
|
|||||
|
Total Current Assets |
681.48 |
1004.68 |
1189.73 |
1314.89 |
1277.75 |
|
- Current Investments |
36.47 |
203.65 |
174.13 |
59.04 |
0 |
|
- Inventories |
0 |
0 |
3.43 |
22.88 |
38 |
|
- Trade Receivables |
423.26 |
467.28 |
674.3 |
697.87 |
686.09 |
|
- Cash & Cash Equivalents |
147.3 |
192.09 |
190.79 |
363.75 |
395.33 |
|
- Short Term Loans & Advances |
58.1 |
59.35 |
74.39 |
68.11 |
67.66 |
|
- Other Current Assets |
16.36 |
82.31 |
72.69 |
103.24 |
90.67 |
|
TOTAL ASSETS |
1328.05 |
1784.8 |
2144.9 |
2273.79 |
2195.22 |
|
Cash Flow Summary |
2012 |
2013 |
2014 |
2015 |
|
Cash and Cash Equivalents at Beginning of the year |
208 |
146.66 |
189.13 |
181.05 |
|
Net Cash from Operating Activities |
100.45 |
120.35 |
102.98 |
289.41 |
|
Net Cash Used in Investing Activities |
-270.2 |
-349.86 |
-190.08 |
-102.1 |
|
Net Cash Used in Financing Activities |
108.41 |
272.16 |
79.02 |
-40.34 |
|
Net Inc/(Dec) in Cash and Cash Equivalent |
-61.34 |
42.65 |
-8.08 |
146.97 |
|
Cash and Cash Equivalents at End of the year |
146.66 |
189.31 |
181.05 |
328.02 |
|
|
2012 |
2013 |
2014 |
2015 |
|
NP / PBT (X) |
0.77 |
0.7 |
0.73 |
0.95 |
|
PBT / EBIT (X) |
0.96 |
0.95 |
0.93 |
0.91 |
|
EBIT / Sales (X) |
0.13 |
0.13 |
0.14 |
0.09 |
|
Sales / Assets (X) |
1.75 |
1.83 |
1.67 |
1.64 |
|
Assets / Equity (X) |
1.31 |
1.4 |
1.4 |
1.41 |
|
ROE (X) |
0.22 |
0 |
0 |
0 |
|
Key Ratios |
2012 |
2013 |
2014 |
2015 |
|
|
||||
|
Debt-Equity Ratio |
0.23 |
0.32 |
0.37 |
0.39 |
|
Long Term Debt-Equity Ratio |
0.07 |
0.13 |
0.12 |
0.08 |
|
Current Ratio |
1.54 |
1.43 |
1.45 |
1.49 |
|
Turnover Ratios |
||||
|
Fixed Assets |
2.57 |
2.76 |
2.7 |
2.68 |
|
Inventory |
0 |
0 |
1571.03 |
228.23 |
|
Debtors |
4.5 |
4.95 |
4.72 |
4.38 |
|
Total Asset Turnover Ratio |
1.75 |
1.83 |
1.67 |
1.65 |
|
Interest Cover Ratio |
26.77 |
21.12 |
14.31 |
10.56 |
|
EBIDTM (%) |
16.03 |
15.46 |
15.69 |
11.98 |
|
ROCE (%) |
22.83 |
24.45 |
22.81 |
15.09 |
|
RONW (%) |
21.49 |
23.02 |
21.29 |
18.43 |
|
Payout (%) |
8.72 |
8.46 |
8.72 |
9.34 |
|
Price Ratios |
|
|
Current P/E Ratio |
9.42 |
|
P/E Ratio 5-Year High |
16.49 |
|
P/E Ratio 5-Year Low |
4.84 |
|
Price/Sales Ratio |
0.82 |
|
Price/Book Value |
1.89 |
- Share :


Post a Comment
|
DISCLAIMER |
This report is only for the information of our customers. Recommendations, opinions, or suggestions are given with the understanding that readers acting on this information assume all risks involved. The information provided herein is not to be construed as an offer to buy or sell securities of any kind. ATS and/or its group companies do not as assume any responsibility or liability resulting from the use of such information.