Kwality
Kwality - Background
Established in 1992, Kwality is one of the fastest-growing private-sector dairy companies in India. It has a new range of innovative products and enjoys a large presence in Northern India. It manufactures various dairy products, which include low cholesterol ghee, pure ghee pure cow ghee, butter, instant dairy creamer, dairy mix, skimmed/whole milk powder, milk in pouches, various curd products, curd,paneer, lassi, chaach, tetra pack milk, and ice cream, sterilized flavoured milk, yogurt,cheese etc. Kwality is one of the leading companies in institutional business segment by supplying to leading FMCG brands, government organizations, religious institutions, and retail chains
|
Key Parameters |
|
|
BSE Code |
531882 |
|
NSE Code |
KWALITY |
|
Reuters Code |
KDAI.NS |
|
CMP (as on 21/07/2015) |
76.30 |
|
Stock Beta |
1.39 |
|
52 Week H/L |
81/35.25 |
|
Market Cap (Cr) |
1708.29 |
|
Equity Capital (Rs cr) |
20.23 |
|
Face Value (Rs) |
1 |
|
Average Volume |
971972 |
|
|
|
|
Shareholding Pattern (%) |
|
|
Promoters |
69.56 |
|
Non Institutions |
31.44 |
|
Grand Total |
100 |
Kwality - Investment Rationale
-
Aggressive expansion plans will help exploit market opportunities.
-
Backward integration to aid margin expansion.
-
New product launches will trigger growth
-
Diversified presence and strong clientele.
-
Increase in Value Added Products in products mix will increase profits
Kwality - Risks and Concerns
-
Lack of control over milk yield.
-
Competition from unorganized sector.
-
Interest rate risk
Conclusion & Recommendation
With the growing organized diary market, the growth potential of diary based packed food market in India is tremendous. With the ongoing expansion on the current manufacturing capacity coupled with new product launches and entry into newer geographies, the outlook for Kwality is positive. The company has seen consistently growing in fast rate in the market.
At the current market price of Rs.76.30 the stock is trading at 7.3x FY17E EPS. Investors could buy the stock at CMP and add on dips to around Rs.66-68 levels (~6.4x FY17E EPS) for our sequential targets of Rs.95 and Rs.114 (~9x to ~10.8x FY17E EPS).
Financial Summary
|
Particulars (Rs. in Crs) |
FY13 |
FY14 |
FY15 |
FY16E |
FY17E |
|
Net Sales |
3929.68 |
5010.95 |
5876.99 |
6886.52 |
7860.17 |
|
Operating Profit |
221.54 |
298.51 |
361.67 |
434.04 |
504.1 |
|
PAT |
105.61 |
144.93 |
166.53 |
199.94 |
230.4 |
|
EPS (Rs.) |
5.18 |
7.12 |
8.02 |
9.14 |
10.53 |
|
PE |
5.73 |
4.43 |
12.04 |
8.35 |
7.25 |
Business Profile
Kwality was incorporated in 1992 as Kwality Dairy (India) Ltd. It was set up as a backward integration unit of Kwality Ice Creams India Ltd and was acquired by Dhingra Family in 2002.
Processing facilities
Kwality has various milk processing plants with a capacity to handle around 3 million liters of milk per day. Currently, Kwality has six manufacturing units located at Palwal (Haryana), Bulandsahar (UP), Saharanpur (UP), Jarar (UP), Sitapur (UP), and Ajmer (Rajasthan). Further, Kwality has an extensive network of milk chilling centers situated across Rajasthan, UP, Punjab, and Haryana for direct collection of milk from milk producers.
Procuring milk directly from farmers
To enhance the procurement of wholesome good quality milk directly from the milk producers, Kwality has increased milk procurement network in Haryana, Western Uttar Pradesh, Punjab, and Rajasthan. Milk producers supply milk directly to the Kwality Village Milk Collection Centre and milk from these centres are brought to Milk Chilling Centres for chilling. The company has adopted a producer-centric approach to buy raw milk based on the quality of milk. It has been practicing a transparent system for purchase based on testing the milk quality through highly efficient, automatic milk collection units to build confidence among milk producers.
Brands
Over the years, Kwality has been churning out quality and innovative dairy products to the Indian market. The company is one of the largest processors and handlers of dairy products in India in the private sector. It mainly market and sells its products under the umbrella Brand, “Dairy Best”, “Good Health”, “Kream Kountry”, “Live Lite”, etc.
Marketing
Kwality is one of the leading companies in institutional business segment by supplying to leading FMCG brands, government organizations, religious institutions, and retail chains such as Britannia, Hindustan Unilever, ITC, Mother Dairy, Cadbury’s, Canteen Stores Department, Vadilal, Cream Bell, Tirumala Tirupati Devasthanams, Shiromani Gurdwara Parbandhak Committee, Amritsar, and Delhi Sikh Gurdwara Management Committee. Keeping the high growth potential of the retail branded segment in view, it has increased its focus on this segment significantly. Kwality is working towards brand development, enhancement of product portfolio, and strengthening of retail distribution network. It has also shifted its focus from B2B to B2C and is simultaneously working towards improving the ratio of milk procurement from farmers.
International markets and products
Kwality has increased its focus on export of dairy products from India. Kwality has emerged as one of the leading exporter of dairy products from India, exporting across continents like Asia, Africa & Australia and to more than 28 countries including Japan, UAE, Seychelles, Bangladesh, Sri Lanka, Jordan, Niger, Morocco etc. Further, the company has established its 100% subsidiary, Kwality Dairy Products, FZE (KDPF) at Jebel Ali Free Zone, Dubai to increase its global footprint, develop and cater to new markets, and to focus on international trade. The company is engaged in trading of various milk based products, which are sold domestically as well as exported to other countries.
Product based revenue breakup (FY14)
|
Product |
Percentage |
|
Milk / Toned Milk |
58.76% |
|
Curd |
8.58% |
|
Fat/Butter/Cream/Ghee |
15.96% |
|
SMP/WMP/DC/DW/SNF |
15.65% |
Share Holding Pattern (FY15)
|
Share Holding Pattern |
Percentage (%) |
|
Foreign |
0.65 |
|
Institutions |
0.03 |
|
Govt. Holding |
0 |
|
Non Promoter Corp.Hold. |
10.77 |
|
Promoters |
69.56 |
|
Public & Others |
18.98 |
|
Totals |
100 |
Customer type revenue breakup (FY14)
|
Customer type |
Percentage |
|
Dealer/Distributer |
67.47% |
|
Corporate |
10.75% |
|
Retail |
17.68% |
|
Exports and others |
4.10% |
Subsidiary Information
Kwality Dairy has established a wholly-owned subsidiary under the name of “ Kwality Dairy Products- FZE” in the free trade zone of the United Arab Emirates to increase its global footprint and to develop and cater to new markets. The Company has been granted a trading license to deal in various milk-based products and will import Skimmed Milk Powder, Whole Milk Powder and various derivatives of Milk, Ghee, Butter & other Dairy products from Eastern European countries including Turkey, Poland, and Ukraine. The Company will sell products, both domestically and export to GCV, Middle East, Far East, Bangladesh, Thailand, etc.
Kwality also plan to set up a Milk Processing Unit in Dubai whereby the Company will process Skimmed & Whole Milk powder and other products with processing/ blending area of approx, 7000 sq ft and a capacity of 100 MT per day. The subsidiary Company is managed by a team of highly experienced and talented individuals with several years of experience in the field.
Investment Rationalize
-
Aggressive expansion plans will help exploit market opportunities.
Kwality is currently undertaking several expansion plans at a capex of more than Rs.300cr over 2015-17, which in turn will help to increase the manufacturing capacity and other related milk procurement functions of the company to a large extend. It will also help increase the number of milk chilling centers from 22 to 90 in the same period. Expansions will help to produce number of new diary related products which could in turn help it to make maximum exploitation of the market potential.
-
Change in customer needs to fuel growth.
Indian diary market to grow at CAGR of 13% to 15% till 2019-20 in which value added product segment of the milk industry is expected to grow at a more faster rate of 23% in the same period of time Urban population fast shifting to the packaged food product, increase the health consciousness and brand consciousness, fast-paced growth of Indian middle-class population, increase in per capita expenditure on food products and changes in shopping habits of people will supplement to the growth of the Kwality.
-
Backward integration to aid margin expansion.
Backward integration followed by Kwality will help it to reduce the expenses in the procurement of milk and also aid the company to decrease the cost of production. With state of art manufacturing facilities in place with modern sophisticated technology, Kwality will be able to keep the cost of production to the lowest among its peers and highest in terms of margins.
-
New product launches will trigger growth.
The launching of new and value-added products will help to increase the overall sales and profitability of the company to a big extend because most of the value-added products will have a higher margin when compared with normal dairy products and it will help the company to attract new customers with different needs and requirement. The value-added products market in the urban population is expected to grow at a fast pace of 33% per annum in the coming years and Kwality with its diversified product portfolio it will be in a good position to exploit the same.
-
Diversified presence and strong clientele.
Kwality is one of the leading companies in the institutional business segment by supplying to leading FMCG brands, government organizations, religious institutions, and retail chains such as Britannia, Hindustan Unilever, ITC, Mother Dairy, Cadbury’s, Canteen Stores Department, etc. Along with the growth potential of the diary-based products in general and the increase, the dairy-based products in the institutional customer's product portfolio will add to the overall growth of the company. Direct selling to the institutional customers and direct selling via modern trade outlets spread over various geographies will help the company to reduce the selling and distribution expenses.
-
Increase in Value Added Products in products mix will increase profits.
The increase in the percentage of revenue from value-added products in the overall revenue will increase the overall margin of the company to a big extend because the value-added products of the company are being sold at higher margins when compared with normal milk products. Quality aims to increase the percentage of revenue from value-added products to 25%(~13% in FY14) on the overall revenue by FY2017 will increase the overall profit margins to a large extend.
-
Exploitation of unorganized market.
With the diversified product portfolio and wide reach over geographies Kwality is well-positioned to take maximum advantage over the unorganized sector of the dairy market, which controls over 80% of the overall dairy industry in India, which needs proper channelization. With the rise in awareness of quality among the population, quality is an established brand with a wide range of products that will be in a sweet spot.
-
Strong financial performance.
Revenue of the company is growing at a CAGR of more than 40% and PAT at more than 25% per annum in the past few years and has a strong and healthy cash flow position. By taking the balance sheet and income statement into consideration, we feel that Kwality is a company that is in its growth and expansion stage. Greater affordability of its products due to an increase in income at customers disposal shows good growth prospects for the company.
-
Marketing Reach and Brand building will have crucial role.
Brand consciousness of various products is growing at a faster rate more than any other thing in the market. Branding of the products and services into a well recognized brand in the market to the targeted customers along with widening the geographical reach of its products will help in the optimum utilization of the market opportunity.
Risks and Concerns
-
Lack of control over milk yield.
Milk being the main raw material for the company, it is exposed to fluctuations in the production and cost of the milk, which is procured from company sources and from normal diary farmers.
-
Competition from unorganized sector and entry of new competitors.
In Indian diary industry approximately 80% is occupied by unorganized players which in turn compete with Kwality in most of its markets and geographies. With the huge opportunities in the diary and the packed diary based food products, there can be entry of many well established or small scale players into the market.
-
Interest rate risk.
Since, most of the capital expenditure is being met by debt (loans), Kwality is exposed to risk of changes in interest rates in the market.
Industry Overview
India which accounts for 18% of the world’s population with a growth rate of 1.3% annually is set to become world’s most populated country by 2030 with around 1.53 billion people and 19 %+ of world’s population. Dairy consumption tends to grow faster than that of food crops. As a result, the past three decades have seen buoyant growth in the consumption of livestock products, especially in newly industrializing countries and emerging markets.
India contributes to 15% of the global milk production and stands as the largest producer of milk in the world with a production of 122 MMT in 2011. The largest size of Indian Dairy Industry is estimated at around USD 60 billion with an annual growth rate more than ~16% percent in volume terms. The production & demand for milk is expected to continue and rise due to various factors including population growth, rise in income & changing life style. Post white revolution Indian dairy industry has shown a constant growth in milk production as well as in per capita milk availability.
While the dairy industry is growing at a compounded annual growth rate (CAGR) of 15-17%, the value-added products alone are growing way beyond 23%, it said. Milk is the country's biggest agricultural produce, contributing 22% to agricultural GDP. India overtook the US in 1998 to become the world's leading milk producer, accounting for over 15% of the global output, it said.
As per NDDB, the Indian dairy industry is all set to experience high growth rates in the next eight years with demand likely to reach 200 million tonnes by 2022 from 132 million tonnes in 2013. Presently, only 20% of the milk production comes from the organized sector comprising co-operatives and private dairies. The paramount factors driving the growth in the dairy sector include rising disposable incomes, advent of nuclear families and fast/instant food gaining ground in India. Other factors such as structural changes in food habits, expansion of fast food chains and popularity of pizzas and pastas aided the usage of milk variants of mozzarella cheese, processed cheese and flavored milk etc. (Source: CARE)
Peer group comparison
|
Sl.No. |
Name |
CMP in Rs. |
P/E |
Div Yld |
Mar Cap in Rs. Cr |
CMP / BV |
|
1 |
6071.05 |
46.04 |
0.85 |
58537.06 |
18.54 |
|
|
2 |
2881.9 |
72.23 |
0.44 |
34568.39 |
27.98 |
|
|
3 |
6388.15 |
46.04 |
0.69 |
26868.56 |
12.72 |
|
|
5 |
169 |
13.96 |
0.71 |
3978.26 |
3.06 |
|
|
6 |
Kwality Ltd |
76.3 |
11 |
0.11 |
1550.42 |
2.88 |
|
7 |
943.8 |
33.85 |
0.51 |
3687.43 |
9.08 |
Financials
Q4FY15 (Consolidated)
|
Particulars (Rs. in Crs.) |
4th Qtr 201503 |
4th Qtr 201403 |
VAR[%] |
4th Qtr 201503 |
3rd Qtr 201412 |
VAR[%] |
|
Gross Sales |
1358.62 |
1313.51 |
3.4 |
1358.62 |
1286.11 |
5.6% |
|
Excise Duty |
0 |
0 |
0 |
0 |
0 |
0.0% |
|
Net Sales |
1358.62 |
1313.51 |
3.4 |
1358.62 |
1286.11 |
5.6% |
|
Other Operating Income |
0.15 |
3.87 |
-96.1 |
0.15 |
0.11 |
36.4% |
|
Other Income |
6.97 |
3.67 |
89.9 |
6.97 |
3.47 |
100.9% |
|
Total Income |
1365.74 |
1321.05 |
3.4 |
1365.74 |
1289.69 |
5.9% |
|
Total Expenditure |
1277.58 |
1239.78 |
3 |
1277.58 |
1204.36 |
6.1% |
|
PBIDT |
88.15 |
81.27 |
8.5 |
88.15 |
85.33 |
3.3% |
|
Interest |
37.95 |
32.27 |
17.6 |
37.95 |
34.92 |
8.7% |
|
PBDT |
50.21 |
49 |
2.5 |
50.21 |
50.41 |
-0.4% |
|
Depreciation |
6.43 |
4.5 |
42.9 |
6.43 |
6.2 |
3.7% |
|
PBT |
43.77 |
44.5 |
-1.6 |
43.77 |
44.22 |
-1.0% |
|
Tax |
9.63 |
8.18 |
17.7 |
9.63 |
8.09 |
19.0% |
|
Reported Profit After Tax |
34.14 |
36.31 |
-6 |
34.14 |
36.12 |
-5.5% |
|
Extra-ordinary Items |
0 |
0 |
0 |
0 |
0 |
0.0% |
|
Adjusted Profit After Extra-ordinary |
34.14 |
36.31 |
-6 |
34.14 |
36.12 |
-5.5% |
|
PBIDTM(%) |
6.49 |
6.19 |
4.8 |
6.49 |
6.63 |
-2.1% |
|
PATM(%) |
2.51 |
2.76 |
-9.1 |
2.51 |
2.81 |
-10.7% |
FY15 Review – Consolidated Review
-
Revenues at Rs.5876.99cr v/s Rs.5010.95cr in FY14 ie 17.28% growth.
-
EBITA has grown 21.16% in FY15 ie Rs.361.60cr in FY15 v/s Rs.298.51cr in FY14.
-
PAT is at Rs.166.53cr in FY15 ie growth of 14.9% when compared with Rs.144.93cr in FY14.
-
Cash Reserves stands at Rs.51.65cr in FY15 v/s Rs.31.47 in FY14 ie growth of 64.12%.
Profit and Loss (Consolidated) rough estimates
|
Particulars (Rs. in Crs.) |
FY13 |
FY14 |
FY15 |
FY16E |
FY17E |
|
INCOME : |
|
|
|
|
|
|
Sales Turnover |
3929.68 |
5010.95 |
5876.99 |
6886.52 |
7860.17 |
|
Excise Duty |
0 |
0 |
0 |
0 |
0 |
|
Net Sales |
3929.68 |
5010.95 |
5876.99 |
6886.52 |
7860.17 |
|
Other Income |
0.73 |
4.03 |
11.73 |
16.5 |
22 |
|
Stock Adjustments |
1.44 |
80.42 |
1.35 |
1.59 |
1.87 |
|
Total Income |
3931.85 |
5095.4 |
5890.07 |
6904.6 |
7884.04 |
|
Total Expenditure |
3710.31 |
4796.89 |
5528.4 |
6496.62 |
7405.67 |
|
Operating Profit |
221.54 |
298.51 |
361.67 |
434.04 |
504.1 |
|
Interest |
93.68 |
116.71 |
140.31 |
130.36 |
137.56 |
|
Gross Profit |
127.86 |
181.8 |
221.36 |
270.51 |
317.26 |
|
Depreciation |
10.3 |
12.99 |
25.3 |
31.2 |
38.7 |
|
Profit Before Tax |
117.56 |
168.81 |
196.06 |
239.31 |
278.56 |
|
Tax |
13.58 |
23.51 |
29.53 |
38.16 |
46.13 |
|
Net Profit |
105.61 |
144.93 |
166.53 |
199.94 |
230.4 |
|
Extraordinary Items |
-2.43 |
0 |
0 |
0 |
0 |
|
Reported Net Profit |
108.04 |
144.93 |
166.53 |
199.94 |
230.4 |
Balance Sheet (Consolidated) rough estimates
|
Particulars (Rs. in Crs.) |
FY13 |
FY14 |
FY15 |
FY16E |
FY17E |
|
SOURCES OF FUNDS : |
|
|
|
|
|
|
Share Capital |
20.32 |
20.32 |
21.87 |
21.87 |
21.87 |
|
Reserves Total |
264.21 |
408.1 |
624.3 |
742.29 |
972.34 |
|
Equity Share Warrants |
0 |
0 |
18.75 |
18.75 |
18.75 |
|
Total Debt |
961.96 |
1095.96 |
1236.61 |
1412.11 |
1593.91 |
|
Other Liabilities |
0.56 |
0.75 |
1.39 |
1.73 |
2.145 |
|
Total Liabilities |
1247.05 |
1525.13 |
1902.92 |
2197.42 |
2579.42 |
|
APPLICATION OF FUNDS : |
|
|
|
|
|
|
Fixed Assets |
80.44 |
126.35 |
185.65 |
335.65 |
485.65 |
|
Intangible Assets |
1.27 |
1.42 |
0.04 |
0 |
0 |
|
Loans |
0 |
0 |
0 |
0 |
0 |
|
Investments |
0 |
0 |
0 |
0 |
0 |
|
Current Assets, Loans & Advances |
|
|
|
|
|
|
Inventories |
103.29 |
187.39 |
291.04 |
381.66 |
475.53 |
|
Sundry Debtors |
1009.1 |
1331.15 |
1324.59 |
1549.47 |
1768.5 |
|
Cash and Bank |
88.1 |
31.47 |
51.65 |
71.83 |
92.01 |
|
Loans and Advances |
60.35 |
32.1 |
121.06 |
131.88 |
162.235 |
|
Total Current Assets |
1260.84 |
1582.11 |
1788.34 |
2134.83 |
2498.27 |
|
Current Liabilities |
101.74 |
194.09 |
286.44 |
378.79 |
471.14 |
|
Provisions |
24.49 |
34.3 |
70.34 |
70.34 |
70.34 |
|
Total Current Liabilities |
126.23 |
228.39 |
282.55 |
368.71 |
446.87 |
|
Net Current Assets |
1133.08 |
1355.70 |
1578.32 |
1800.94 |
2023.56 |
|
Miscellaneous Expenses |
0 |
0 |
0 |
0 |
0 |
|
Deferred Tax Assets |
1.16 |
0.79 |
0.42 |
0.05 |
0 |
|
Other Assets |
31.09 |
40.87 |
50.65 |
60.43 |
70.21 |
|
Total Assets |
1247.04 |
1525.14 |
1902.92 |
2197.42 |
2579.42 |
Technical View
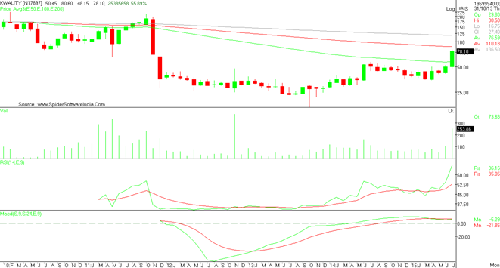
-
On monthly charts, the stock has given a breakout above Rs.51 levels and is currently trading at Rs76.30.
-
Going forward, for the medium term, we feel the stock to get support around Rs.66 levels, which can be used for averaging the stock.
-
It is currently trading above its 50,100 and 200 Day EMAs and has been holding the same level for some weeks. This is a bullish signal.
-
Weekly traded volumes have shown a strong jump over the last couple of months, which is also a good sign.
-
Momentum oscillator RSI is below the overbought level of 70 and is pointed upwards, suggesting further upside possible.
Conclusion and Recommendation
We are positive on Kwality over the long term and hence recommend a BUY at CMP and further add on declines between Rs.66-Rs.68 for a target of Rs.95 –Rs.114 with stop loss maintained at Rs.63.
- Share :


Post a Comment
|
DISCLAIMER |
This report is only for the information of our customers. Recommendations, opinions, or suggestions are given with the understanding that readers acting on this information assume all risks involved. The information provided herein is not to be construed as an offer to buy or sell securities of any kind. ATS and/or its group companies do not as assume any responsibility or liability resulting from the use of such information.